Sharif University of Technology
Scientia IranicaTransactions E: Industrial Engineering www.scientiairanica.com
Improved estimation of nite population median under
two-phase sampling when using two auxiliary variables
J. Shabbir
a;, S. Gupta
band Z. Hussain
aa. Department of Statistics, Quaid-i-Azam University, Islamabad 45320, Pakistan.
b. Department of Mathematics and Statistics, University of North Carolina at Greensboro, Greensboro, NC 27412, USA. Received 14 December 2013; received in revised form 21 April 2014; accepted 2 September 2014
KEYWORDS Auxiliary variables; Mean Squared Error (MSE);
Median; Eciency.
Abstract. We propose an ecient estimator for population median under two-phase sampling when using two auxiliary variables on the lines of Diana [Diana, G. \A class of estimators of the population mean in stratied random sampling", Statistica, 53(1), pp. 59-66 (1993)] and Jhajj and Walia [Jhajj, H.S. and Walia, G.S. \A generalized dierence-cum-ratio type estimator for the population variance in double sampling", Communications in Statistics-Simulations and Computation, 41, pp. 58-64 (2012)]. The expressions for mean squared errors are presented, correct to the rst order of approximation. Both theoretical and numerical comparisons reveal that the proposed estimator performs better than the unbiased sample median estimator, ratio estimator, and estimators by Srivastava et al. [Srivastava, S.K., Rani, S., Khare, B.B., and Srivastava, S.R. \A generalized chain ratio estimator for mean of nite population", Journal of the Indian Society of Agricultural Statistics, 42(1), pp. 108-117 (1990)] and Gupta et al. [Gupta, S., Shabbir, J., Ahmad, S. \Estimation of median in two-phase sampling using two auxiliary variables", Communications in Statistics-Theory and Methods, 37(11), pp. 1815-1822 (2008)].
c
2015 Sharif University of Technology. All rights reserved.
1. Introduction
Several authors including Kadilar and Cingi [1,2], Shabbir and Gupta [3], Koyuncu and Kadilar [4,5] and Diana et al. [6] have developed estimators for the nite population mean under dierent sampling schemes. However lesser degree of attention has been paid to estimation of population median. In many situations, median is a more appropriate measure of location than mean, particularly when the variable of interest follows a highly skewed distribution. Common examples of such variables are salaries, expenditure, and production quality. Kuk and Mak [7] introduced median ratio estimator that makes use of the auxiliary
*. Corresponding author.
E-mail addresses: [email protected] (J. Shabbir); [email protected] (S. Gupta); [email protected] (Z. Hussain)
information. Singh et al. [8] suggested an estimator for population median under two-phase sampling scheme using two auxiliary variables. Gupta et al. [9] have suggested a class of estimators for population median using two auxiliary variables. Singh et al. [8] and Gupta et al. [9] estimators are equally ecient in the sense of MSE, but Gupta et al. [9] estimator is generally preferable because of its lower bias in most situations. Al and Cingi [10] and Singh and Solanki [11] introduced some classes of median estimators when using single auxiliary variable. In this paper, we consider a problem of median estimation and propose an estimator that makes use of two auxiliary variables under two-phase sampling scheme.
Consider a nite population with N units. Let yi, xi and zi (i = 1; 2; ; N) be the values on the
ith population unit for the study variable y and two auxiliary variables x and z, respectively. Also let yi, xi and zi (i = 1; 2; ; n) be the values on the
Table 1. A matrix of proportions pij(x; y).
y My y > My Total
x Mx p11(x; y) p21(x; y) p:1(x; y)
x > Mx p12(x; y) p22(x; y) p:2(x; y)
Total p1:(x; y) p2:(x; y) 1
ith population unit included in the sample of size n drawn by simple random sampling without replacement (SRSWOR). Let My, Mxand Mz, respectively, be the
unknown population medians and ^My, ^Mx and ^Mz
be the sample medians for y, x and z, respectively. When population median of the auxiliary variable is not known, we draw a preliminary large sample of size n0 according to SRSWOR (i.e. n0 < N) and compute
^ M0
y, ^Mx0 and ^Mz0, the sample medians of the study
variable and the two auxiliary variables respectively. Further, we draw a subsample of size n from the initial sample of size n0 (i.e. n < n0) by SRSWOR and
compute ^My, ^Mxand ^Mz. Let y(1) y(2) y(n)
be the ordered sample values for the study variable y. Let t be an integer, such that y(t) My y(t+1) and
p = t=n be the proportion of the y values that are less than or equal to My. If Qy(t) denotes the tth quantile
of Y then ^My= ^Qy(0:5). Kuk and Mak [7] introduced
the following matrix of proportion pij(x; y) in Table 1.
Similarly, we can dene the matrices of propor-tions pij(x; z) and pij(y; z). It is assumed that as
N ! 1, the distribution of the trivariate variables (x; y; z) approaches a continuous distribution with marginal densities fx(x), fy(y) and fz(z) of x, y
and z, respectively. Let fy(My), fx(Mx) and fz(Mz)
be the probability density functions at My, Mx and
Mz, respectively. Let yx = 4p11(x; y) 1, yz =
4p11(y; z) 1 and xz = 4p11(x; z) 1 be the population
correlation coecients between variables indicated by the respective subscripts. Let e0 = ( ^My My)=My,
e0
0= ( ^My0 My)=My, e1= ( ^Mx Mx)=Mx, e01= ( ^Mx0
Mx)=Mx, e2= ( ^Mz Mz)=Mzand e02= ( ^Mz0 Mz)=Mz
such that E(ei) = E(e0i) = 0, i = 0; 1; 2.
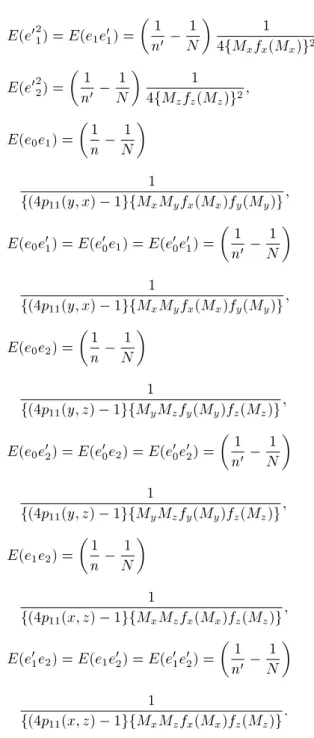
The following expected values are correct to rst degree of approximation (see [12]).
E(e2 0) =
1 n
1 N
1
4fMyfy(My)g2;
E(e2 1) =
1 n
1 N
1
4fMxfx(Mx)g2;
E(e2 2) =
1 n
1 N
1
4fMzfz(Mz)g2;
E(e02 0) =
1 n0
1 N
1
4fMyfy(My)g2;
E(e02
1) = E(e1e01) =
1 n0
1 N
1
4fMxfx(Mx)g2;
E(e02 2) =
1 n0
1 N
1
4fMzfz(Mz)g2;
E(e0e1) =
1 n
1 N
1
f(4p11(y; x) 1gfMxMyfx(Mx)fy(My)g;
E(e0e01) = E(e00e1) = E(e00e01) =
1 n0
1 N
1
f(4p11(y; x) 1gfMxMyfx(Mx)fy(My)g;
E(e0e2) =
1 n
1 N
1
f(4p11(y; z) 1gfMyMzfy(My)fz(Mz)g;
E(e0e02) = E(e00e2) = E(e00e02) =
1 n0
1 N
1
f(4p11(y; z) 1gfMyMzfy(My)fz(Mz)g;
E(e1e2) =
1 n
1 N
1
f(4p11(x; z) 1gfMxMzfx(Mx)fz(Mz)g;
E(e0
1e2) = E(e1e02) = E(e01e02) =
1 n0
1 N
1
f(4p11(x; z) 1gfMxMzfx(Mx)fz(Mz)g:
2. Some existing estimators
In this section, we discuss some of the existing estima-tors of population median (My).
The variance of the usual sample median estima-tor ( ^My) by Gross [13] is given by:
VarM^y
=
1 n
1 N
1
4ffy(My)g2: (1)
Chand [14] suggested the chain-ratio type estimator for population median (My) under two-phase sampling. It
is given by: ^
MR= ^My
^ M0
x
^ Mx
! Mz
^ M0
z
!
where Mzis known. The MSE of ^MR, to rst order of
the approximation, is given by:
MSEM^R
=4ff 1
y(My)g2
"1 n 1 N + 1 n 1 n0
Myfy(My)
Mxfx(Mx)
Myfy(My)
Mxfx(Mx) 2yx
+ 1 n0 1 N
Myfy(My)
Mzfz(Mz)
Myfy(My)
Mzfz(Mz) 2yz
# : (3) Srivastava et al. [15] suggested the following power-chain-ratio type estimator:
^
MSR = ^My
^ M0
x
^ Mx
!1
Mz
^ M0
z
!2
; (4)
where 1 and 2are constants. The minimum MSE of
^
MSR, to rst order of the approximation, at optimum
values of 1 and 2, i.e.:
1(opt)= yxMMxfx(Mx) yfy(My);
and:
2(opt)= yzMMzfz(Mz) yfy(My);
is given by: MSEM^SR
min=
1 4ffy(My)g2
" 1 n 1 N 1 n 1 n0 2 yx 1 n0 1 N 2 yz # ; (5) which is equal to the variance of the dierence estima-tor:
^
MD= ^My+ d1
^ M0
x M^x
+ d2
Mz M^z0
; where d1 and d2are constants.
Gupta et al. [9] suggested the following estimator by utilizing the range of the second auxiliary variable (z), i.e. Rz as:
^
MG = ^My
^ M0
x
^ Mx
!1
Mz+ Rz
^ M0
z+ Rz
!2
Mz+ Rz
^ M0
z+ Rz
!3
; (6) where i(i = 1; 2; 3) are constants. The minimum MSE
of ^MG, to rst order of the approximation, at optimum
values of i (i = 1; 2; 3), i.e.:
1(opt)= MMxfx(Mx) yfy(My)
yzxz yx
2 xz 1
;
2(opt)= MMzfz(Mz) yfy(My)
yzxz yx
2 xz 1
g 1;
and:
3(opt)= MMzfz(Mz) yfy(My)
yxxz yz
2 xz 1
g 1;
for:
g = Mz Mz+ Rz;
is given by:
MSE( ^MG)min= 4ff 1 y(My)g2
1 n 1 N 1 n0 1 N 2 yz 1 n 1 n0 R2 y:xz ; (7) where: R2 y:xz = 2
yx+ 2yz 2yxyzxz
1 2
xz :
The expression in Relation (7) is equal to minimum MSE of Singh et al. [8] estimator, given by:
^
MS = ^My
^ M0
x
^ Mx
!1
Mz
^ M0
z
!2
Mz
^ M0
z
!3
;
where i (i = 1; 2; 3) are constants.
3. Proposed estimator
Jhajj and Walia [16] suggested the following estimator for population mean under two-phase sampling when using the single auxiliary variable:
yJW = [y + (y0 y)]
x0
x0+ (x0 x)
; where and are constants.
Diana [17] introduced a family of estimators for the population mean in stratied sampling given by:
yD= yst xXst
d + (1 d) xst X
"
;
where , ", and d are constants. By using these four parameters one can generate many estimators.
On the lines of Jhajj and Walia [16] and Di-ana [17], we propose a generalized dierence-cum-ratio type estimator for population median under two phase sampling scheme. The proposed estimator is given by:
^ MP =
h ^ My+
^ M0
y M^y
i "
+ (1 )M^^x M0 x
"
+ (1 )M^^z M0 z
#w2"
+ (1 )M^z0
Mz
#w3 ; (8)
where and wi (i = 1; 2; 3) are constants.
The proposed estimator in Eq. (8) is dierent from the Gupta et al. [9] estimator given in Eq. (6), in the sense that in the former given in Eq. (8), we measured
^ M0
y, ^Mx0 and ^Mz0 at rst phase, whereas in the latter,
in Eq. (6), we measured ^M0
xand ^Mz0 at the rst phase
but at the second phase we measured ^My, ^Mxand ^Mz.
This idea is discussed in detail by Jhajj and Walia [16] in estimating the nite population variance.
Solving Eq. (8) in terms of e0s to the rst order
of approximation, we have: ^
MP =My[1 + e0+ (e00 e0)]
"
1 + w1(1 )f(e1 e01) + e021 e1e01g
+w1(w1+ 1)
2 (1 )2(e1 e01)2 #
"
1 + w2(1 )f(e2 e02) + e022 e2e02g
+w2(w22+ 1)(1 )2(e 2 e02)2
#
1+w3(1 )e02+w3(w23+ 1)(1 )2e022
: Hence, up to the rst order of approximation:
MSE( ^MP) = My2E[e0+ (e00 e0)
+ w1(1 )(e1 e01) + w2(1 )(e2 e02)
+ w3(1 )e02]2:
Squaring and taking expectations, the MSE of ^MP, to
the rst degree of approximation, is given by:
MSE( ^MP) = 4ff 1 y(My)g2
"1 n
1 N
+ ( 2 2 )1
n 1 n0
+
1 n0
1 N
(
(1 )2w2 3
Myfy(My)
Mzfz(Mz)
2
+ 2(1 )w3
Myfy(My)
Mzfz(Mz)
yz
)
+ (1 2)1
n 1 n0
( w2
1
Myfy(My)
Mxfx(Mx)
2
+ w2 2
Myfy(My)
Mzfz(Mz)
2)
+2(1 )21
n 1 n0
( w1
Myfy(My)
Mxfx(Mx)
yx
+ w2
Myfy(My)
Mzfz(Mz)
yz
)
+ 2w1w2(1 )2
1 n
1 n0
fMyfy(My)g2
fMxfx(Mx)gf(Mzfz(Mz)g
xz
)# :
(9)
Setting @MSE( ^MP)
@wi = 0, (i = 1; 2; 3), we have:
w1(opt)=MxMfx(Mx)(yzxz yx) yfy(My)(1 2xz) ;
w2(opt)=MzMfz(Mz)(yxxz yz) yfy(My)(1 2xz) ;
and:
w3(opt)= MMzfz(Mz)yz yfy(My)(1 ):
Substituting the optimum values of wi (i = 1; 2; 3) in
Relation (9), we get the minimum MSE of ^MP, given
by:
MSE( ^MP)min=4ff 1 y(My)g2
" 1 n0
1 N
(1 2
yz)
+ (1 )2
1 n
1 n0
(1 R2 y:xz)
#
: (10)
Note that Jhajj and Walia [16] have shown that MSE is minimum for = 1. So, further minimizing Relation (10) with respect to (i.e. taking = 1), we have:
MSE( ^MP) =1min =4ff 1 y(My)g2
1 n0
1 N
(1 2
yz)
: (11) In Tables 2 and 3, MSE values and Percent Relative Eciency (PRE) are given for dierent values of , i.e. 0, 0.5, 1, 1.5, 2. For = 1, the proposed estimator ^MP
Table 2. MSE values of dierent estimators with respect to ^My for dierent values of .
Estimator Population 1 Population 2 Population 3 ^
My 565443.57 2.22 113343.27
^
MR 840264.22 1.01 180840.61
^
MSR 525744.59 0.87 110225.37
^
MG 506293.76 0.57 109805.56
^ MP
= 0 506293.76 0.57 109805.56
= 0:5 360471.28 0.38 75308.90
= 1 311863.78 0.31 63810.01
= 1:5 360471.28 0.38 75308.90
= 2 506293.76 0.57 109805.56
Table 3. PRE of dierent estimators with respect to ^My for dierent values of .
Estimator Population 1 Population 2 Population 3 ^
My 100.000 100.000 100.000
^
MR 67.294 220.004 62.676
^
MSR 107.551 254.494 102.829
^
MG 111.683 390.314 103.222
^ MP
= 0 111.683 390.314 103.222
= 0:5 156.862 587.840 150.504
= 1 181.311 707.124 177.626
= 1:5 156.862 587.840 150.504
= 2 111.683 390.314 103.222
4. Eciency comparison
In this section, we compare the proposed estimator ^MP
with other existing estimators. Condition (i)
By Relations (1) and (10), MSE( ^MP)min < Var( ^My)
if:
1 n0
1 N
2
yz+
1 n
1 n0
1 (1 )2(1 R2
y:xz) > 0:
Condition (ii)
By Relations (3) and (10), MSE( ^MP)min< MSE( ^MR)
if:
1 n
1 n0
"
Myfy(My)
Mxfx(Mx) yx
2
(1 )2(1 R2 y:xz)
#
+
1 n0
1 N
"
Myfy(My)
Mzfz(Mz) yz
2
(1 2 yz)
# > 0: Condition (iii)
By Relations (5) and (10): MSE( ^MP)min< MSE( ^MSR)min
if: 1 n
1
n0 (1 2yx) (1 )2(1 R2y:xz)
> 0: Condition (iv)
By Relations (7) and (10): MSE( ^MP)min< MSE( ^MG)min
if:1 n
1 n0
(1 R2
y:xz) (2 ) > 0:
Conditions in Comparisons (i)-(iv) will always be true for = 1, and our proposed estimator will perform better than the estimators Mi (i = y; R; SR; G), as
5. Empirical study
In this section, we consider three populations to per-form numerical comparisons of dierent estimators.
Population 1: Source: Singh [18]
Let Y; X; Z, respectively, be the number of sh caught by the marine recreational shermen in year 1995, 1994 and 1993. The descriptive statistics are given below:
N = 69; n0= 24; n = 17;
My= 2068; Mx= 2011; Mz= 2307;
fy(My) = 0:00014; fx(Mx) = 0:00014;
fz(Mz) = 0:00013; yx= 0:1505;
yz = 0:3166; xz = 0:1431:
Population 2: Source: Aczel and Sounderpandian[19] Let Y be the US exports to Singapore in billions of Singapore dollars, X be the money supply gures in billions of Singapore dollars and Z be the local prices in US dollars.
The descriptive statistics are given below: N = 67; n0= 23; n = 15;
My= 4:8; Mx= 7; Mz= 151;
fy(My) = 0:0763; fx(Mx) = 0:0526;
fz(Mz) = 0:00024; yx= 0:6624;
yz = 0:8624; xz = 0:7592:
Population 3: Source: MFA [20]
Let Y; X; Z, respectively, represent the district-wise tomato production (tonnes) in Pakistan in year 2003, 2002 and 2001.
The descriptive statistics obtained from the pop-ulation are given below:
N = 97; n0= 46; n = 33;
My= 1242; Mx= 1233; Mz= 1207;
fy(My) = 0:00021; fx(Mx) = 0:00022;
fz(Mz) = 0:00023; yx= 0:2096;
yz = 0:1233; xz = 0:1496:
We use the following expression to obtain the Percent Relative Eciency (PRE) as:
PRE = Var
^ My
MSEM^i
or MSEM^i
min
100;
i = y; R; SR; G; P:
The MSE values and percent relative eciencies are given in Tables 2 and 3, respectively.
The estimators Mi(i = y; R; SR; G) are
indepen-dent of . Based on the results in Tables 2 and 3, it is observed that the proposed estimator ^MP outperforms
other competing estimators for dierent values of . The ratio estimator ^MR shows poor performances in
Populations 1 and 3 because of weaker correlation between the study variable and auxiliary variables.
Although Jhajj and Walia [16] have presented results for various values of , their numerical results clearly show that optimal value of is 1, a fact observed in this study as well.
6. Conclusion
We propose an improved estimator for population me-dian on the lines of Jhajj and Walia [16] and Diana [17]. Both theoretical and numerical comparisons with other estimators show that the proposed estimator ( ^MP)
is more ecient than sample median estimator ( ^My),
ratio estimator ( ^MR), Srivastava et al. estimator [15]
( ^MSR) and Gupta et al. estimator [9] ( ^MG) for 0 < <
2. For = 0; 2, estimators ^MP and ^MG are equally
ecient. Among dierent values of , maximum gain in precision occurs at = 1.
Acknowledgments
Authors are thankful to the referees for their valuable remarks which helped the research paper improve.
References
1. Kadilar, C. and Cingi, H. \Ratio estimators in strat-ied sampling", Biometrical Journal, 45, pp. 218-225 (2003).
2. Kadilar, C. and Cingi, H. \Anew estimator in strati-ed random sampling", Communications in Statistics-Theory and Methods, 34, pp. 5967-602 (2005). 3. Shabbir, J. and Gupta, S. \A new estimator of
popula-tion mean in stratied sampling", Communicapopula-tions in Statistics-Theory and Methods, 35(7), pp. 1201-1209 (2006).
4. Koyuncu, N. and Kadilar, C. \Ecient estimators for the population mean", Hacettepe Journal of Mathe-matics and Statistics, 38(2), pp. 217-225 (2009).
5. Koyuncu, N. and Kadilar, C. \On the family of estimators of population mean in stratied sampling", Pakistan Journal of Statistics, 26(2), pp. 427-443 (2010).
6. Diana, G., Giordan, M. and Perri, P.F. \An improved class of estimators for the population mean", Statistical Methods and Applications, 20(2), pp. 123-140 (2011). 7. Kuk, A.Y.C and Mak, T.K. \Median estimation in the
presence of auxiliary information", Journal of Royal Statistical Society, B, 51, pp. 261-269 (1989).
8. Singh, S., Singh H.P. and Upadhyaya, L.N. \Chain ratio and regression type estimators for median esti-mation in survey sampling", Statistical Papers, 48, pp. 23-46 (2006).
9. Gupta, S., Shabbir, J. and Ahmad, S. \Estimation of median in two phase sampling using two auxiliary variable", Communications in Statistics-Theory and Methods, 37(11), pp. 1815-1822 (2008).
10. Al, S. and Cingi, H. \New estimators for the popula-tion median in simple random sampling", Proceedings of the Tenth Islamic Countries Conference on Statisti-cal Sciences (ICCS-X), pp. 375-383 (2010).
11. Singh, H.P. and Solanki, R.S. \Some classes of esti-mators for the population median using auxiliary in-formation", Communications in Statistics-Theory and Methods, 42, pp. 4222-4238 (2013).
12. Khoshnevisan, M., Sexena, S., Singh, H.P., Singh, S. and Smaradache, F. \A general class of estimators of population median using two auxiliary variables in double sampling", pp. 26-43 in Randomness and Optimal Estimation in Data Sampling, 2nd Ed., pp. 1-63 (2002).
13. Gross, S.T. \Median estimation in sample surveys", Proceedings of the Survey Research Methods Section of the American Statistical Association, pp. 181-184 (1980).
14. Chand, L. \Some ratio-estimators based on two or more auxiliary variables", PhD Dissertation, Iowa State university, Ames, Iowa (1975).
15. Srivastava, S.K., Rani, S., Khare, B.B. and Srivastava, S.R. \A generalized chain ratio estimator for mean of nite population", Journal of Indian Society of Agricultural Statistics, 42(1), pp. 108-117 (1990).
16. Jhajj, H.S. and Walia, G.S. \A generalized dierence-cum-ratio type estimator for the population variance in double sampling", Communications in Statistics-Simulation and Computation, 41, pp. 58-64 (2012). 17. Diana, G. \A class of estimators of the population
mean in stratied random sampling", Statistica, 53(1), pp. 59-66 (1993).
18. Singh, S., Advances Sampling Theory and Applica-tions: How Michael `Selected' Amy, I and II, Kluwer Academic Publishers, The Netherlands (2003). 19. Aczel, A.D. and Sounderpandian, J., Complete
Busi-ness Statistics, 5th Ed., New York, McGraw Hill (2004).
20. MFA, Crops Area Production, Ministry of Food, Agri-culture and Livestock, Economic Wing, Islamabad, Pakistan (2004).
Biographies
Javid Shabbir obtained his PhD degree in Statistics from the University of Kent, UK. He has published more than 70 research papers in international research journals. His research interests include: Survey sam-pling and randomized response models.
Sat Gupta is a professor of statistics at University of North Carolina-Greensboro, USA. He has earned PhD degrees in Mathematics (University of Delhi) and Statistics (Colorado State University). He has over 90 refereed publications and 4 edited book volumes, and has guided research students at all levels of the curriculum including undergraduate and PhD students. He has received external funding from United States agencies like the National Science Foundation (NSF), the National Institute of Health (NIH), and the Math-ematical Association of America (MAA).
Zawar Hussain graduated from Quaid-i-Azam Uni-versity, Islamabad, Pakistan. He has published around 30 research papers in reputed journals. His research interest include: Sampling techniques, randomized response models, and quality control.