THE NEW EL DORADO:
BLACK LOCATIONAL ATTAINMENT IN THE POST-CIVIL RIGHTS ERA
Donovan Augustus Anderson
A dissertation submitted to the faculty at the University of North Carolina at Chapel Hill in partial fulfillment of the requirements for the degree of Doctor of Philosophy in the Department of City and Regional Planning (Housing and Community Development).
Chapel Hill 2015
© 2015
ABSTRACT
Donovan Augustus Anderson: The New El Dorado: Black Locational Attainment in the Post-Civil Rights Era
(Under the direction of Mai T. Nguyen)
This dissertation examines Black locational attainment in the post-Civil Rights era in three separate but related papers.
Paper 1: Black Migration to the South: Metropolitan Determinants of Black Primary and Return Migration, 1970-2010
This article addresses gaps in the Black migration literature using the IPUMS and Decennial Census to examine the effects of macro-level factors on Black primary and return migrations from the North to the South between 1970 and 2010. Specifically, the analysis seeks to explain the impact of metropolitan-level determinants on Black non-South to South
findings that the migration to the South for Blacks, unlike Whites, cannot be characterized as a retirement-centered migration. In fact, for Blacks, this migration to the South may reflect a draw to living with successful in-group members, as there is some evidence that Blacks are significantly more likely to move to Southern metropolitan areas with a strong Black middle class presence, in contrast to their White counterparts.
Paper 2: The New El Dorado: Locational Attainment of Black Primary and Return Migrants to the South, 1970-2010
that posits that Black middle-class neighborhoods, when available, are attractive to the Black middle class.
Paper 3: Black Locational Attainment into Black Middle-Class Neighborhoods in the Post-Civil Rights Era, 1970-2010
Using confidential Decennial Census 1970-2000 and American Community Survey 2006-2010 data, this research tests the spatial assimilation, place-stratification, and minority culture of mobility models to determine which model better explains the locational attainment of Blacks into Black middle-class neighborhoods. The study also compares the results of locational attainment for Blacks, as compared to Whites, living in metropolitan areas in the U.S. The present study makes three key findings. First, for Whites, there are distinct differences between locational attainment into White neighborhoods compared to White middle-class
neighborhoods. White middle-class neighborhood as a more desirable neighborhood condition implies the necessary use of neighborhood indicators that intersect both race and class
characteristics. Second, although individual socioeconomic status matters in locational
attainment for both Black and White movers, metropolitan conditions better explain divergent locational attainment between the groups. Third, an increasing metropolitan Black middle-class is a strong determinant of Black access into Black middle-class neighborhoods. This study finds that neither the spatial assimilation model nor the place-stratification perspective can explain locational attainment of Black movers into Black middle-class neighborhoods. In lieu of these theoretical frameworks, the minority culture of mobility model provides the best fitting
To God, first and foremost To my family,
To everyone and to everything I lost in this process But to sacrifices, you’re owed nothing
ACKNOWLEDGEMENTS
I would like to thank my committee chair and academic advisor, Mai T. Nguyen for her mentorship and support throughout my dissertation. I would also like to thank Professor William M. Rohe for his initial support in developing my dissertation research proposal. I would also like to thank Professors Kyle Crowder and Ted Mouw for being extremely helpful and available whenever I needed. And I would like to thank Professor T. William Lester for his willingness to take time out to support my project.
TABLE OF CONTENTS
LIST OF TABLES ... XII LIST OF FIGURES ... XIII
I. INTRODUCTION TO THE RESEARCH ... 1
INTRODUCTION ... 1
OVERVIEW OF THE THREE DISSERTATION RESEARCH PAPERS ... 3
First Paper ... 3
Second Paper ... 4
Third Paper ... 5
BACKGROUND ... 5
The Present-Day South ... 5
Locational Attainment ... 6
The Black Middle-Class ... 7
THEORETICAL FRAMEWORKS ... 8
Spatial Assimilation Model ... 8
Place-Stratification Perspective ... 9
Minority Culture of Mobility Model ... 9
Migration and Mobility Theory ... 9
DATA AND METHODS ... 10
II. DISSERTATION PAPER 1 - Black Migration to the South: Metropolitan Determinants of Black Primary and Return Migration, 1970-2010 ... 13
ABSTRACT ... 13
BACKGROUND ON BLACK SOUTHERN MIGRATION ... 15
EXPLAINING MIGRATION TO THE SOUTH ... 21
Metropolitan Economic Context ... 22
Race, Ethnicity, and Space ... 22
Middle-Class Presence ... 25
Metropolitan Control Variables ... 25
DATA AND METHODS ... 26
MODELING METROPOLITAN EXPLANATIONS FOR SOUTHERN BLACK MOBILITY ... 37
Subregional and Metropolitan Characteristics ... 38
Metropolitan Economic Context ... 41
Race, Ethnicity, and Space ... 41
Middle-Class Presence ... 42
CONCLUSION ... 43
REFERENCES ... 47
III. DISSERTATION PAPER 2 - The New El Dorado: Locational Attainment Of Black Primary And Return Migrants To The South, 1970-2010 ... 51
ABSTRACT ... 51
INTRODUCTION ... 52
BACKGROUND ... 55
Locational Attainment ... 55
The History of the Southern Residential Landscape ... 57
Why A Regional Focus For Locational Attainment ... 62
THEORY OF MIGRATION AND MOBILITY ... 64
Spatial Assimilation and Place Stratification Perspective ... 64
Minority Culture of Mobility ... 66
DATA AND METHODS ... 67
RESULTS ... 71
Locational Attainment in the South By Migrant Status ... 71
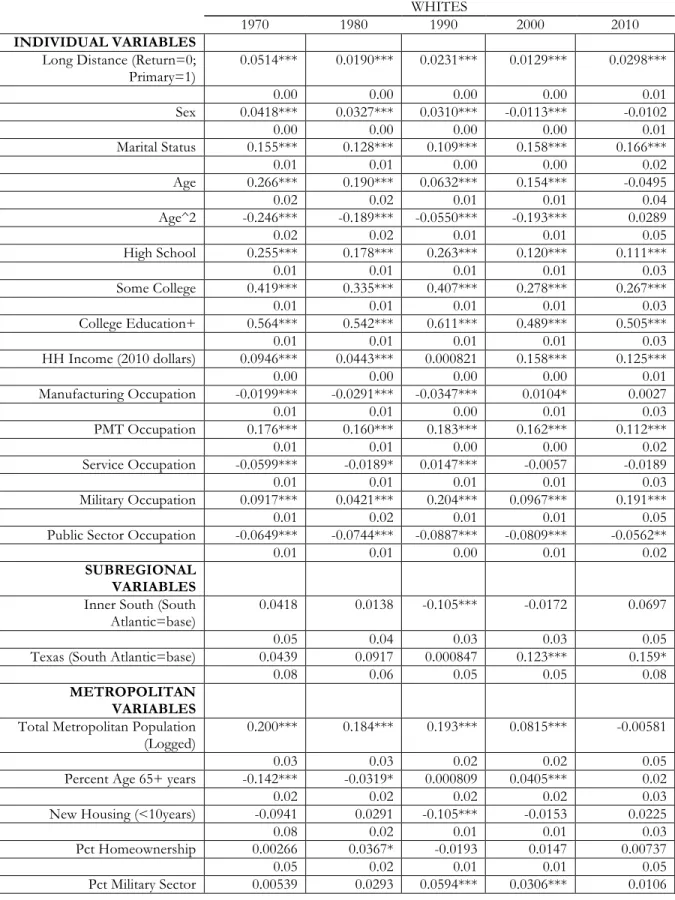
Regression Analysis-Comparing White and Black Non-South Migrants into Middle-Class Neighborhoods ... 74
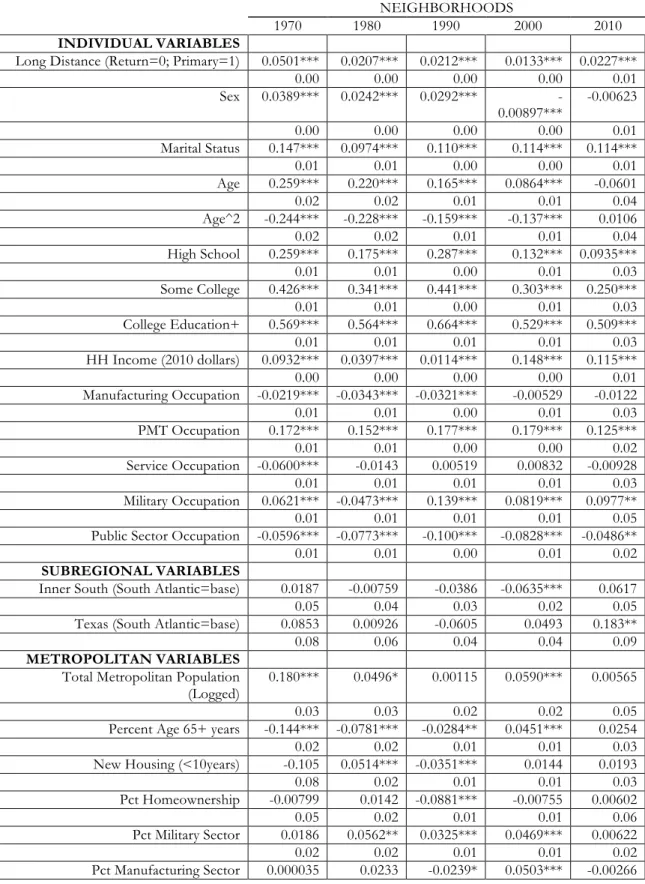
Regression Analysis-Comparing White and Black Non-South Migrants into Same-Race Middle-Class Neighborhoods ... 80
DISCUSSION AND CONCLUSION ... 87
DISCLAIMER ... 91
REFERENCES ... 92
IV. DISSERTATION PAPER 3 - Black Locational Attainment Into Black Middle-Class Neighborhoods In The Post-Civil Rights Era, 1970-2010 ... 97
ABSTRACT ... 97
INTRODUCTION ... 97
BACKGROUND ... 100
THEORETICAL FRAMEWORK ... 102
DATA AND METHODS ... 106
Dependent Variable: Operationalizing Middle-Class ... 107
RESULTS ... 114
Locational Attainment of Black and White Movers in the U.S. ... 114
Regression Analysis-Comparing Black and White Movers into White Neighborhoods .... 117
Regression Analysis-Comparing Black and White Movers into Same-Race Middle-Class Neighborhoods ... 123
DISCUSSION ... 130
FUTURE RESEARCH ... 135
REFERENCES ... 137
V. CONCLUSION ... 142
SOUTHERN SUBREGIONAL DIFFERENCES ... 142 SOUTHERN LOCATIONAL ATTAINMENT FOR PRIMARY AND RETURN
MIGRANTS ... 143 CONFIRMING AND CHALLENGING TRENDS IN LOCATIONAL
ATTAINMENT ... 145 LOCATIONAL ATTAINMENT INTO BLACK MIDDLE-CLASS
LIST OF TABLES
Black Migration To The South: Metropolitan Determinants Of Black Primary And Return Migration, 1970-2010
TABLE 1 – Means And Standard Deviations for Southern Metropolitan Areas, 1970-2000 ... 33 TABLE 2 – Means And Standard Deviations for Primary and Return Migrants to Southern Metropolitan Areas by Subregion, 1980-2010 ... 36 TABLE 3 – Macro-Level Effects on Migration by Race, 1980-2010 ... 39 The New El Dorado: Locational Attainment Of Black Primary And Return Migrants To The South, 1970-2010
TABLE 1 – Top 10 Southern Metropolitan Areas For Black College Educated And Black High Income Populations, 1970-2010 ... 61 TABLE 2 – Locational Attainment To The South By Race And Migrant Status, 1970-2010 ... 73 TABLE 3 – Random Effect Regression HLM Model Predicting Locational Attainment Non-South To South Movers Into Middle Class Neighborhoods By Race, 1970-2010 ... 76 TABLE 4 – Random Effect Regression HLM Model Predicting Locational Attainment Non-South To South Movers Into Same Race Middle Class Neighborhoods By Race, 1970-2010 ... 82 Black Locational Attainment Into Black Middle-Class Neighborhoods In The Post-Civil Rights Era, 1970-2010
TABLE 1 – Distribution Of Middle Class Attributes By Race, 1970-2010 ... 110 TABLE 2 – Locational Attainment In The U.S. Of Black And White Movers, 1970-2010 ... 115 TABLE 3 – Random Effect Regression HLM Model Predicting Locational
Attainment Of Black And White Movers Into White Neighborhoods, 1970-2010 ... 119 TABLE 4 – Random Effect Regression HLM Model Predicting Locational
Attainment Of Black And White Movers Into Same-Race Neighborhoods, 1970-2010 .... 124 APPENDIX TABLE 1 – Random Effect Regression Hlm Model Predicting Locational
Attainment Non-South To South Movers Into White Neighborhoods By Race, 1970-2010 (Standardized) ... 151 APPENDIX TABLE 2 – Random Effect Regression Hlm Model Predicting Locational
LIST OF FIGURES
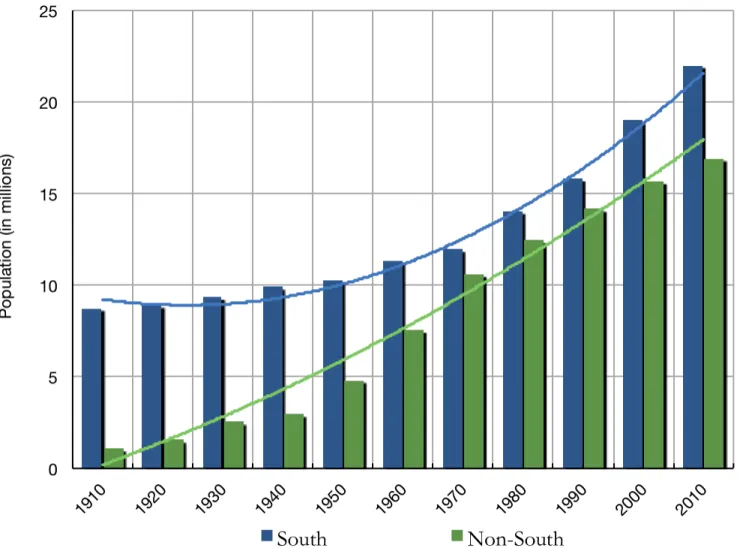
FIGURE 1 – 100-Year Change In The Black Population By Region, 1910-2010 ... 18
FIGURE 2 – Black Migration Between Regions, 1940-2010 ... 20
INTRODUCTION TO THE RESEARCH
For Southern Blacks, the North was once considered the Promised Land. They fled their homes in the South after World Wars I and II to seek new opportunities and to escape racial oppression (Tolnay 2003). Now, in the post-Civil Rights era, the South has emerged as an El Dorado for an increasing number of Blacks who are choosing to migrate from the non-South to South and remain in the South. The El Dorado represents the new transformed Southern region, emblematic of burgeoning industries, metropolitan urbanization, and broadening racial and ethnic diversity (Frey 2004, 2006). Despite this visible and well-documented transformation (Frey 2004, 2006; MDC 2010), the South has been neglected as a region of importance for understanding Black quality of life during this period. Much of the neglect can be attributed to challenges that Blacks confronted in the non-South, including the ramifications of
deindustrialization (Harrison and Bluestone 1982), the negative effects of White flight—central city to suburb movement (Krysan 2002), and the dire consequences of racial residential
segregation (Massey and Denton 1993). The public outcry over a Northern Promised Land that had failed its Black citizens just as the South did for the preceding generation has drawn
attention away from Black quality of life in a transformed Southern region.
This study measures one aspect of realized opportunity for Blacks, locational attainment. More specifically, this study examines the ability of Black movers to translate their
socioeconomic resources into access to quality neighborhoods. Scholars have generally relied on the theoretical frameworks of spatial assimilation and place stratification to understand
suggests that as Blacks’ socioeconomic status increases, so does their ability to attain access to whiter, wealthier, and suburban neighborhoods of advantage (Alba and Logan 1991; 1993; Logan and Alba 1993). In contrast, the place stratification perspective warns that Blacks with higher socioeconomic status are less likely to attain access into better quality neighborhoods as a result of discrimination in the housing market (Zubrinsky 2003). However, both of these frameworks fall short in explaining locational attainment into quality neighborhoods as measured by alternative measures of quality rather than traditional measures. The spatial assimilation and place stratification models tend to present that the only pathway to success is whiter neighborhoods. Little is known about what explains Black access into Black middle-class neighborhoods, in light of the growing Black middle-class in the U.S., and how similar or different that process is to Black access into whiter, wealthier, and suburban neighborhoods. The minority culture of mobility model, a recently constructed theoretical framework, provides the best conceptualization of Black middle-class neighborhoods as places of neighborhood advantage. This model argues that Blacks will translate socioeconomic resources into access to Black middle-class neighborhoods in order to circumvent the effects of individual and
institutional racism (Neckerman et al 1999).
middle-class neighborhoods? Previous locational attainment studies, due to data limitations, have had to rely on pre-constructed Census measures to best proxy for quality neighborhoods (i.e. percentage White population). The percentage White population as a measure of
neighborhood quality, although it captures the ability of minority groups to integrate into
mainstream neighborhoods, it is unable to report the quality of those White residents as it relates to class. This study’s use of confidential Census data has allowed for the construction of
neighborhood measures that intersect race and class. And it is these race and class measures that drive the analysis of the second and third research papers of the dissertation.
The combined set of three dissertation research papers seek to explain the attraction of the El Dorado for Black non-South to South migrants, and what individual characteristics and metropolitan conditions explain locational attainment of these migrants in the region.
Furthermore, they seek to understand what explains Black locational attainment into Black middle-class neighborhoods in the U.S., and how that compares to Black locational attainment into White neighborhoods. The following section provides an overview of the three dissertation research papers. The background section that follows comprises a short discussion of The Present-Day South, Locational Attainment, and The Black Middle Class. Next is an overview of the theoretical frameworks used in this study including the Spatial Assimilation Model, the
Place-Stratification Perspective, the Minority Culture of Mobility Model, and Migration and Mobility Theory. The final section of this introduction is the Data and Methods used for this research.
OVERVIEW OF THE THREE DISSERTATION RESEARCH PAPERS
First Paper: “Black Migration to the South: Metropolitan Determinants of Black Primary
and Return Migration, 1970-2010”
Decennial Census to examine the effects of macro-level factors on Black primary and return migrations from the North to the South between 1970 and 2010. Specifically, the analysis seeks to explain the impact of metropolitan-level determinants on Black non-South to South
migration. The regression models test three sets of variables that measure the metropolitan’s economic context; race, ethnicity, and space; and middle class presence. This study asks, which metropolitan level characteristics best explain Black migration to the South? And, are there differences between Black primary and return migrants in the metropolitan characteristics that shape their migration? This paper lays the groundwork for the second paper.
Second Paper: "The New El Dorado: Locational Attainment of Black Primary and
Return Migrants to the South, 1970-2010"
The South is the new El Dorado for Blacks in the post-Civil Rights era. Fifty-five percent of the total U.S. Black population resides in the South, Black-White residential segregation has continued to decline and the region has become more urbanized, thereby making the South a prime region of interest for Black locational attainment. Relying on
confidential Decennial Census 1970-2000 and the American Community Survey 2006-2010 data, this study tests the spatial assimilation and place-stratification models in explaining locational attainment of Black non-South migrants—primary and return migrants—who are moving from the non-South into the South. Locational attainment is defined as the ability of individuals to translate socioeconomic resources into access to quality neighborhoods. This paper
Black migrants’ access into quality neighborhoods in the post-Civil Rights era? The third and final paper builds on the second paper by honing in on Black locational attainment into Black middle-class neighborhoods in the U.S. between 1970 and 2010.
Third Paper: “Black Locational Attainment into Black Middle-Class Neighborhoods in
the Post-Civil Rights Era, 1970-2010”
Using confidential Decennial Census 1970-2000 and American Community Survey 2006-2010 data, this research tests the spatial assimilation, place-stratification, and minority culture of mobility models to determine which model better explains the locational attainment of Blacks into Black middle-class neighborhoods. This study asks, what individual socioeconomic and metropolitan factors explain Black locational attainment into Black middle-class neighborhoods in the post-Civil Rights era? Do the same factors that explain locational attainment into Black middle-class neighborhoods also explain locational attainment into White neighborhoods? This paper tests the minority culture of mobility model through a comparative examination of Black locational attainment into White neighborhoods and Black middle-class neighborhoods. It investigates the conditions in which Blacks seek access to Black middle-class neighborhoods.
Together, these three papers highlight the positive effect that the Black middle-class has had on Black locational attainment in the post-Civil Rights era.
BACKGROUND
This section provides a short description of the present-day South, locational attainment and the Black middle-class that are discussed in more detail across the three papers.
According to the U.S. Census Bureau (2011), as of 2010, there were approximately 42 million Black people living in the United States who comprise approximately 14% of the total U.S. population. The Black population grew at a rate of 15% between 2000 and 2010, which was faster than the national rate of growth at 10%. The total Black population in the South increased from 53.6% in 2000 to 55% in 2010. And, one in five persons living in the South in 2010 were African American. The Southern Black population proportion of 20% is compared to the following Black population proportions by region: 13% in the Northeast, 11% in the Midwest and 6% in the West. In 2010, the States with the highest proportion of Blacks in the U.S. are located in the South including Washington, DC (52%), Mississippi (38%), Louisiana (33%), Georgia (32%), Maryland (31%), South Carolina (29%), and Alabama (27%). The MDC reported that between 1987 and 2007 approximately 89 percent of job growth in the South occurred in its metropolitan areas (2011). And as of 2010, 75% of Southerners resided in metropolitan areas with the majority of its residents comprising young Blacks, Hispanics, and immigrant newcomers, while Whites represent 75% of the aging Southern population (MDC 2011). These facts illustrate that the South is not only transforming rapidly as a region, but has become a unique place of inquiry for understanding Black quality of life in the U.S.
LOCATIONAL ATTAINMENT
The locational attainment approach remains important in understanding how individual members of society have been able to convert their individual socioeconomic resources into access to better neighborhoods. Generally, Blacks face difficulties converting their individual socioeconomic resources into residential attainment in whiter, wealthier, and suburban
population, the availability of Black middle-class neighbors, its more accessible quality of life, and the overlap of poor rural areas and new suburban neighborhoods, traditional locational attainment indicators are not appropriate for Southern regional analysis. The present study relies on a conservative measure of the middle-class using a combination of factors including
education, income and occupation. In this case, locational attainment is defined as a Black middle-class neighborhood in order to evidence if more affluent Blacks convert their individual resources into access to these alternative quality neighborhoods.
THE BLACK MIDDLE-CLASS
There have been a variety of definitions used to investigate the middle-class that have typically focused on at least one of the following: occupation, income, and education. As it relates to occupation, Landry distinguishes professionals, managers, and small business owners as the upper middle-class (1987). Lacy (2007) also makes a similar distinction between the Black upper or stable middle-class and the lower middle-class. However, she also includes in her definition college education, household income of a $100k, and homeownership. Oliver and Shapiro (1995) define the middle-class using white-collar jobs along with college education and income between $25k and $50k. Wilson (1978) uses a broader definition of middle-class capturing both white- and blue-collar workers. Generally, middle-class Blacks have been found to live in neighborhoods with a larger percentage of Whites; however, the White residents that middle-class Blacks live among have been found to be less affluent than those residing in
middle-class White neighborhoods (Adelman 2004, 2005; Alba et al 2000; Friedman et al 2014).
between 1970 and 2010. Generally, most locational attainment measures have been unable to simultaneously capture both race and class characteristics due to the lack of available data at the individual-level. In this dissertation, I construct variables that capture the percentage of the middle-class and the same-race middle-class neighborhood population. The latter is specific in the test of the minority culture of mobility model. This middle-class measure moves beyond previously used locational attainment indicators, and its innovation is the result of access to individual-level Census micro-data at the tract-level. To my knowledge, the Black middle-class neighborhood has yet to be examined as a measure of neighborhood advantage for Blacks.
THEORETICAL FRAMEWORKS
The following section provides a broad overview of the theories that are described across the three dissertation papers including the spatial assimilation model, the place
stratification perspective, the minority culture of mobility model, and migration and mobility theory. All the theoretical frameworks help to explain locational attainment of all groups of interest—Black and White non-South to South migrants, and Black and White movers.
SPATIAL ASSIMILATION MODEL
The spatial assimilation model provides explanation for the relationship between individual resources and residential outcomes (Park 1925; Guest 1980; Alba and Logan 1991; Massey 1985). It contends that as an individual’s socioeconomic resources—education, income (Alba and Logan 1991, 1993; Woldoff 2008), wealth (Crowder et al 2006, Woldoff 2008), and cultural assimilation (Portes and Zhou 1993) increases, so will one's access to better
PLACE STRATIFICATION PERSPECTIVE
The place-stratification model considers inequity in the housing market (Yinger 1995; Massey and Denton 1993), and generally posits that Blacks of increasing socioeconomic status will not be able to access neighborhoods that are comparable to Whites (Alba and Logan 1991). The strong version of the place stratification model states that returns on human capital for Blacks do not translate into quality neighborhood outcomes comparable to Whites. The weak version of the model states that even when human capital does translate into higher quality neighborhood outcomes for Blacks, these neighborhoods are of lesser quality for Blacks than for their majority counterparts (Logan and Alba 1993). The place-stratification perspective
contends that racial characteristics determine locational attainment despite socioeconomic status.
MINORITY CULTURE OF MOBILITY MODEL
The minority culture of mobility (MCM) model suggests that in response to the effects of individual and institutional racism, minorities with socioeconomic resources will seek residence in Black middle-class neighborhoods (Neckerman et al 1999). Bayer and colleagues (2005) suggest that more wealthy Black enclaves will materialize as the size of an affluent Black population increases. Thus, one might also expect higher socioeconomic Blacks to select to move into majority Black middle-class neighborhoods when a Black middle-class population is present. The MCM model supports the use of the Black middle-class neighborhood as a neighborhood of advantage, not readily supported by either the spatial assimilation model or place-stratification model. It also contends that Blacks will translate socioeconomic resources into locational attainment into this specific neighborhood type.
Lee (1966) summarizes Ravenstein's law of migration stating that pull and push effects are the two types of effects that cause mobility. Mobility under a pull effect refers to the attraction of the place of destination, while mobility under a push effect refers to the challenges that occur at the place of origin. Blacks moving across longer distances should be better equipped to access quality neighborhoods if their long distance migration can be characterized by pull instead of push factors (Lee 1966). The former implies that migrants seeking
opportunities at their destination, regardless of their point of origin experience, place them at an advantage to succeed. In contrast, the latter suggests that migrants fleeing challenges at their point of origin may be at a disadvantage at their destination.
DATA AND METHODS
this study fall under the metropolitan economic context; race, ethnicity, and space; and middle-class presence in addition to a set of metropolitan control variables.
As for analytical strategy, the first paper pools all years of interest into one data set and uses random effects regression to explain the ability of Southern MAs to attract and retain residents between 1970 and 2010. The random effects model is specifically useful in providing generalized inferences for the study's migrant populations within and between Southern MAs. Thus, under this model, the study will be able to make inferences for each of the distinct migrant groups while controlling for differences between the MAs in which they are located.
The second and third papers draw on multiple sources of data, including confidential Decennial Census and American Community Survey microdata. The confidential Census micro-data is a rich source of information that provides individual-level micro-data at the census-tract level comprising between 4,000-8,000 residents. The resource is similar to the Integrated Public Use Microdata Sample (IPUMS) that provides individual-level information at the PUMA level whose boundaries include approximately 100,000 residents. The data was structured to link individual socioeconomic and sociodemographic indicators to respective neighborhoods and those neighborhoods within metropolitan areas. The census tract is used to proxy for the
variables of focus are the percentage middle-class neighborhood population and the same-race middle-class neighborhood population. In contrast, the third paper includes Black and White movers across all U.S. metropolitan areas. The dependent variables include the percentage White and same-race middle-class neighborhood populations.
BLACK MIGRATION TO THE SOUTH:
METROPOLITAN DETERMINANTS OF BLACK PRIMARY AND RETURN MIGRATION, 1970-2010
ABSTRACT
This article addresses gaps in the Black migration literature using the IPUMS and Decennial Census to examine the effects of macro-level factors on Black primary and return migrations from the North to the South between 1970 and 2010. Specifically, the analysis seeks to explain the impact of metropolitan-level determinants on Black non-South to South
INTRODUCTION
The North, which was considered the Promised Land, was where Southern Blacks migrated after World Wars I and II in order to seek new opportunities and escape racial oppression. Since the end of the Civil Rights Movement, however, that migration pattern has reversed, with Blacks heading South in increasing numbers (Tolnay 2003). Fleeing declining cities in the Northern Frostbelt, Blacks have been attracted to the South because of the region’s burgeoning industries, urbanization in metropolitan areas, and broadening racial and ethnic diversity (Frey 2004, 2006).
If the North was once referred to as the Promised Land for Black Americans, then the South is their new El Dorado. The El Dorado represents the new transformed South, once ruled by Jim Crow, that today reflects a region offering a wide variety of opportunities that are
attractive to Black migrants. In summarizing Ravenstein’s laws of migration, Lee (1966) states that the most significant migration is caused by individuals seeking to better their condition. Thus, explaining why Blacks are headed to the South and understanding whether or not they have been able to improve their condition under non-South to South migration are important lines of inquiry.
rather than return migrants (Adelman 2000; Hunt et al 2008).
This research considers macro-level factors in understanding Black primary and return migrations to the South by making use of the Integrated Public Use Microdata Sample (IPUMS) and Decennial Census data to link Black migration to metropolitan-level characteristics. The study seeks to answer two questions. First, which metropolitan-level characteristics best explain Black migration to the South? Second, are there differences between Black primary and return migrants in the metropolitan characteristics that shape their migration?
This paper contributes to the understanding of macro-level factors in explaining Black migration to the South in two ways. First, exploring the Black primary and return migrations add to the understanding of Black non-South to South migration and the metropolitan distinctions that help to explain that movement. Research on Black primary and return
migrations have focused on individual- and household-level characteristics to understand Black migration but the not the specific pull of Southern metropolitan areas (MA’s, hereafter) to which migrants are locating.
Second, this study incorporates metropolitan-level explanatory variables under three distinct themes including: (1) metropolitan economic context, (2) race, ethnicity, and space, and (3) middle class presence to test theoretical arguments that help explain why Blacks migrate to Southern MAs. Many of these factors have not yet been incorporated in the examination of Black non-South to South migration despite variations in the sizes of primary and return migrant populations observed across Southern metropolitan areas. By including two distinct types of Black non-South to South migrants and a wide range of metropolitan-level explanatory variables, this analysis can uncover the underlying dynamics driving Black migration to the South.
Black non-South to South migration has received greater attention over the last decade. Scholars have examined the motivations for Black migration (Hunt et al 2012), the institutional forces promoting Black migration (Pendergrass 2013) and the changes in occupational prestige among Black migrants (Flippen 2013). And the emergence of scholarly work on the
importance of metropolitan-level indicators to explain mobility has shaped the thesis of this article (Crowder and South 2005; Crowder et al 2012; Iceland et al 2012; Pais et al 2012). Recent research on the Black primary and return migrations find that Blacks are moving to Southern metropolitan areas in larger numbers than to non-metropolitan or rural areas (Frey 2006), and that Southern MAs across the South are not created equal. Scholars suggest that MAs along the southeastern seaboard (the South Atlantic) and in Texas are faring better than MAs in the Deep South (the Inner South) as it relates to urbanization, job growth, and net migration (Frey 2004, 2006; MDC 1998a, 1998b, 2002, 2010, 2011). Black migration reflects the ability of the South to attract residents through distinct metropolitan-level characteristics, but it is still unclear which specific metropolitan characteristics draw these movers to the region. Indeed, although increasing numbers of Blacks continue to head South, there is little information on the macro-level mobility processes shaping their movement.
Figure 1 illustrates the share of Black population over the previous one hundred years across the non-South and South. For every decennial year between 1910 and 2010, the Black population in the South has consistently remained larger than the Black population in the South. Between 1910 and 1970, the Black population exhibited enormous growth in the non-South due to the first and second Great Migrations. These Great Migrations characterized the movement of Blacks from the South into the North (Tolnay 2003). Yet, it is clear that the growth in the Southern Black population was reinvigorated after the 1970 period. The Black population growth in the South during this time period has been associated with both fewer Blacks leaving the Southern region and with the Black primary and return migrations.
Previous research has focused on the Black return migration—Blacks born in the South and now returning to the South from the non-South—as this first-wave of migrants made up the majority of non-South to South movement (Robinson 1986; Fuguitt et al 2001; Stack 1996). Black return migrants were largely retirees and moving in significant numbers to
18
!
Figure 2 confirms that the Black net migration from the non-South to the South
increased after 1970. In the 1970s, the Black net migration between the regions was negative
and hit its nadir. However, the influx of migrants to the South picked up in the following
decennial period and steadily grew, reversing the negative net migration, in each subsequent
period. Save the 2010 period, Figure 2 also shows that the number of Blacks leaving the South
declined and remained fairly constant between 1970 and 2000.1
Within the larger non-South to South migration, the majority of Black primary and
return migrants are moving to metropolitan locations (Falk et al 2004). The two MAs in the
U.S. with the largest total Black populations are Chicago and New York. These two MAs
experienced the majority of its Black population growth under the Great Migrations. Yet,
currently, Southern MAs hold larger shares of the Black population with 58 percent of the Black
population gain between 2000-2004 occurring in the largest Southern MAs with populations
greater than 500,000 (Frey 2006). Eight of the top ten MAs that have experienced Black
population gains are located in the South (see Frey 2006); and all eight of these MAs have been
located in States along the South Atlantic and in Texas. One notable example of tremendous
Black population growth has been in Atlanta, which has ascended from having the 7th largest
Black population in 1990 of all MAs in the U.S. to the 3rd largest in 2004 (Frey 2006).
According to Lee (1966), although the majority of migration is prompted by a desire for
upward mobility, all migration is driven by push and pull effects. Under a pull effect,
long-distance migration is generally linked to industry and commerce of metropolitan destinations,
while under a push effect, long-distance migration is strongly associated with economic hardship
!!!!!!!!!!!!!!!!!!!!!!!!!!!!!!!!!!!!!!!!!!!!!!!!!!!!!!!!
20
!
at the place of origin (Lee 1966). Thus, migration that occurs at longer distances result from
strong push or pull effects that occur before the relocation event.
Although primary and return migrants move similar distances between the non-South
and the South, they may move as a result of distinct circumstances. On the one hand, the return
migration movement for Blacks is a 'call to home,' which for this particular migrant type may
reflect both push and pull factors. Primary migrants, on the other hand, would be largely
impacted by a pull effect. Thus, one might predict that primary migrants are more likely to move
to Southern MAs with a strong economic or social context, while that relationship would not be
as strong for return migrants. Primary migrants would also be more likely to relocate to
Southern MAs with a strong in-group middle class population than their return migrant
counterparts.
EXPLAINING BLACK MIGRATION TO THE SOUTH
Since Frey's (2004) claim that the Black primary and return migrations could be
attributed to the changing conditions of the South, studies on Black southern migration have
done little to operationalize those conditions. Instead, the focus has been on the individual-level
and household-level determinants of the migrants (Hunt et al 2013), although more recent work
has suggested institutional forces—employers, educational institutions in Historically Black
Colleges and Universities, and ethnic media—are at the heart of the migration (Pendergrass
2013). Still, the role that macro-level factors play in attracting Black migrants is still not well
understood, especially in light of the role that metropolitan-level constraints play in influencing
the levels of racial residential segregation (Crowder and South 2005; Crowder et al 2012; Iceland
et al 2013). The focus of this paper is the effect of metropolitan characteristics on Black
(1) the metropolitan economic context, (2) the race, ethnicity and space, and (3) the middle-class
presence on the Black primary and return migrations. I also cover the metropolitan control
variables known to potentially constrain migration.
(A) METROPOLITAN ECONOMIC CONTEXT
The metropolitan economic context has been identified as critical in understanding
residential mobility (Crowder et al 2012). It includes variables such as: poverty, unemployment
and the MAs industrial specialization. Poverty and unemployment are economic conditions that
impact the MA’s ability to attract residents, albeit in different ways. Poverty as an enduring
condition should have strong negative effects on attracting Black migrants. The condition of
poverty is also correlated with long-term unemployment, high crime, and poor quality schools
(Wilson 1987; Massey and Denton 1993). As well, similar to poverty, unemployment will also
have negative effects on Black migration. These migrants will avoid metros where work is
difficult to obtain.
The industrial specialization of the MA is related to income inequality and racial
residential segregation, and together both can impact migration (Farley and Frey 1994; Logan et
al 2004). For instance, higher levels of manufacturing employment compared to low levels of
service employment has been connected to lower income inequality (Jaret, Reid and Adelman
2003). As well, high proportions of professional, management and technical (PMT)
employment reflects higher paying positions in emerging MAs in the South. And employment
in the military and the public sector are associated with lower levels of segregation and thus will
continue to attract migrants (Logan et al 2004).
(B) RACE, ETHNICITY, AND SPACE
non-Hispanic Black, non-Hispanic White, non-Hispanic Asian and Hispanic populations on
migration. Additional variables related to space capture metropolitan diversity experienced in
the MA and its associated Black-White racial residential segregation, and both consider how
these characteristics might impact migrant location outcomes. Generally, because new MAs are
less segregated than old MAs, they should be more attractive to migrants. The South and West
have the majority of new MAs in the U.S.—older MAs are those whose central cities had
populations greater than 50,000 in the 19th century (Logan et al 2004).
The ethnocentric perspective argues that migrants would find more favorable conditions
in MAs with higher populations of in-group members. This perspective states that the presence
of in-group members reduce feelings of alienation (Levine 1972). Minorities would find areas
with a strong majority group representation less desirable due to difficulties of incorporation
when compared to highly concentrated minority areas (see Pais 2013). As well, Black migration
would be driven into MAs with larger Black populations while Black migrants may also avoid
MAs with significant White populations.
The racial and ethnic composition of the MA population will impact the MA’s ability to
attract migrants and the size of a racial/ethnic group in the MA would determine the availability
of that group within its various types of neighborhoods (Crowder et al 2012; South and Crowder
1997). The likelihood that migrants would have access to other racial and ethnic groups would
depend on that group's relative size in the MA (Crowder and South 2005). Thus, the size of
racial and ethnic groups in MAs would determine the MA’s relative levels of diversity or
segregation.
The spatial assimilation and the place stratification models further help to explain
residential landscape, Black migrants should have access to the same opportunities as White
migrants, and thus find themselves in similar metropolitan locations despite racial differences
(Park 1925). In contrast, the place stratification model generally posits that this would not be
the case. Due to racial residential segregation and economic disparities across race, Blacks
would relocate to metropolitan areas for different reasons than Whites, highlighting distinct
racial differences between the two groups (Logan et al 2004).
One should expect the MA’s level of diversity and racial residential segregation to effect
Black migration to the region. Diversity is the presence of a range of minority groups in the MA
(Reibel and Regelson 2011), which is key in a region that has historically operated under a
Black-White racial dichotomy. Since MAs are becoming increasingly diverse (Fong and Shibuya 2005)
and more so in the South (Iceland 2012), diversity may increase the number of available
integrated spaces within the MA, increasing the MAs ability to attract residents. For example,
the spatial assimilation model might assume that Black migrants would equate diverse spaces
with greater opportunities and access to more resources than historically segregated Southern
spaces. Thus, a diverse MA would be more attractive to migrants. For Whites, the place
stratification model suggests that greater diversity, large proportions of Blacks, Latinos, or
Asians in a MA may threaten a more familiar way of life in Southern MAs. Thus, increased
diversity in a MA would motivate Whites to avoid these spaces (Iceland et al 2013; Blalock
1967).
Additionally, the levels of Black-White residential segregation may inversely impact Black
migration, and act in ways counter to diversity. Research has shown that lower levels of racial
residential segregation are tied to residential equity in U.S. metropolitan areas (Iceland 2009).
Under the spatial assimilation model, Black migrants may avoid MAs with high levels of
denying quality residential options (Massey and Denton 1993; Charles 2003). Specifically the
spatial assimilation model would expect Blacks to avoid MAs with high levels of racial residential
segregation, while the place stratification model would predict that MAs of this type would be
unavoidable for Blacks due to discrimination in the greater housing market.
(C) MIDDLE CLASS PRESENCE
The Black middle class exemplifies America's promise of upward mobility (Landry
1987), yet Patillo-McCoy argues that the changing economy of the United States has negatively
impacted opportunities to both the growth and the stabilization of the Black middle class (1999).
Additionally, Lacy (2009) suggests that there are two Black middle class types, (a) the fragile
Black lower-middle class and (b) the stable Black middle class. This study focuses on the stable
Black middle class that lives under socioeconomic conditions that more resemble the White
middle class. Lacy states that the Black lower middle class "typically earn less than fifty
thousand dollars annually, do not hold college degrees, and are concentrated in sales and clerical
positions rather than white-collar positions" (2009). Black primary and return migrants would
be more attracted to Southern MAs with the presence of a stable Black middle class since that
general presence may represent future opportunities for these Black migrants. The effect of the
Black middle class presence on non-South to South migration decisions has been implied but
not explored in previous research (Frey 2004).
(D) METROPOLITAN CONTROL VARIABLES
Metropolitan control variables cover several key components including population size,
suburban population, and municipal fragmentation; new housing and owner occupied housing;
the retirement population; and the high school dropout population. MAs with larger population
segregation, therefore MA population size may negatively affect an MAs ability to attract Black
residents. Suburban population can also provide greater minority access to quality
neighborhoods, so MAs with a strong suburban population will attract migrants (Crowder et al
2012). In addition, municipal fragmentation like racial residential segregation could negatively
impact Black access to quality neighborhoods within an MA (Crowder et al 2012). As municipal
fragmentation increases, so does the chance that individuals separate themselves by way of race
or class characteristics.
New housing construction provides greater opportunity for migrant access to new and
quality homes. The housing availability perspective finds that MAs with significant recent
housing construction allows greater opportunity for residential mobility, and reduces levels of
residential segregation (Farley and Frey 1994). Further, high levels of owner occupied housing
may act as a deterrent to migrant access to quality neighborhoods within a larger MA. Higher
levels of occupied housing may reduce mobility, and this coupled with lower rates of new
housing may typify an intractable housing market.
A strong retirement-aged population reflects an MA that is attractive to retirees. Since
return migrants have been born in the South prior to living in the North, they may be more
prone to retirement-centered migration, while this may not be true for primary migrants moving
to seek opportunity. Thus, return migrants may find themselves in locations with a larger
retirement-age population than would primary migrants. Lastly, the high school dropout
population is an excellent proxy for the quality of young people and schools in an MA. MAs
with a higher high school dropout rate may act as a deterrent for migrants, especially primary
migrants, seeking opportunities for their children.
This papers draws on two sources of data, including the Integrated Public-Use
Microdata Series (IPUMS) and the Decennial Census Data. The IPUMS provides a rich source
of publicly available individual-level census data and can be used to study migration patterns of
U.S. residents. For this study, Black and White residents who were 25 years or older and reside
in a Southern MA between 1980 and 2010 were selected in order to separate the effects of those
migrants moving for college.2 This is especially important because of the draw for Black
college-aged students to Historically Black Colleges and Universities almost exclusively located in the
South (Pendergrass 2013). This paper focuses on Black and White non-South to the South
migrants characterized as two types. The first type represents return migrants—individuals that
moved from the non-South but were also born in the South. The second type represents
primary migrants—individuals that moved from the non-South but were not born in the South.
This study excludes all migration to the South from destinations abroad. The study includes all
qualifying individuals migrating from the non-South to the South.
The data is structured as a panel data set in order to understand the metropolitan
determinants of migratory behavior over the previous four decadal periods (1980, 1990, 2000,
2010). Each Southern MA is in the data set for up to four time periods, the Decennial periods
of 1975-1980, 1985-1990, and 1995-2000, and the ACS period of 2006-2010. The panel dataset
allows for a larger sample and a robust look at Southern migration during the 40-year period of
this study. The dataset is appended with IPUMS data to capture metropolitan-level
socio-economic and demographic characteristics drawn from the Decennial Census 1970, 1980, 1990,
and 2000 periods. This data has been lagged ten-years in order to characterize each Southern
MA before the migration event. The model can then predict which metropolitan characteristics
!!!!!!!!!!!!!!!!!!!!!!!!!!!!!!!!!!!!!!!!!!!!!!!!!!!!!!!!
of the previous decade attract Black and White residents in the present decade. For example,
Decennial Census 1990 data is used to predict migration during the 1995-2000 migration period.
Dependent Variables. My analysis explores the influence of metropolitan characteristics on
two distinct outcomes—non-South to South migration for (1) return migrants and (2) primary
migrants. The first dependent variable measures return migration and is defined as (1) all
residents living in Southern metros, that both moved from the non-South but were born in the
South, while the second dependent variable measures primary migration which is defined as (2)
all residents living in Southern metros that moved from the non-South and who were not born
in the South. Separate models are produced for both Black and White return and primary
migrants for a total of four models.
Independent Variables. This analysis includes control variables that have been noted to act
as metropolitan constraints to mobility (Crowder et al 2012; Iceland et al 2013), including:
metropolitan population (logged), percentage of residents aged 65 and over, percentage of new
housing, percentage of high school dropouts, percentage of owner occupied housing, percentage
of suburban population and rate of municipal fragmentation in the MA. Suburban population
and municipal fragmentation are obtained from the U.S. Department of Housing and Urban
Development's State of the Cities Data Systems (2009). The municipal fragmentation variable
captures the probability that two individuals will live in different municipalities within the same
MA (Crowder et al 2012). A score of 0 represents a MA that functions as a single municipality
while a score of 1 represents a MA under compete fragmentation.
This analysis also includes measures for the metropolitan economic context which includes
poverty and unemployment rates, and the percentage of the MA’s labor force that are employed
(PMT) industries. I also include measures to capture race, ethnicity and space of the MA, which
include the proportions of non-Hispanic White, non-Hispanic Black, non-Hispanic Asian and
Hispanic, as well as the MA’s Black-White dissimilarity and diversity indices (see the American
Communities Project for further information regarding these indices). The dissimilarity index
captures the level of Black-White racial residential segregation in the MA. And, the diversity
index measures how well the MA has moved toward an even representation of the following
five racial-ethnic categories: Hispanic White, Hispanic Black, Hispanic Asian,
non-Hispanic Other and non-Hispanic. Finally, there are measures to capture the middle-class presence in the
MA including measures of the middle-class: the percentages of same-race residents with a
college education and with a household income of $50,000 or more.3
The literature suggests that the majority of Black population growth in the South is
driven by migration from elsewhere into Southern MAs. Yet, Black migrant population growth
varies across Southern MAs and larger subregions, and most likely as a result of differences in
opportunity. The majority of scholars analyze the South as one uniform region. Yet, there has
been some discussion on the necessity of establishing Southern subregions and how to
appropriately construct them. For example, the Census Bureau distinguishes the Greater
Southern region into three distinct parts defined as the South Atlantic, East South Central and
West South Central4. These distinctions are seldom used, and when used, distinct differences
between the subregions are rarely found (e.g. Iceland et al 2013). Falk et al (2004) have defined
!!!!!!!!!!!!!!!!!!!!!!!!!!!!!!!!!!!!!!!!!!!!!!!!!!!!!!!!
3 Lacy (2009) also includes homeownership and the Professional, Management and Technical Occupation as measures of the stable Black middle class. These measures were highly correlated and in order to determine the potential for multicollinearity within my models, I focused on the proportion of the Black college-educated population and the Black high-income household population.
the South as two regions defined as the Deep South and Border States5. Essentially the Border
States surround the states in the Deep South that make up the Southern core. Using these
regions, it was found that 65% of Blacks were moving to the Deep South states while 62% of
Whites were moving to the Border States (Hunt et al. 2012). Still, Hunt et al (2012) suggest that
new definitions of Southern subregions should be constructed to capture the complexity of
Black southern migration. Frey (2006) found that Blacks were moving in smaller numbers to
the "Old South", states in Louisiana, Mississippi, and Alabama compared to the "New South",
emerging states in Texas, North Carolina, Georgia and Florida. The "New South" locations are
attractive to Black migrants due to their "high-tech development, knowledge-based industries,
recreation, and new urban and suburban communities" (Frey 2004). Based on these findings
and MDC white papers on social and economic conditions in the South (1998a, 1998b, 2002,
2010, 2011), this study presents three subregions in an effort to capture subregional distinctions
across the South. They include the South Atlantic which is defined as those U.S. Southern states
along the Atlantic Coast; the Inner South, as comprising all states in the middle of the Southern
region; and Texas, as characteristically different from the Inner South due to its economic and
historic attributes, and as a State, large enough to represent its own subregion because of the
number of large metropolitan areas located within it.6 These three subregions best capture
distinctions found between subregions in the Greater South.
Analytic Strategy. I pool the data for the study period by decadal period yielding up to four
periods for each MA in the full sample. I use the strategy of a non-constant sample of MAs to
best represent metropolitan change in the South between 1970 and 2010 (See Iceland et al 2013).
!!!!!!!!!!!!!!!!!!!!!!!!!!!!!!!!!!!!!!!!!!!!!!!!!!!!!!!!
5 Deep South: VA, NC, SC, GA, AL, MS, LA, and AR and Border States: DE, MD, WV, KY, TN, TX, FL, and DC.
In order to explain the ability of a Southern MA to attract and retain residents between 1970 and
2010, I execute a random effects model. In this case, the random effects model is specifically
useful in providing generalized inferences for the study's migrant populations within and
between Southern MAs. Thus, under this model, the study will be able to make inferences for
each of the distinct migrant groups while controlling for differences between the MAs in which
they are located.
In the base model, represents the vector of metropolitan variables, i represents the
Southern MA and t represents the Decennial Census year. represents the coefficients for
these predictors, represents the unknown intercept for each Southern MA, is the between Southern MA area error term and is the within Southern MA area error term. I estimate
separate models for primary and return migrants for both Black and White populations. Each
model is race and migrant-specific estimating the strength of metropolitan characteristics on
attracting each of these groups to the South.
The model above includes a subset of variables in which represents the metropolitan
control variables, represents the metropolitan economic context, represents the racial and ethnic
character, and represents the middle class presence. These sets of variables capture important
factors in understanding the macro-level effects on primary and return migration. This model
also includes a subregional variable to control for Southern subregional differences.
Limitations. One of the limitations of this study is the change in surveys experienced
between the 2000 and 2010 periods. The Decennial Census has discontinued their long form
€
γ
1
it=
β
0
+
β
1
x
1
it+
α
i+
µ
it+
ε
it€
x1
€
αi
€
εit
€
γ
1it=
β
0+
β
1x
1it+
β
2x
2it+
β
3x
3it+
β
4x
4it+
α
i+
µ
it+
ε
it€
x1
€
x3
€
survey that has historically captured information related to migration. Specifically, the Decennial
Census asks the question, "Where did this person live five years ago?” which allows scholars to
examine migration and mobility in the U.S. The American Community Survey (ACS) has
replaced the Census long form for the 2010 period. Because the ACS is an annual survey, unlike
the Decennial Census, they ask movers "Where did you live one year ago?". In order to
maintain consistency over the two periods, I aggregated the ACS data estimates for the 2006,
2007, 2008, 2009, and 2010 years to produce counts for all migrant types. The challenge with
the ACS is that in the aggregation of migrant counts, one is at risk of capturing repeat movers
who are generally left out of the Decennial Census. Due to greater intervening obstacles for
long-distance migrants, repeat migration is less than likely for this group. As a result, I run the
proposed models both with and without the 2006-2010 ACS data and found similar results
across models.
Table 1 provides the descriptive statistics of Southern metropolitan-level characteristics
in the sample before the migration event between 1970 and 2000. It is clear that the South has
experienced strong metropolitan growth during this time period. And when considering
Southern subregional growth, it is apparent that the South Atlantic MAs had the largest average
total population with a population mean at a fewer than 600,000 residents. In contrast, Texas
MAs had a population mean slightly over 400,000 residents while Inner South MAs were just
short of the 400,000 mark. South Atlantic MAs grew at a faster rate (73.8%) than both those in
Texas (45%) and in the Inner South (25%). Texas has the smallest average Black population
(9%) of the three subregions with a Black population that is less than half both the South
Atlantic (21%) and the Inner South (20%). In contrast, the average Hispanic population in
Texas is significantly larger than the average across the rest of the South (figures not shown in
33
!
TABLE 1: MEANS AND STANDARD DEVIATIONS FOR SOUTHERN METROPOLITAN AREAS, 1970-2000
1970 1980 1990 2000 2010 %Change
between
Mean SD Mean SD Mean SD Mean SD Mean SD 1970 and
2000
Metropolitan Characteristics
Total Population 388,216 493,286 445,717 563,768 511,726 694,807 625,990 933,866 787,478 1,190,000 61.2%
Southern Subregion Population
South Atlantic Population 448,497 587,241 523,135 674,203 608,655 815,642 779,433 1,130,00
0 892,702 1,290,000 73.8%
Inner South Population 346,892 305,226 375,211 314,917 393,897 329,487 433,727 389,919 539,249 524,990 25.0%
Texas Population 328,777 542,993 411,939 660,421 511,055 876,045 476,791 833,863 992,933 1,720,000 45.0%
Prop New Housing 0.32 0.09 0.34 0.08 0.28 0.08 0.22 0.06 0.34 0.09 -31.3%
Propotion Age 65+ 0.09 0.04 0.11 0.04 0.12 0.04 0.13 0.04 0.13 0.04 44.4%
Prop Dropout 0.18 0.05 0.16 0.04 0.12 0.03 0.11 0.03 0.07 0.02 -38.9%
Prop Owner Occupied 0.64 0.07 0.67 0.06 0.66 0.06 0.68 0.05 0.68 0.05 6.3%
Prop Suburban Population 0.50 0.20 0.56 0.20 0.58 0.20 0.59 0.20 N/A N/A 18.0%
Municipal Fragmentation 0.58 0.26 0.60 0.25 0.63 0.24 0.65 0.24 N/A N/A 12.1%
Metropolitan Economic Context
Prop Poverty 0.15 0.06 0.16 0.05 0.16 0.06 0.15 0.05 0.16 0.05 0.0%
Prop Unemployment 0.04 0.01 0.06 0.02 0.07 0.02 0.06 0.02 0.08 0.02 50.0%
Prop Manufacturing 0.20 0.10 0.20 0.09 0.17 0.08 0.13 0.06 0.10 0.05 -35.0%
Prop Public Sector 0.19 0.08 0.20 0.06 0.18 0.06 0.17 0.05 0.17 0.04 -10.5%
Prop PMT Sector 0.24 0.05 0.51 0.06 0.56 0.06 0.31 0.05 0.33 0.05 29.2%
34
!
Racial and Ethnic Character
Prop Non-Hispanic White 0.82 0.10 0.75 0.15 0.73 0.16 0.68 0.16 0.64 0.16 -17.1%
Prop Non-Hispanic Black 0.18 0.10 0.18 0.11 0.18 0.11 0.19 0.12 0.19 0.12 5.6%
Prop Non-Hispanic Asian 0.00 0.00 0.01 0.01 0.01 0.01 0.01 0.01 0.02 0.02 --
Prop Hispanic 0.00 0.00 0.06 0.16 0.07 0.17 0.10 0.18 0.13 0.18 --
Black-White Dissimilarity 63.95 12.20 60.21 12.85 53.64 11.55 50.90 10.43 51.11 9.82 -20.4%
Diversity Index 40.78 13.97 38.13 10.74 39.84 11.23 47.92 12.10 54.83 12.45 17.5%
Middle Class Presence
Prop Black College Educated
Population 0.05 0.02 0.08 0.05 0.10 0.04 0.13 0.05 0.15 0.06 160.0%
Prop White College Educated
Population 0.13 0.05 0.17 0.05 0.20 0.06 0.25 0.07 0.28 0.08 92.3%
Prop Black High Income HH
(>$50k) 0.22 0.07 0.33 0.08 0.28 0.08 0.33 0.07 0.30 0.07 50.0%
Prop White High Income HH
(>$50k) 0.55 0.10 0.58 0.08 0.50 0.08 0.54 0.07 0.52 0.07 -1.8%
N 79 86 104 109 111
There has been an observable decrease in the proportion of the White population, which can be
largely attributed to both the growth of the Hispanic population, and the Black population
growth due to primary and return migrations to the South. Increased Black migration to the
South, along with fewer Blacks leaving the South, has enabled the Black population to maintain
a sizable presence in the region.
In observing the Southern metropolitan economic context, between 1970-2000, all of
the following industries experienced a decline: manufacturing (-35%), service (-11%), and public
sector (-72%). In contrast, the PMT industry experienced strong growth with a 29% increase.
Black-White residential segregation decreased in the South by 17% during this period, which is
consistent with previous research that has observed overall national declines in residential
segregation (Glaeser and Vigdor 2012). Accordingly, the Diversity Index in the average
Southern MA showed an overall increase of 18% between 1970 and 2000, although there
appears to have been noticeable fluctuations throughout the decades. The Black middle-class
has grown exponentially in the South between 1970 and 2000. The proportion of the Black
college educated population grew 160% and the White college educated population increased by
92% across the average Southern MA. In addition, the proportion of Black high-income
households grew at a rate of 50% while White high-income households experienced a slight
decline. Still, the proportion of White high-income households is approximately twice that of
Black high-income households for any given year.
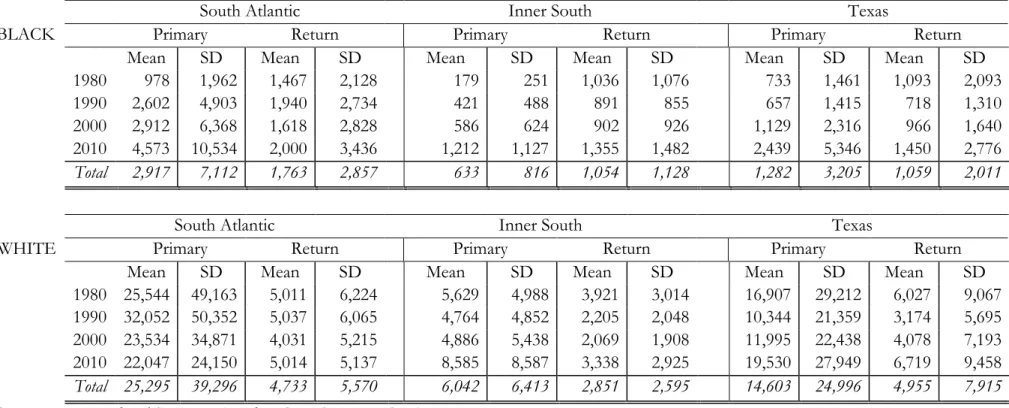
Table 2 displays the metropolitan means of primary and return migrants across race by
Southern subregion between 1980 and 2010. For Whites, the size of the primary migrant
population is generally larger than that of the return migrant population for any given year
across all subregions. In contrast, for Blacks, the size of the primary migrants population has
36
TABLE 2: MEANS AND STANDARD DEVIATIONS FOR PRIMARY AND RETURN MIGRANTS TO SOUTHERN METROPOLITAN AREAS BY SUBREGION, 1980-2010
South Atlantic Inner South Texas
BLACK Primary Return Primary Return Primary Return
Mean SD Mean SD Mean SD Mean SD Mean SD Mean SD 1980 978 1,962 1,467 2,128 179 251 1,036 1,076 733 1,461 1,093 2,093 1990 2,602 4,903 1,940 2,734 421 488 891 855 657 1,415 718 1,310 2000 2,912 6,368 1,618 2,828 586 624 902 926 1,129 2,316 966 1,640 2010 4,573 10,534 2,000 3,436 1,212 1,127 1,355 1,482 2,439 5,346 1,450 2,776 Total 2,917 7,112 1,763 2,857 633 816 1,054 1,128 1,282 3,205 1,059 2,011
South Atlantic Inner South Texas
WHITE Primary Return Primary Return Primary Return
2000. It is only in the Inner South that the size of the return migrant population has been
generally larger than primary migrants for Blacks. Still, the size of the primary migrant
population has been generally smaller in the Inner South than in both the South Atlantic and
Texas. At first glance the Inner South appears to be a subregion of particular interest to Black
return migrants; instead, it would be more accurate to state that the Inner South is a subregion
that has not been attractive to Black primary migrants. The South Atlantic and Texas are
subregions that have increasingly drawn primary migrants over time. As well, for Whites, the
South Atlantic and Texas have been more attractive to primary migrants than the Inner South.
In accordance with previous literature, although the size of the return migrant
population is smaller than the size of the primary migrant population between 1980 and 2010
(Hunt et al 2013), the Inner South’s inability to attract primary migrants is missed when the
South is studied as a homogenous region. Table 2 illustrates that the Inner South fails to attract
primary and return migrants during the study period while the South Atlantic and Texas have
experienced the bulk of the South’s migrant growth.
The following section examines the effects of metropolitan contexts on the Southern
MA’s ability to attract Black primary and return migrants. This study juxtaposes the outcome of
White primary and return migrants to compare the effects of metropolitan characteristics on
their Black counterparts.
MODELING METROPOLITAN EXPLANATIONS FOR SOUTHERN BLACK
MOBILITY
The theoretical arguments guiding my analysis suggests that metropolitan characteristics
are important in the ability of Southern MAs to attract Black residents under the Black primary
race covering the period of 1970-2010.7 In this section, I will compare Black and White primary
and return migrants focusing on characteristics including those representing subregional and
metropolitan control variables, metropolitan economic context, race, ethnicity and space, and
middle class presence.
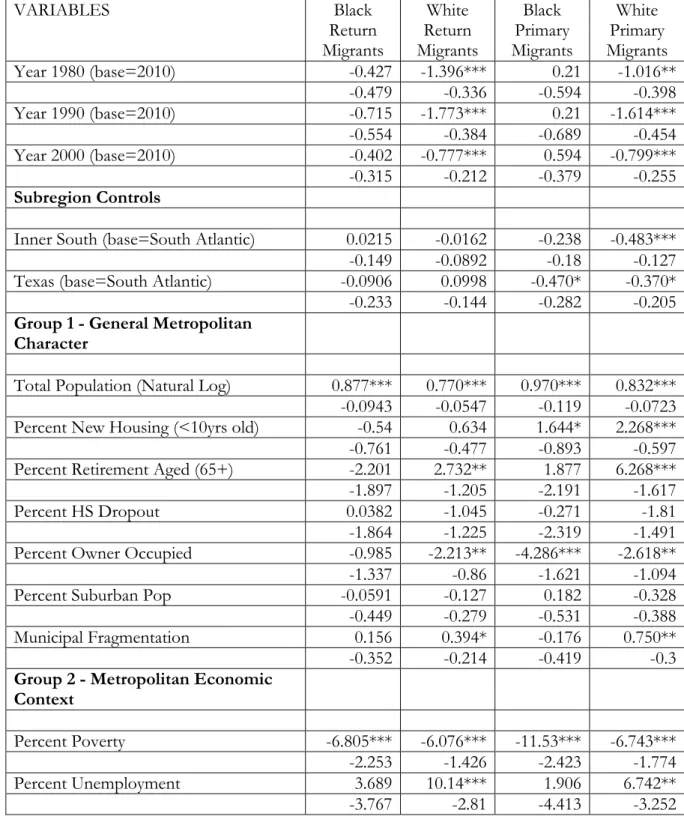
(A) SUBREGIONAL AND METROPOLITAN CHARACTERISTICS
According to Table 3, there is evidence that White primary migrants are more likely to
locate to the South Atlantic states over both the Inner South and Texas, while Black primary
migrants are more likely to move into the South Atlantic compared to Texas with no significant
difference between the South Atlantic and the Inner South. There is no significant subregional
effect for neither White nor Black return migrants. Not surprisingly, the size of the MA is
significant in attracting both primary and return migrants, placing larger MAs at an advantage in
drawing additional migrants. These findings together suggest that the South Atlantic is at an
advantage in attracting non-South to South migrants whether it is due to their disproportionately
larger MAs or because of their general attractiveness.
As it relates to new housing construction, White and Black primary migrants are more
likely to locate to developing MAs, while this relationship is not significant for their return
migrant counterparts. In addition, a greater percentage of owner occupied housing is a deterrent
to Black and White primary migrants and White return migrants. Thus, while new housing
increases migrants’ access to emerging neighborhoods across MAs, increasing percentages of
owner occupied housing may make a metropolitan area more intractable. Together these