ISSN(Online): 2320-9801
ISSN (Print): 2320-9798
I
nternational
J
ournal of
I
nnovative
R
esearch in
C
omputer
and
C
ommunication
E
ngineering
(An ISO 3297: 2007 Certified Organization)
Vol. 4, Issue 1, January 2016
Optimized K-means for Healthcare Using
MapReduce Framework
Krutika Talmale, Shruti Nikumbh, Sheetal Gadhe, Shubhangi Kale
BE Student, Dept. of Computer Engg., MIT AOE, Alandi, Pune University, Pune, India
BE Student, Dept. of Computer Engg., MIT AOE, Alandi, Pune University, Pune, India
BE Student, Dept. of Computer Engg., MIT AOE, Alandi, Pune University, Pune, India
Asst. Professor, Dept. of Computer Engg., MIT AOE, Alandi, Pune University, Pune, India
ABSTRACT: In day to day life big data of hospital needs to be digitalized. It requires data should be properly analyzed; this can be done by clustering or grouping the data in various attributes. This includes that the health care information need to be properly analyzed in order that we can deduce that within cluster or gender, diseases attack .This gigabyte size of data need to be process for computation that can be done with hadoop which is nothing but the distributed data processing technique. Hadoop is the framework that helps to process the large data in efficient manner. Taking advantage of hadoop over big data of healthcare, it is possible to modernized the health care system. This will helps to improve the patient interaction with doctors and more specific and analyzed view of diseases and their treatments on the bases of symptoms, region or season wise. Beyond improving profits on wasted overhead, massive information in tending is being used for prediction, cure preventable diseases improve quality of healthy life and avoid deaths that may be preventable. Proposed system is the abstract representation of analyzed healthcare data.
KEYWORDS: Big Data; Hadoop; K-means clustering; MapReduce Framework
I. INTRODUCTION
In era of big data even healthcare is required to be digitalized and modern. So that healthcare data should be analysed which will help to detect on which group or gender or region diseases attack the most .This disease analysis will need large computation which can be performed by distributed processing. A popular paradigm for data processing i.e. Hadoop.
In health care system massive amounts of knowledge traditionally has been generated, by record keeping, compliance restrictive necessities, and patient care data, patient’s personal data records. This large size of analytics can want massive computation which may be done with facilitate of distributed process, Hadoop. MapReduce, a preferred computing paradigm for large-scale processing in cloud computing. Our main aim is to sort this data in such a way that complexity of handling this big get solved. Analysis is carried out with perfection in different measure. So the task of handling and dealing with massive data of healthcare is becomes easy and beneficial. Hadoop based analysis using mapper reducer deal with analysis and reduction of this data. Graphical way of representing outcomes in the form of graphs, pie chart, tabular format made this proposed system more readable and useful.
Thus this proposed system helps to deal with large dataset of hospitals that may be used by government for their health survey analysis in future use.
II. RELATED WORK
ISSN(Online): 2320-9801
ISSN (Print): 2320-9798
I
nternational
J
ournal of
I
nnovative
R
esearch in
C
omputer
and
C
ommunication
E
ngineering
(An ISO 3297: 2007 Certified Organization)
Vol. 4, Issue 1, January 2016
than the opposite ancient algorithms like PSO (Particle Swarm Optimization), ACO, Simulated hardening so on. In [2], M.Arshad designed a clump algorithmic rule supported parrot (Key phrase Extraction Algorithm) to solve the matter of document clump in ancient clump technique. The parrot Bisecting K-Means clump algorithmic rule was accustomed extract the check documents from an outsized quantity of text documents in a simple and efficient method. The clump algorithmic rule was applied so as to come up with the clustering document supported the extracted keys. The documents were classified into many clusters like within the Bisecting K-Means algorithmic rule. The results and therefore the performance showed a systematically smart quality of clusters that incontestible successively that the Bisecting K-Means is a superb algorithmic rule for clump an outsized variety of documents. The causes of this effect was analyzed by Jiye Liang et al, [3] and that they projected that it probably occurred a lot of in the fuzzy K-Means clump method than the exhausting K-Means clump method. A multicenter clustering algorithmic rule was designed so as to avoid this effect. The multicenter during this algorithmic rule accustomed represent every cluster instead of one single centre. The effectiveness of the designed clustering algorithmic rule in clump balanced and unbalanced information was illustrated by the experimental results that were compared with the artificial and real datasets. An algorithmic rule referred to as K-MICA was projected by Taher Niknam et al, [4] by combining transparent substance (Modify Imperialist Competitive Algorithm) and K-Means. It combined hybrid algorithmic rule was accustomed optimize the clump of N objects into K clusters. The performance was evaluated by testing it on several datasets and by comparison it with alternative clump algorithms.It targeted was on the K-Means clustering algorithmic rule. The initial alternative of the cluster centers heavily affected the outputs of the K-Means algorithmic rule. It overcomes this downside and its performance was compared with many existing traditional algorithms. The convergence of the hybrid algorithmic rule to the world optimum answer was better than that of the opposite biological process algorithms.
B S Vamsi Krishna et al [5], has applied the derived background from WordNet. Document vectors created from WordNet Synsets were used as input for clump. It’s compared between K-Means and Bisecting K-Means algorithms that showed that the Bisecting K-Means clustering algorithmic rule was higher than the quality K-Means clump technique. Nor Ashidi Mat Isa et al, [6] for the applying of image segmentation. These 3 algorithms are fuzzy moving K-Means, adaptive moving K-Means and adaptive fuzzy moving K-Means algorithms. Normal pictures and exhausting proof on microscopic digital image were wont to analyse these algorithms. The segmentation result was compared with the traditional K-Means, fuzzy C-Means and moving K-Means algorithms.
In the care trade traditionally has generated massive amounts of knowledge, [7] shows record keeping, compliance & regulative needs, and patient care. Whereas most knowledge is hold on in textual matter kind, the current trend is toward fast conversion of those massive amounts of knowledge. Driven by necessary requirements and therefore the potential to enhance the standard of supply meantime reducing the costs, these huge quantities of knowledge (known as 'big data') hold the promise of supporting a large range of medical and care functions, together with among others clinical call support, disease surveillance, and population health management. Reports say knowledge from the U.S. care system alone reached, in2011, one hundred fifty Exabyte’s. At this rate of growth, huge knowledge for U.S. care can shortly reach the zettabyte (1021 gigabytes) scale and, shortly when, the yottabyte (1024 gigabytes). Kaiser Permanente, the California-based health network, that has over nine million members, is believed to have between twenty six.5 and forty four petabytes of doubtless wealthy knowledge from EHRs, together with pictures and annotations.
ISSN(Online): 2320-9801
ISSN (Print): 2320-9798
I
nternational
J
ournal of
I
nnovative
R
esearch in
C
omputer
and
C
ommunication
E
ngineering
(An ISO 3297: 2007 Certified Organization)
Vol. 4, Issue 1, January 2016
In recent years [9], Map Reduce has become a well-liked high performance computing paradigm for large-scale processing in clusters and knowledge centres. Hadoop, associate degree open supply implementation of MapReduce, has been deployed in massive clusters containing thousands of machines by firms such as Yahoo! and Facebook to support instruction execution for giant jobs submitted from multiple users (i.e., MapReduce workloads). The Patient knowledge Analysis data system (PDA-IS) [10] provides practicality to a adviser Physician in Geriatric drugs in terms of storing and analysing prime quality clinical patient knowledge for the purposes of additional knowledgeable and correct deciding. The system's general aim is to support the adviser Dr. in up the standard of supply.
III.PROPOSED ALGORITHM
A. Design Considerations:
The first step will be database design. A database would be required for storing the symptoms and diseases. Also, the system has three different users like Admin, Doctor and Analyst.
The second step will be the project design. The project will be designed based on the types / attributes on which analysis to be done
The third step is to upload the populated data. Pre processing will be done after the data uploaded to system. Tokenization, Mapper, Reducer (Hadoop Processing will be done on the data) and the analysis will be done for the said attributes.
B. Description of the Proposed Algorithm:
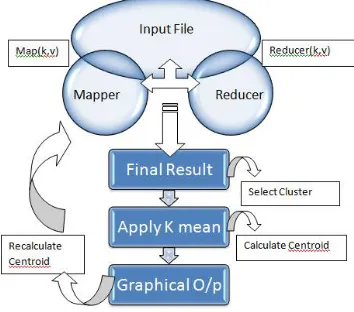
In this proposed system, the K-means algorithm is implemented on MapReduce framework. As in Fig.1, the system provides the text file which has dataset related to the attributes of proposed system as an input to the Mapper function to perform mapping on the dataset. The output of the Mapper function is given in (key, value) pair form. Then mapper function store output in intermediate file. This file provides Reducer function as an input.
Fig 1: Process of Map Reduce using K-means Algorithm
The Reducer’s job is to process the data that comes from the mapper. After processing, it produces a new set of output. On this output of reducer we have to perform the K-means algorithm. First of all randomly select the select ‘c’ cluster centres. Calculate the distance between each data point and cluster centres. Assign the data point to the cluster centre whose distance from the cluster centre is minimum of all the cluster centres. Recalculate the new cluster centre using:
ISSN(Online): 2320-9801
ISSN (Print): 2320-9798
I
nternational
J
ournal of
I
nnovative
R
esearch in
C
omputer
and
C
ommunication
E
ngineering
(An ISO 3297: 2007 Certified Organization)
Vol. 4, Issue 1, January 2016
Where, ‘ci’ represents the number of data points in ith cluster. Recalculate the distance between each data point and new obtained cluster centres. If no data point was reassigned then stop, otherwise reassign the data point to the cluster centre whose distance from the cluster centre is minimum of all the cluster centres.
IV.PSEUDO CODE
Let X = {x1,x2,x3,……..,xn} be the set of data points and V = {v1,v2,…….,vc} be the set of centers.
Step 1: Randomly select ‘c’ cluster centres.
Step 2: Calculate the distance between each data point and cluster centres.
Step 3: Assign the data point to the cluster centre whose distance from the cluster centre is minimum of all the Cluster centres.
Step 4: Recalculate the new cluster centre using eq. (1)
Step 5: Recalculate the distance between each data point and new obtained cluster centres. Step 6: If no data point was reassigned then stop, otherwise repeat from step 3.
Step 7: End.
V. SIMULATION RESULTS
Our experimental data set is from healthcare information. This analyses effectiveness of algorithm and speed ratio, using K-means algorithm for clustering analysis of data. This healthcare data analysis will be done with the help of cluster. In proposed system, analysis is done through the data set of healthcare which has the data of all hospitals in a various cities.
Causes of Death 2008 2009 2010 2011 2012 2013 2014 2015
1 2 3 4 5 6 7 8 9
Cholera 898 449 310 1 1 42 2 60
Small pox 345 158 968 968 5 60 65 115
Fever 5,042 3,926 2,873 2,160 1,385 1,927 3,048 3,412
Dysentery & Diarrhoea 675 414 402 278 226 264 275 356
Respiratory Diseases 571 1,040 1,051 1,110 946 1,016 1,570 1,337
Other causes 4,456 7,390 6,640 5,510 7,425 8,563 5,063 8,269
Total deaths 11,987 13,277 12,244 10,027 9,988 11,872 10,023 13,549
Table 1. Analysis of death in recent years
In above Table.1, it shows the year wise analysis of disease for unsurvival /death. In the year wise analysis, it provides the causes of death and count of death in that particular year. And also provide summation of death in the particular year.
ISSN(Online): 2320-9801
ISSN (Print): 2320-9798
I
nternational
J
ournal of
I
nnovative
R
esearch in
C
omputer
and
C
ommunication
E
ngineering
(An ISO 3297: 2007 Certified Organization)
Vol. 4, Issue 1, January 2016
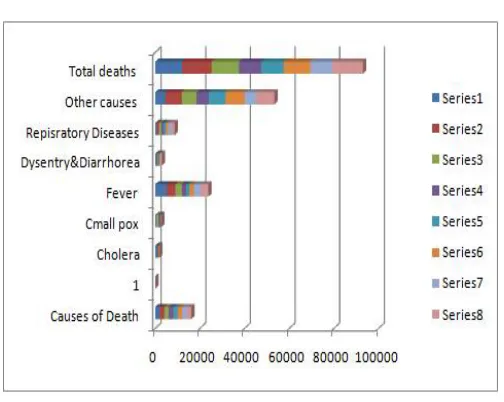
Fig.2. Actual Result of System
In the above figure.2, it represents the year wise analysis in graphical format for better understanding the user. It is actual result of the proposed system to the proper action in the future.
Sr.No Advantages of healthcare % Contribution 1 Better Understanding of patients 33
2 Improving Service 17
3 Product Delivery 35
4 More Value 15
Table 2. Contribution of System
In the above table.2, we are specifying the advantages related to the system and its actual contribution in the proposed system in the percentage. And its exact representation using pie chart is shown in the figure 3 which is given below.
Fig.2. Contribution represent using pie chart 33%
17% 35%
15%
% Contribution
Better Understanding of patients Improving Service
ISSN(Online): 2320-9801
ISSN (Print): 2320-9798
I
nternational
J
ournal of
I
nnovative
R
esearch in
C
omputer
and
C
ommunication
E
ngineering
(An ISO 3297: 2007 Certified Organization)
Vol. 4, Issue 1, January 2016
VI.CONCLUSION AND FUTURE WORK
As big data analysis is at stage of development, they have potential to make informed decision. This system is going to propose framework using optimized k-means for healthcare analysis using map reduce. System will help to detect diseases on different attributes and take effective and immediate actions. Disease Detection would help to keep up-to-date stock in pharmaceutical companies. This system as of now can also be used for such type of analysis with minor changes. The system can be extended to do the analysis of prescriptions so as it would be easy for maintaining medicines stock in medical stores.
REFERENCES
1. Su Jin-qi, Xue Hui-feng, Zhan Hai-liang. K-means Initial Clustering Center Optimal Algorithm Based on Partitioning[J]. Microelectronics&Computer, 2009, 26(1):8-11.
2. Tong Xue-jiao, Meng Fan-rong, Wang Zhi-xiao.Optimization to K-means initial cluster centers [J]. Computer Engineering and Design, 2011, 32(8):2721-2723.
3. Li Zhengbing, Luo Bin, Zhai Sulan, Tu Zhengzheng.K-means Algorithm Based on Partition of correlational graph [J]. Computer Engineering and Applications,2013, 49(21): 141-144.
4. Deng Hai, Tan Hua, Sun Xin. A K-Means Clustering Algorithm of Meliorated Initial Center [J]. ComputerTechnology and Development,2013, 23(11): 42-45.
5. Zhou Weiben, Shi Yuexiang. Optimization algorithm of K-means clustering center of selection based on density [J]. Application Research of Computers.2012,29(5): 1726-1728
6. Zhao Wei-zhong, Ma Hui-fang, Fu Yan-xiang, Shi Zhong-zhi. Research on Parallel K-means Algorithm Design Based on Hadoop Platform [J]. Computer Science.2011, 38(10):166-168.
7. Ralf Lammel. Google’s MapReduce ProgrammingModel-Revisited [J].ScienceofComputerProgramming.2008, 70(1):1-30.
8. Satish NarayanaSrirama,PelleJakovits, EeroVainikko. Adapting scientific computing problems to clouds using MapReduce [J]. Future Generations Computer Systems.2012, 28(1):184-192.
9. Jiang Xiaoping, Li Chenghua, Xiang Wen, et al. Parallel implementing K-means Clustering Algorithm Using MapReduce programming mode [J]. Journal of Huazhong University of Science and Technology.2011, 39(z1):120-124.