Metal Surface Inspection for Defect Detection
and Classification using Gabor Filter
Chaitali Tikhe 1, J.S.Chitode 2
P.G. Student, Department of Electronics Engineering, Bharati Vidyapeeth Engineering College, Pune, India1 Professor, Department of Electronics Engineering, Bharati Vidyapeeth Engineering College, Pune, India2
ABSTRACT
:
Quality control is an important issue in the metallic industry. Also maintaining the rate of production with respect to time is also a major issue in metal manufacturing. Quality of metallic objects depends on its texture, shape etc. Various defects on raw metal planes like pin holes, scratches etc are difficult to detect at early stage of production with naked eyes. Time required for analysis and the accuracy will vary from person to person. For this purpose, an automatic defect detection and classification technique using enhanced Gabor filter has been proposed so that it can ensure the better quality of metal in manufacturing process as well as production rate. This automated classification method helps us to acquire knowledge about the pattern of defect within a very short period of time and so that the defected metal may not be mixed with the fresh metal.KEYWORDS
:
Quality control, Automatic defect detection, Gabor filter, production rate.I. INTRODUCTION
The rapid development in digital computer led to expansion of applications for computer vision. From those applications one of the most useful applications is to detect and classify different types of defects. Today, most of the stages during manufacturing are automated. But in metal production lines the visual inspection for various defects is done manually. The manual inspection process is not very accurate, labour intensive and tedious as it is dependent on concentration and experience of human. So the alternative is to implement the automatic defect detection and classification technique.
In production industries machine fails due to various reasons. These causes are shown in fig. 1[2]
Fig.1 Causes of Machine failure
Fig.1 shows that machine fails because of three reasons they are obsolesces, Surface degradation and accident. Among these three reasons surface degradation is due to corrosion and mechanical wear. Mechanical wear is caused by abrasion, fatigue and adhesion. From above statistical data it is proved that surface degradation is the factor that causes
Accident (15%) Machine
Failure
Obsolesces (15%)
Surface Degradation (70%)
Corrosion (20%)
Mechanical wear (50%)
stages of production. We generally found following defects in metal from existing defect detection work. These types of defects are shown in table I.
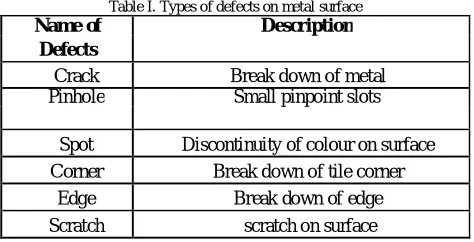
Table I. Types of defects on metal surface
Name of Description
Defects
Crack Break down of metal
Pinhole Small pinpoint slots
Spot Discontinuity of colour on surface
Corner Break down of tile corner
Edge Break down of edge
Scratch scratch on surface
The objective of our research is to propose an efficient defect detection and classification technique which will be able to find out image defects at a high rate within a very short time. The overall outline of this paper is mentioned as follows. Section II describes related work i.e. literature review Section III explains Gabor Filter. Section IV illustrates proposed algorithm using Gabor filter. Experimental results and comparison is given in section V. Finally, the conclusion is discussed in Section VI.
II. RELATED WORK
III. GABOR FILTER
Gabor filters are defined by harmonic functions i.e. sinusoidal functions modulated by a Gaussian distribution. Gabor filters have some similarity to Fourier filters, but are limited to certain frequency bands. With the help of Gabor transform we can transform the signal into time frequency domain after that signal is processed and with the inverse Gabor transform of processed signal we get the desired or result signal[4]. The Gabor transform is also termed as the Short Time Fourier Transform (STFT).
Gabor filters can also decompose the image into components corresponding to different scales and orientations. In the spatial domain, the Gabor function is a complex exponential, modulated by a Gaussian function. Its impulse response in the two-dimensional (2D) plane has the following general form:
Where, F denotes the radial frequency of the Gabor function. The space constants σx and σy define the Gaussian envelope along the x- and y-axes. This complex function has real and imaginary components as follows.
Real
Imaginary
Where
And
IV. PROPOSED APROACH
Fig.2 Flowchart of Defect Detection and classification technique
In this section, we propose a defect detection and classification technique for metal plates so that we can achieve higher defect detection rate with reduce computational time. Sequences of operation for proposed algorithm are as follows.
A .Gabor filter bank creation for multichannel filtering
The proposed algorithm is experimented on the various images of metal having defects either scratch or spot or both. Gabor filter consists of various parameters such as wavelength, bandwidth, orientation, phase offset and aspect ratio. For filtering purpose we have to decide scales and orientation of Gabor filter. According to scale of an image the wavelength and bandwidth affect the filter response. Also response of filter is affected by orientation of metal parts. Thus, we consider scale, S=3 and orientation, L=6 and obtained 18 asymmetric Gabor filters. Then we filtered every acquired image with these 18 Gabor filters. Filtered image is calculated using following equation.
Where * denotes 2D convolution.
Input Image
Gabor Filter Bank
Feature Difference Extraction
Image Fusion
Thresholding
Is defect
detected?
No
Yes
Bounding Box
Calculations Defect Classification
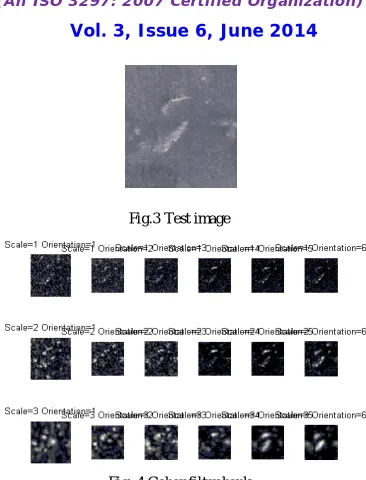
Fig.3 Test image
Fig. 4 Gabor filter bank
Fig.3 shows the test image of metal plate which is used to analysis whether defect is present on surface or not. Fig. 4 shows Gabor filter bank of above test image which is having 18 filtered images contributing 3 scales and 6 orientations.
B. Feature difference extraction
Features of the reference image I’pq(x, y) and test image I”pq(x, y) are obtained by using nonlinearity and above procedure. To locate defects in the image mean (υ’pq) and standard deviation (σ’pq) from each of these 18 images is calculated. According to this rule feature of reference image is distributed according to Gaussian distribution. Decision rule for minimum acceptance region can be given as,
Dpq(x, y) = I”pq(x, y), I”pq(x, y) –
υ
’pq ≥Γ.
σ’
pq= 0, Otherwise Where, value of Γ is selected to Γ=7.
Fig. 5 images after future difference extraction
C. Data fusion
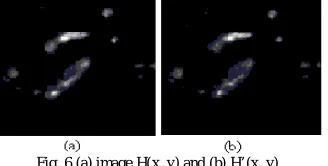
In this step we combine the pixels from difference images which are obtained in above method. This involves following steps: 1) addition of pixels of images having same scales and different orientation which create three images. 2) Take mean of resultant pixels of adjacent orientation which gives two images. Then average of these two images is computed to get a unique image H(x, y). After that image H’(x, y) having same orientation is obtained by repeating above two steps. Both the images H(x, y) and H’(x, y) are combined to get single unique image.
Fig. 6 (a) image H(x, y) and (b) H’(x, y)
Fig. 6 shows fused images obtained by using Bernoulli’s rule of combination.Fig.6 (a) is the image obtained by first adding pixels of images with same scales while (b) represents image obtained by first adding pixels of images having same orientations.
D. Thresholding
Segmentation of image is done by thresholding. The fused image has low and high energy point where defective part is represented by high energy point. Thus to suppress these low energy point which are not belonging to defect, the image is subjected to thresholding. This creates a binary image in which white pixels represents the defective portion in metal plate.
Fig. 7 Threshold image
Fig.7 represents image obtained after thresholding. Decision of whether the defect is present is taken by analysing this threshold image.
E .Defect Classification
In the first step, number of white pixels below a limit value say C are discarded from threshold image. After that component connectivity is checked. Then bounding box of all connected objects is calculated by considering rows and columns. Percentage density of bounding box is evaluatedand the decision is made by considering whether density is greater than or less than the threshold limit say T.Classification is given as follows.
If Density ≥ T, Defect is spot Else Defect is scratch.
In above image there are three spots and two scratches are detected.
V. EXPERIMENTAL RESULT
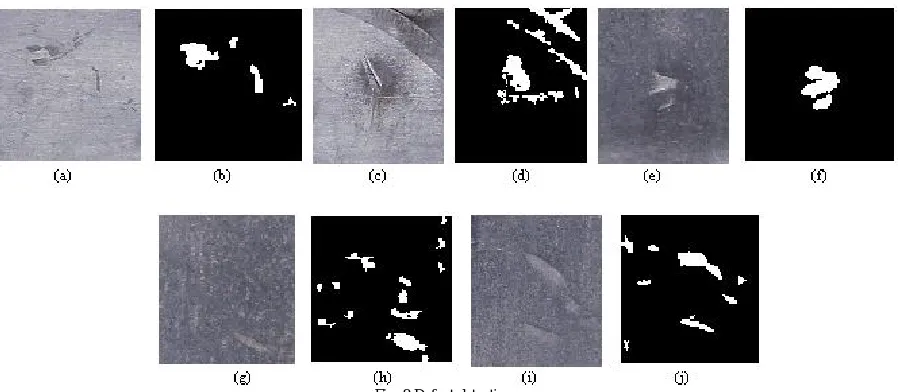
Fig. 8 Defect detection
Above Fig.8 shows the experimental results of defect detection in metal plates by using proposed algorithm. Figs (a), (c), (e), (g) and (i) represents the test images collected from different metal plates. Figs (b), (d), (f), (h) and (j) are the images obtained after applying above mentioned algorithm steps.
Comparison of percentage of defect detection of existing techniques with proposed technique is represented in table 2.
Table2. Comparison of defect detection technique
Author Method Percentage of
detection
Jagdish Lal Raheja [4]
GLCM 98.33%
Mostafa Sadeghi [3]
Gabor wavelet 90-98%
K.N.Sivabalan [5]
Gabor and Gaussian
Filter 85-93%
Rashmi S Deshmukh [6]
Feature extraction and Segmentation
90-95%
Proposed Work Gabor Filter 95-98%
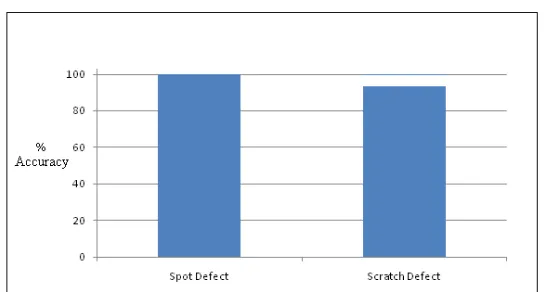
Fig. 9 Comparative spot and scratch defect detection
VI. CONCLUSION
In this paper, unsupervised defect detection method to detect spots and scratch metal defects has been proposed. The above comparison shows that accuracy of spot defect detection is greater than scratch defects. The Algorithm has the capacity to be used in various types of images. The speed of detection is increased as well as accuracy is maintained by using proposed approach. This method can be used for examining other types of materials such as plastic, wood, fabrics etc.
REFERENCES
[1] Ajay Kumar,Grantham Pang “Defect detection in texture materials using Gabor filters” IEEE transactions on industry applications, vol. 38, no. 2, march/april 2002.
[2] T. aarthi, M. karthi, M. abinesh “Detection and analysis of surface defects in metals using wavelet transform”, International Journal of Scientific and Research Publications, Volume 3, Issue 6, June 2013.
[3] Mostafa Sadeghi, Faezeh Memarzadehzavareh, “Flaws detection in steel plates Using Gabor Wavelet”, Life Science Journal, pp.352-355, 2013. [4] Jagdish Lal Raheja, Sunil Kumar, Ankit Chaudhary “Fabric defect detection based on GLCM and Gabor filter: A comparison” Elsevier 2013. [5] K.N.Sivabalan, DR.D.Gnanadurai “Efficient defect detection algorithm for gray level digital images using Gabor wavelet filter and Gaussian
Filter” International Journal of Engineering Science and Technology, Vol. 3 No. 4, pp.3195-3202, Apr 2011.
[6] Rashmi S Deshmukh Dr P R Deshmukh “Comparison Analysis for Efficient Defect Detection Algorithm for Gray Level Digital Images Using Median Filters Gabor Filter and ICA “,International Journal of Advanced Research in Computer Science and Software Engineering , Volume 2, Issue 1, January 2012.
[7] Doo- chul Choi, Yong Ju Jeon, Jong Pil Yun, “ An Algorithm for detecting seam cracks in steel plates” ,Word Academy of Science, Engineering and Technology, Vol.6, pp. 1478-1481 , December 2012.
[8] Yanfang Han, Pengfei Shi “An Adaptive level-selecting wavelet transform for texture defect detection”, Elsevier Image and Vision computing, pp.1239-1248, 2007.
[9] Yiling Chen, Tse-Wei Chen, shao-yichen “Fast texture feature extraction method based on segmentation for image retrieval” by 13th
IEEE International Symposium on consumer electronics, 2009.