© 2015, IRJET.NET- All Rights Reserved
Page 1636
Rice and Jute yield forecast over Bihar region
Sandeep K. Parbat
*, R.K. Giri
*, K.K Singh
**and A.K. Baxla
***
Meteorological centre, Patna (Bihar)-India
** India Meteorological Department, Lodi Road, New Delhi-110003- (India)
Abstract
Crop Yield forecasting (approximately one month in advance) play an important role in decision making and planning of food need in future. In this paper we have compared results of the statistical model of crop yield forecast for rice and jute crops for the year 2012-to 2014 of all districts of Bihar (for rice) and 6 districts of Bihar ( for jute). The statistical model is based on the correlation and regression approach in which weather parameters are incorporated along with technological trend at various stages of the growth of rice and jute crop. The model prediction as technological trend alone and along with weather shows considerable difference in yield productivity of rice and jute. It is seen from the study that for rice the yield departure from actual ranges -10 % to 12 % and -20 % to 35 % during the years 2012 to 2014. It has been brought out that the yield prediction model used operationally in India Meteorological Department (IMD) under the project forecasting of agriculture output using space, agro meteorology and land based observations (FASAL) shows approximately 60 % improvement after incorporated the weather data in the yield analysis. Almost similar performance has been observed for jute yield during the years 2012 to 2014. The model predicted yield results for rice and jute for the year’s 2012 to 2014 shows reasonably good agreement with the actual yield.
Key words
:
Statistical model, crop yield, jute and rice.
1.
INTRODUCTION
Early and in season crop production forecasting play an eminent role in coordination and planning of food sectors in India. The crop yield forecast based on the empirical statistical regression approach by India Meteorological Department (IMD) is done about a month before the harvesting period. The importance of weather data on crop yield is well known and affects the production.
India’s 2.4 % geographical area and 4 % water resources shares 17 % human population and 14 % livestock (State of Indian Agriculture, 2012-2013). The evolution of rice as a food crop depends primarily on the rainfall and in low rainfall areas the variability is high regardless the latitude. Spatial and temporal vulnerabilities in rice production at regional level depend on the monsoon onset, advance and withdrawal performance, especially rain fed regions. Besides all the vagaries of monsoon rainfall and variability India is the second is in second rank for rice production (DAC, Annual report, 2005-2006)The growing season of rice in dry season /wet season according to Rice Almanac (Maclean, 2003) and Siddiq (2006) for Bihar region is June –July to October –November and Mid June to October respectively. There are certain meteorological parameters like temperature; rainfall and sun shine duration which is generally responsible for the optimum growth of the rice crop. The yield predictions of the crop much before the harvesting of crop has been made for most of the crops (Rice and Jute for this work) for proper coordination and planning the activities in ministry of agriculture. India Meteorological Department (IMD) is using empirical – statistical model using step-wise correlation and multiple regression approach for crop yield forecasting under the ministry of agriculture project forecasting of agriculture output using space, agro meteorology and land based observations (FASAL).
Nearly 76 % population of the Bihar is dependent on agriculture. 53.06 lakh hectares is the net cultivated area out of 93.60 lakh hectare area. Bihar region is bounded by the humid region (West Bengal) in east and humid region Uttar Pradesh in west. The crops like rice required adequate amount of rainfall and good ground water availability in case of deficient rainfall. There are 111 rice growing countries in the world and bulk of the rice production is cantered in wet tropical climate.
© 2015, IRJET.NET- All Rights Reserved
Page 1637
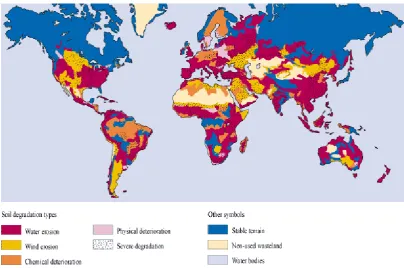
report of Global Assessment of Land Degradation (GLASOD) show that in India alone land degradation vary from 53 million ha right up to 239 million ha based on expert judgments of public authorities. The map (figure 1) adapted from the study of Oldeman et al (1991) below shows different soil degradation types around the world.Figure 1: Human induced soil degradation (Courtesy by Oldeman et al, 1991).
The uses of Jute (Corchorus capsularis L & C. olitorius L) fibbers are very much popular from ancient times (eighteenth century). Even today jute has become indispensable to almost every nation. The state of Bihar has been growing Jute in scattered pockets. In the present work 6 districts of Bihar has been chosen for predicting the yield forecast using statistical approach followed under FASAL project. Moderate rainfall, warm and humid atmosphere supports the Jute growth. During the south west (SW) monsoon season the precipitation distributed over 80 to 90 days. Strong sunshine and moderately strong wind alternating with rains are conductive to good growth except frequent or heavy rains. A crop shown during the monsoon or in a situation where weeding or thinning is required during that phase seldom gives either a uniform crop or high yield. In the current scenario the jute production is labour intensive and costly, therefore rain fed uplands of Bihar using jute based cropping system (Mitra et al, 2006). Normal jute crop cycle in Bihar ranges from March to July each year. Previous year studies conducted by India Meteorological Department (IMD) and Indian Agricultural Statistics Research Institute (IASRI) have shown ample scope for using these models during early stages of crop growth (Sarwade 1985, Agrawal et al., 1983, 1986).
2. DATA AND METHODOLOGY
© 2015, IRJET.NET- All Rights Reserved
Page 1638
The general equation of the model is (Vashisth et al, 2014, Giri et al, 2015)' '
P is the number of weather variables used
e is random error distributed as N(0,
2)3. RESULTS AND DISCUSSION
© 2015, IRJET.NET- All Rights Reserved
Page 1639
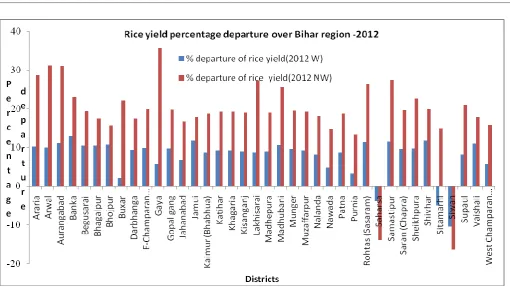
The weather variables used for analysis are given in table (1) of all the three agro climatic zones (figure 1). The regression equations obtained from the statistical analysis for all 38 districts are given in table 2 and table 3 for rice and jute crop respectively. Pre-harvesting predicted yield forecasting has been compared with the actual yield data of rice and jute with technological trend and along with weather & technological trend data. The obtained results were found satisfactory and closer to the actual yield data. The results were deviated more if we consider the technological trend alone. After inclusion of weather inputs along with the technological trend data the model shows approximately 60 % improvement for both the crops. Table 2 and 3 shows that the significant contributory variables are rainfall and temperature and in some cases relative humidity also contributed. Figures (2 to 7) indicates yield departures of rice and jute for the years 2012 to 2014. The model has run till 2014 weather data. In the figures, 2 to 7, W indicates the output based on weather and NW indicated without weather results. These results are very useful in future planning in the light of sustainability or management of food security for the country.4. CONCLUSIONS
The crop yield results of rice and jute obtained after the statistical –regression model run (data used till 2014) shows that:
(1) Model predicted yield with weather and technological trend analysis agrees reasonably well with actual yield data for both rice and jute.
(2) Technological trend results have been improved nearly 60 % with weather data.
(3) Pre-harvesting yield prediction can be taken as a pre-cursor for future planning of food grains and important input for ministry of agriculture.
ACKNOWLEDGEMENT
Authors are grateful to Director General of Meteorology for data and financial support under FASAL project. The contribution of meteorological centre Patna staff duly acknowledged.
© 2015, IRJET.NET- All Rights Reserved
Page 1640
Figure 2: Rice yield departure (actual –model predicted) for the year -2012
© 2015, IRJET.NET- All Rights Reserved
Page 1641
Figure 4: Rice yield departure (actual –model predicted) for the year -2014
© 2015, IRJET.NET- All Rights Reserved
Page 1642
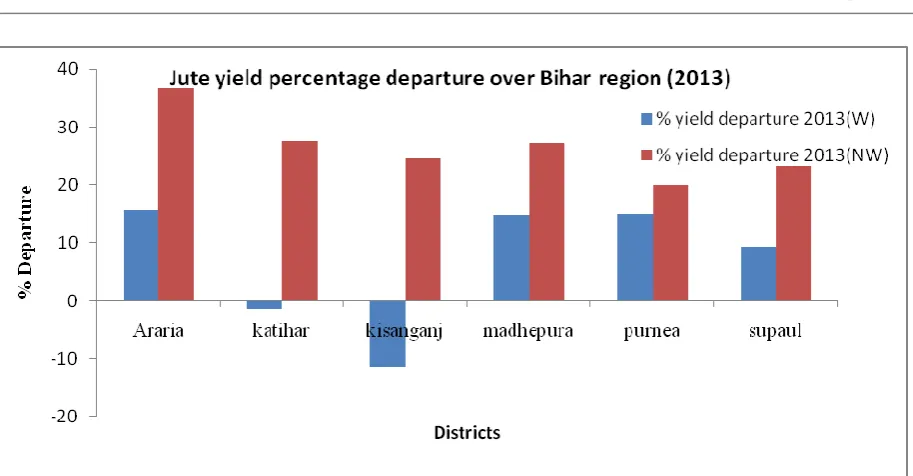
Figure 6: Jute yield percentage departure (actual –model predicted) for the year -2013
Figure 7: Jute yield percentage departure (actual –model predicted) for the year -2014
Table 1
:
Variables used in development of statistical modelsSymbols Description Symbols Description
Z11 Weighted coefficients for Tmax Z140 Un-weighted coefficients for Tmax*RH-I
Z10 Un-weighted coefficients for Tmax Z151 Weighted coefficients for Tmax*RH-II
Z21 Weighted coefficients for Tmin Z150 Un-weighted coefficients for Tmax*RH-II
© 2015, IRJET.NET- All Rights Reserved
Page 1643
Z31 Weighted coefficients for Rain Z230 Un-weighted coefficients for Tmin*Rain
Z30 Un-weighted coefficients for Rain Z241 Weighted coefficients for Tmin*RH-I
Z41 Weighted coefficients for RH-I Z240 Un-weighted coefficients for Tmin*RH-I
Z40 Un-weighted coefficients for RH-I Z251 Weighted coefficients for Tmin*RH-II
Z51 Weighted coefficients for RH-II Z250 Un-weighted coefficients for Tmin*RH-II
Z50 Un-weighted coefficients for RH-II Z341 Weighted coefficients for Rain*RH-I
Z121 Weighted coefficients for Tmax*Tmin Z340 Un-weighted coefficients for Rain*RH-I
Z120 Un-weighted coefficients for
Tmax*Tmin Z351 Weighted coefficients for Rain*RH-II
Z131 Weighted coefficients for Tmax*Rain Z350 Un-weighted coefficients for Rain*RH-II
Z130 Un-weighted coefficients for Tmax*Rain Z451 Weighted coefficients for RH-I*RH-II
Z141 Weighted coefficients for Tmax*RH-I Z450 Un-weighted coefficients for RH-I*RH-II
© 2015, IRJET.NET- All Rights Reserved
Page 1644
Table 2
: District –wise Rice crop yield equations over Bihar regionS.No. District Regression equations Weather
element
% deviation with actual yield
2012 2013 2014
1 Araria 1524.6+z131*252.21+time*54.6 Tmax*Ra
in 10.21 11.14 8.97
2 Arwal 115.85+z341*0.49
Rain*RH-I 9.94 10.61 10.30
15 Kaimur 1148.3-z30*8.13+z41*46.42
Tmax,rh-I,rain 8.82 11.00 -4.16 16 Katihar -206.52+time*73.11+z231*1.93
© 2015, IRJET.NET- All Rights Reserved
Page 1645
26 patna -141.55+z241*1.85+time*51.23
Tmin*rh-I 8.76 10.19 5.28
27 purnea 1494.63+time*52.45+z241*.924
Tmin*rh-I 3.36 -3.08 6.81 33 sivhar 996.85+time*37.71 time
11.86 10.84 -9.23
35 siwan 1052.29+time*75.4+z231*9.83 Tmin*rai
© 2015, IRJET.NET- All Rights Reserved
Page 1646
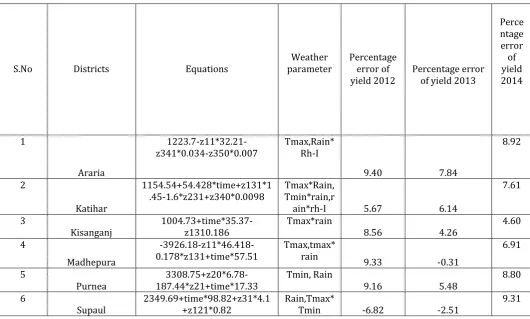
Table 3:
District –wise Jute crop yield equations over Bihar regionREFERENCES
[1] Agrawal, R., Jain, R.C. and Jha, M.P. (1983). Joint effects of weather variables on rice yields., Mausam, vol. 34, pp 189-194. [2] Agrawal, R., Jain, R.C. and Jha, M.P. (1986). Models for studying rice crop- weather relationship. Mausam, vol. 37, pp 67-70
[3] Annual Report 2005-2006. Department of Agriculture and Cooperation, Ministry of Agriculture, Government of India, 130 p
© 2015, IRJET.NET- All Rights Reserved
Page 1647
[4] Giri, R.K., Pradhan, Devendra, Sen, A.K and Parbat, S.K., (2015). Role of weather parameters in crop yield forecasting of wheat over Bihar region, International journal of latest research in engineering and Science, 1,1,11-20.
[5] Maclean, J. L., Dawe, D. C., Hardy, B., and Hettel, G. P. (2003). Rice almanac. Third edition. Los Ban˜os, Philippines.
[6] Mitra, Sabyasachi, Maiti, S. N. and Sarkar, Sitanshu. 2006. Recommendations for jute and allied fibre crops : An endeavour of All India Network Project. p.28, CRIJAF, Barrackpore, Kolkata
[7] Oldeman, L.R. Hakkeling, R.T.A., Sombroek, W.G. (1991). World Map of the Status of Human-Induced Soil Degradation: An Explanatory Note‚ UNEP and ISRIC‚ Wageningen.
[8] Siddiq, E. A. (2006). Field crops: Rice. In Handbook of Agriculture, pp. 817–844. Indian Council of Agricultural Research, New Delhi
[9] Sarwade, G.S. (1985). Crop yield forecast of paddy and wheat. Presented at International WMO/FAO/IMD Workshop on Application of operational techniques in Agrometeorology, at Pune.
[10] State of Indian Agriculture, 2012-2013: A report Ministry of Agriculture, Department of Agriculture and Cooperation, Directorate of Economics and Statistics, New Delhi
[11] Vashisth, Ananta., Singh, R., and Choudary ,Manu., (2014). ‘Crop Yield Forecast at Different Stage of Wheat Crop Using Statistical Model under Semi Arid Region, Journal of Agroecology and Natural Resource Management, 1 (1), 1-3
[12] WMO (1966). WMO Technical Note No.79, WMO No. 195-TP100, WMO, Geneva, pp.79.