Theses and Dissertations
2015
Tp53 and Hras Influence on HPV16 E7 Expression
in HPV16-Transformed Human Keratinocytes
Nella Christie Delva
University of South Carolina - Columbia
Follow this and additional works at:https://scholarcommons.sc.edu/etd
Part of theBiology Commons
This Open Access Thesis is brought to you by Scholar Commons. It has been accepted for inclusion in Theses and Dissertations by an authorized administrator of Scholar Commons. For more information, please [email protected].
Recommended Citation
Tp53 and Hras Influence on HPV16 E7 Expression in
HPV16-Transformed Human Keratinocytes
by
Nella Christie Delva
Bachelor of Science Barry University, 2012
Submitted in Partial Fulfillment of the Requirements
For the Degree of Master of Science in
Biological Sciences
College of Arts and Sciences
University of South Carolina
2015
Accepted by:
Lucia Pirisi-Creek, Director of Thesis
Bert Ely, Reader
David Reisman, Reader
©Copyright by Nella Christie Delva, 2015 All Rights Reserved.
08
DEDICATION
ACKNOWLEDGMENTS
First and foremost I’d like to thank GOD for giving me the courage and
determination to stay and continue with this journey. Secondly, I’d like to thank my
Mentor and PI, Dr Bert Ely and Dr Lucia Pirisi-Creek, respectively. This journey hasn’t
been easy and it wouldn’t have been possible if I didn’t have such amazing mentoring
and support. I would also like to acknowledge my beautiful family for being my biggest
supporter, especially my sister who has been there with me through the ups and downs.
Last but not least, thank you to my lab members who guided me through my
research project Maria Hosseinipour, Yvon Woappi, Christian Graves and Fadi Abboodi.
I also want to thank Ariana Renrich with whom I started this project. I am very grateful to
have been a member of this amazing lab-crew.
“The difference between a successful person and others is not a lack of strength, not a
lack of knowledge, but rather a lack of will.”
ABSTRACT
Head and Neck Squamous Carcinoma (HNSCC) is one of the most common
cancers worldwide. HNSCC affects regions of the upper aerodigestive tract such as the
lip, tongue, nasopharynx, oropharynx, larynx, and hypopharynx. About 25% of all
HNSCC cases and up to 65% of Oropharyngeal Carcinoma (OPC) cases are positive for
HPV DNA. African American patients, especially males, present primarily with
HPV-negative HNSCC. HNSCC’s that are HPV-positive tend to be HPV-active at initial
presentation: these cancers contain HPV DNA and express HPV RNA. However,
recurring HPV-positive cancers of the head and neck are more often inactive: these
tumors contain HPV DNA, but do not express viral mRNA. Previous gene expression
profiling results identify a gene expression signature of HPV-inactive tumors that is
“intermediate” between HPV-active and HPV-negative cancers. This study focuses on
the molecular characteristics of HPV-inactive tumors and the molecular mechanisms by
which these tumors may lose E6 and E7 oncogene expression. E6 and E7 are viral
oncogenes whose expression drives cells to proliferate indefinitely and lose sensitivity to
senescence and growth arrest mechanisms (immortalization). Our hypothesis is that
tumors that are HPV-inactive began as HPV-active lesions, where tumor cells lost
expression of E6/E7 by either mutation or epigenetic mechanisms or both. In these
tumors, the growth promoting effects of E6/E7 should be replaced by mutations of
mechanisms by which HPV-transformed cells can escape the need for continuous E6/E7
expression for proliferation. In order to explore our hypothesis, we have developed two
specific aims: 1) to determine whether mutated H-Ras (H-RasV12) expression results in
changes in E7 mRNA and Rb protein levels in HKc. Our results indicate that H-RasV12
partially replaces E7 function. 2) To determine whether p53 knock-down by the means of
an shRNA can be achieved in Human Keratinocyte lines transformed with HPV16
(HKc/HPV16) and their respective HKc/DR cells lines, and to assess the effect of p53
TABLE OF CONTENTS
Dedication ... iii
Acknowledgements ... iv
Abstract ...v
List of figures ... ix
List of abbreviations ...x
Chapter 1: Introduction ...1
1.1. Head and neck cell carcinoma ...1
1.2. Human Papillomavirus (HPV) ...3
1.3. P53 and RB pathway in HPV-mediated carcinogenesis ...6
1.4. Rational and Hypothesis ...9
1.5. Aims ...13
1.6. Broader Impact ...13
Chapter 2: Materials and Methods ...14
2.1. Cell culture ...14
2.2. Skin processing ...14
2.3. Transforming competent cells ...16
2.4. Making Lb agar plates ...17
2.5. Cloning p53 shRNA ...17
2.7. Transfection ...19
2.8. Puromycin selection ...20
2.9. UV treatment ...20
2.10. Gel Collection and Protein extraction ...21
2.11. Bradford Assay ...21
2.12. Elisa (PathScan® Sandwich ELISA Kit) ...22
2.13. RNA extraction ...22
2.14. cDNA Synthesis (iScript Kit) ...23
2.15. Real time PCR...24
Chapter 3: Results ...25
3.1. Preliminary work ...25
3.2. Aim 1 ...31
3.3. Aim 2 ...34
Chapter 4: Discussion ...44
LIST OF FIGURES
Figure 1.1, Head and neck cancer regions ...1
Figure 1.2 Papilloma virus life cycle ...5
Figure 1.3, Mechanisms of oncogene activation: point mutation; the Ras story ...8
Figure 1.4, Results of genes ontology analysis of microarray ...10
Figure 1.5, Possible mechanisms for the acquisition of independence from E6/E7 ...12
Figure 2.6, In vitro model of HPV16-mediated carcinogenesis ...16
Figure 3.7. Hairpin structure schematic ...26
Figure 3.8, pSuper.retro puro map ...27
Figure 3.9, Purification of digested plasmid DNA (pSuper.retro puro) ...28
Figure 3.10, pBabe puro HrasV12 map ...29
Figure 3.11, DNA extraction Gel ...30
Figure 3.12: RT/q-PCR results for E7 levels HKc16/D-1++ HRas transfected cell line ...32
Figure 3.13, ELISA Rb levels in HKc/HPV16d-1 cells transfected with HRas ...33
Figure 3.14, p53 ELISA results in normal HKc ...35
Figure 3.15, p53 ELISA results in HKc/HPV16 non-transfected UV treated cells ...36
Figure 3.16. p53 ELISA results in HKc/HPV16 non-transfected UV treated cells ...37
Figure 3.17, Tp53 ELISA results in the HKc/HPV16d-1 cell line (D1++) ...39
Figure 3.18, UV treated HKc/HPV16 cell morphology ...40
Figure 3.20, UV treated HKc/DR cell morphology ...42
LIST OF ABBREVIATIONS
BPE ... bovine pituitary extract
cDNA ... complementary DNA
CM ... complete medium
DNA ... deoxyribonucleic acid
DR ... differentiation resistant keratinocytes
EGF ... epidermal growth factor
HKc ... Human keratinocytes
HKc/DR ... differentiation resistant, HPV16-transformed human keratinocytes
HKc/HPV16 ... human keratinocytes immortalized with HPV16 DNA
HKc/HPV16d-1... human keratinocytes from donor 1 immortalized with HPV16 DNA
HNSCC ... head and neck squamous Carcinoma
HPV... Human papillomavirus
H-Ras ... Harvey Ras
L1, L2 ... late open reading frames of papillomavirus
P53i ... pSuper.p53
PBS ... phosphate buffered saline
PCR ... polymerase chain reaction
PV ... papillomavirus
RT-PCR... real time polymerase chain reaction
URR ………...upstream regulatory region
CHAPTER 1: INTRODUCTION
1.1 Head and neck cell carcinoma
Head and Neck Squamous Carcinoma (HNSCC) is the 6th most common cancer
worldwide. HNSCC begins in the squamous cells that line the moist surfaces inside the
head and neck (1); it affects regions of the upper aerodigestive tract such as the lip,
tongue, nasopharynx, oropharynx, larynx, and hypopharynx. Nearly 50,000 new cases of
HNSCC are diagnosed in the United States every year, and there are around 10,000
deaths annually; it accounts for ~4% of all malignancies worldwide and 5% mortality of
all cancers (1).
The important risk factors associated with HNSCC include tobacco use, alcohol
use (1, 2), human papillomavirus infection (HPV) and Epstein-Barr virus (EBV) (3). The
incidence of HPV-negative HNSCC, which is mostly associated with smoking and
alcohol consumption, has decreased by about 50% in the last 30 years, while the
incidence of HPV-associated HNSCC has increased by a concerning 225% (4,5). It was
also shown that HPV-associated head and neck cancers had better prognosis and
Figure 1.1. Head and neck cancer regions. The location of paranasal sinuses, nasal cavity, oral cavity, tongue, salivary glands, larynx and pharynx (including oropharynx, hypopharynx and nasopharynx) is shown.
1.2 Human Papillomavirus (HPV)
Papillomaviruses (PVs) are members of the Papillomaviridae family (8). PVs
have small circular double stranded DNA genomes of approximately 8000 base pairs and
icosahedral capsids (9). PVs have a unique characteristic of well-adapting biological
behavior in a specific host, for example HPV virus follows the differentiation
programming of its host keratinocytes (reference). PVs are in both humans and animals
and can be transmitted only through close cutaneous contact with infected exfoliated skin
cells or muco-mucosal contact (10). PV genomes encode five proteins and are divided
into three main regions: 1) the noncoding upstream regulatory regions (URR) which
regulates viral gene expression. 2) The early region (E1, E2, E4, E5, E6, and E7) is
critical for virus replication, oncogenesis and survival; E1 and E2 influence the
replication cycle and transcription while the E4 protein contributes to the genome
amplification efficiency. E5, E6 and E7 proteins maintain a key role in cellular growth
regulation. 3) The late region (structural L1 and L2) encodes viral capsid proteins. This
late region contains the L1 opening reading frame (ORF) and also is the most conserved
amongst all papilloma virus types (10).
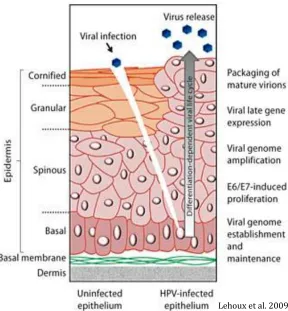
1.2.1 HPV infection
Although HPV infections are mostly subclinical, some of those subclinical
infections can become clinical and may develop into tumors (11). The process of HPV
by expression of early response genes (E1, E2, E4, E5, E6 and E7). The expression of
these genes allows viral genome replication. Replication then moves to the upper cell
layer and starts to differentiate (11). The expression of late genes, L1 and L2, as well as
E4, is followed. L1 and L2 encapsidate the viral genomes to form progeny virions in the
nucleus. The shed virus can then initiate a new infection, which in turn can cause HPV
lesions arisen from the proliferation of infected basal keratinocytes. In addition,
Low-grade intraepithelial lesions support productive viral replication (12).
Human papillomavirus (HPV) is the most common sexually transmitted infection
(15). When HPV infection persists, it can produce precancerous lesions that may develop
into invasive cancers. HPV has been found to be associated with many types of cancer
including: cervical, vulvar, vaginal, penile, anal, and oropharyngeal (back of the throat,
including the base of the tongue and tonsils). Although there are over 200 types of HPV
that have been identified only 40 types are oncogenic (13,16), HPV16 is one of the most
causative agents leading to invasive cancers, it was also found be associated with
Lehoux et al. 2009.
1.3 P53 and RB pathway in HPV16-mediated carcinogenesis
Tp53 is tumor suppressor gene that plays an important role in cell cycle and
apoptosis. It is also called the “guardian” of the genome. The p53 protein transactivates a
number of proteins with functions in cell cycle arrest and apoptosis (17). On the other
hand, the tumor suppressor protein retinoblastoma (pRb) controls the expression of genes
involved in cell cycle progression (18). These two tumor suppressor genes were found to
have strong association with various type of cancer including HNSCC.
In the case of HPV16-mediated carcinogenesis, the tumors are driven by the E6
and E7 viral oncoproteins (19, 20). E6 and E7 are viral oncogenes whose expression
drives cells to proliferate indefinitely and lose sensitivity to senescence and growth arrest
mechanisms (immortalization) (20, 21). E6 binds and degrades the p53 protein (22, 25),
causing the cells to continue proliferating even in the presence of stressors or DNA
damage. E7 disrupts the interaction between Rb and E2F and promotes the degradation
of Rb. E7-mediated degradation of Rb frees up E2F to stimulate DNA replication and
eventually cell division (23, 24, 26). Therefore, HPV hijacks cell cycle regulatory
pathways and allows cells with damaged DNA to continue to grow and replicate.
Mutations of p53 and Rb pathways alone can increase replication potential and cause
immortalization (28). A number of studies have shown that different cancers showed the
presence of p53 mutations (69.8% of HNSCC) (29) however, in HPV-mediated cancers,
p53 function is just deactivated by E6 and mutations of p53 are rare. p53 function can
also be inactivated by other mechanisms such as overexpression or amplification of
cyclin D1 associated with reduced survival (29). pRb can also be inactivated through the
inactivation of the tumor-suppressive CDKN2A gene (targeted earlier in the HNSCC
carcinogenesis). pRb mutations, however, are not very common in HNSCC, with about
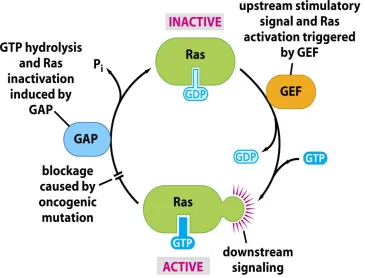
7-9% mutation and copy number losses in 20–30% of cases (32). Instead, the H-RAS
gene is significantly mutated in head and neck squamous cell carcinomas (HNC) and is a
putative oncogenic driver (34). Oncogenic Ras mutations cause the protein to be
perpetually active in the GTP-bound state resulting in increased proliferation and survival
signaling (34). When looking at all human cancers, KRas mutations (part of the Ras
family) are the most common type of Ras mutation (34), HRas being the least common.
In addition, Oncogenic HRas mutations have been specifically found on codons 12, 13,
61. Conversely, in HNSCC, Ras mutations appear to be exclusively H-Ras mutations
(35).
1.4 Rationales and Hypothesis
Previous studies indicated that African American (AA) patients develop
HPV-negative Head and Neck Squamous Carcinomas (HNSCCs) more frequently than do
European American (EA) patients (36, 37). It was also found that HPV in AA HNSCC
patients is most often inactive, meaning that the tumors are positive for viral genomic
DNA, but they do not express transcripts encoding E6 and E7 oncoproteins (37). About
25% of all HNSCC cases, and up to 65% of Oropharyngeal Carcinoma (OPC) cases are
positive for HPV DNA. African American patients, especially males, present primarily
with HPV-negative HNSCC, and we have found that those that are HPV-positive by
HNSCC’s that are HPV-positive tend to be HPV-active at initial presentation,
whereas HPV-positive recurring cancers of the head and neck are more often inactive
(36). Previous gene expression profiling results identify a gene expression signature of
HPV-inactive tumors that is an “intermediate” between HPV-active, positive for viral
DNA and expressing E6 and E7 transcripts and HPV-negative cancers where viral DNA
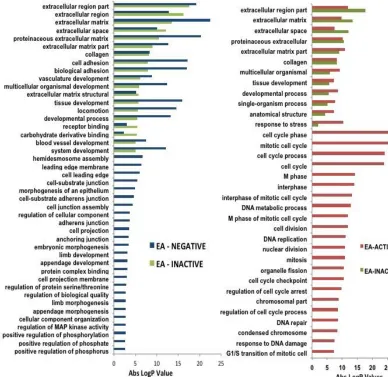
is not present nor express E6 and E7 (36,37). The gene oncology analysis below (a
former graduate student project) clearly shows that HPV-inactive tumors lack the cell
cycle/mitosis/proliferation signature typical of HPV-active tumors. HPV-inactive tumors
share many but not all the features of HPV-negative tumors, lacking changes in a whole
class of pathways including cell projections, leading edge, adherens junctions. This
difference supports our statement that the signature of HPV-inactive tumors is
intermediate between that of HPV-active and HPV-negative.
Our hypothesis is that tumors that are HPV-inactive began as HPV-active lesions,
where tumor cells lost expression of E6/E7 by either mutation or epigenetic mechanisms
or both. In these tumors, the growth promoting effects of E6/E7 should be replaced by
mutations of relevant key genes. For example, E6 function could be replaced by
homozygous deletion or mutation of p53; E7 function could be replaced by active ras.
This project aims at uncovering specific molecular mechanisms by which
10
Figure 1.4. Results of gene ontology analysis of
Since HPV-inactive tumors were found to have very distinct gene expression
signatures from those of HPV-positive and HPV-negative tumors, this project is
exploring TP53 and H-Ras mutation profiles of HNSCC in HPV inactive patients in order
to determine their clinical and genetic characteristics. Characterizing the molecular
profile of HPV-positive inactive tumors can greatly improve our understanding of the
growth and progression of HPV16-mediated HNSCCs.
This study focuses on the molecular characteristics of HPV-inactive tumors and
the molecular mechanisms by which these tumors may lose E6 and E7 oncogene
expression (figure 4). We reason that in cancer cells, E6 function could be replaced by
homozygous deletion or mutation of p53; and E7 function could be replaced by active
ras. Part of our efforts will be to show that these changes often occur in cultured
HPV16-transformed cells, to provide proof of principle for this concept. We will also study
HNSCC samples to determine whether mutations of p53 and/or Ras are more frequent in
HPV-inactive tumors. These mutations are extremely rare in HPV active HNSCC.
1.5 Aims
Based on the above hypothesis, we have developed the 2 specific aims. First, to
determine whether mutated H-Ras (H-RasV12) expression results in changes in E7 and
Rb expression levels in different HKc/HPV16. Second, To determine whether p53 can be
knock-down by the means of an shRNA out Human Keratinocyte lines transformed with
HPV16 (HKc/HPV16) and HKc/DR lines. These studies are meant to provide
justification for a comprehensive mutation analysis of HNSCC specimens that will allow
us to determine which mutations are associated with the HPV-inactive group, in
12
Figure1.5 Possible mechanisms for the acquisition of independence from E6/E7 by HNC cells.
HPV + Tumors (Inactive)
Express viral DNA however does not express viral transcript E6 & E7
Degradation of p53 and prevents growth arrest and/or apoptosis. Normally… E2F pRb pRb E7 E2F E7 Facilitates Mediated expression of cellular proteins necessary for S-phase entry
p53 E6 An increase in p53 takes
place during cell damage in order to cause a decrease in proliferation and induce apoptosis.
HPV infected cells continue to proliferate.
Ras
p53
Possible mechanism #1:
Mutated HARasV12 essentially
takes the place of E7 in the cell cycle entry process.
Normally…
Possible Mechanism #2: Homozygous deletion and/or methylation of p53 “replace” E6 function.
1.6 Broader Impacts
The discovery that HPV-inactive HNSCC arise as HPV-active lesions, if
confirmed by in vitro and ex vivo studies, would show that HPV-inactive cancers
constitute a molecular and pathogenetic group of their own, distinct not only from
HPV-active but also from HPV-negative tumors. If HPV-inHPV-active cancers begin as HPV-HPV-active,
these cancers may be amenable to prevention with the HPV vaccines. In addition, there is
a large body of controversial literature about the possible role of HPV in other cancers,
such as the breast, the esophagus and the lung (to name a few). Currently, HPV DNA
found in these tumors is interpreted as a mere passenger without a role in the
development of those cancers. However if HPV-transformed cells can be mutated in such
a way as to become independent of E6/E7 in the head and neck, perhaps the same
mechanisms may operate at other sites. Therefore, these findings would lead to a
complete revision of the role of HPV (and the potential preventive value of HPV
CHAPTER 2: MATERIALS AND METHODS
2.1 Cell culture
The HKc/HPV16d-1 (Pirisi et al., 1987) transformed cell line was used
throughout this project. Cells were taken out of the liquid nitrogen container and plated
on 100-mm tissue culture plate with Keratinocyte Serum Free media (KSFM). The plate
was placed in incubator (37 degrees Celsius). After plating, cells were fed the following
day and wash every 48 hours until 80% confluence. Cells were again allowed to grow
once more to 80% confluence before transfection, UV treatment or protein extraction.
2.2 Foreskin processing
Normal HKc cells were isolated from neonatal foreskins using the following
protocol. Foreskins were rinsed under sterile conditions in a wash vial containing
MCDB153-LB (home made medium) basal media. Excess connective tissue and fat were
removed from the dermis using a scalpel. Foreskins were incubated overnight in
incubator (37 degrees Celsius) dermis side down, in 10% dispase. The epidermis was
separated from the dermis with a pair of forceps in a 100 mm Petri dish. The epidermis
was then trypsonized , spun down and plated in a 100 mm cell culture dish using in 5 ml
of complete medium . Cells were collected by centrifugation in a clinical centrifuge,
speed 3 for 1 minute and speed 2 for 4 minutes. Cells pellet was re-suspended and plated
PBS and fed once more with 15 ml of CM then incubated in a humidified atmosphere of
95%air/5%CO2. Cells were fed fresh CM every 48 hour until cells reached 80%
confluence.
In order to knock-down p53 and overexpress H-Ras in the HPV16-transformed
cell lines the following procedures were performed:
2.3 Transforming competent cells
The following materials were prepared: Water bath was equilibrated to 42 degrees
Celsius, S.O.C medium and LB medium were warmed to room temperature, and
Selective plates (100ug/ml ampicillin in LB Agar) were warmed in a 37 degree incubator
for 30 minutes.
One vial of Shot TOP10 (Invitrogen) chemically competent cells for each
transformation was allowed to thaw on ice. 100 ng of DNA was added into a vial of One
Shot cells and mixed gently. The vials were then incubated on ice for 30 minutes. The
cells were heat-shocked for 30 seconds at 42 degree Celsius, and then put back on ice for
2 minutes. 250 ul of pre-warned S.O.C medium was added to each vial. The vial was
capped tightly and shaken horizontally at 37 degree Celsius for 1 hour at 225 rpm in a
shaking incubator. 200 ul from each transformation was spread a pre-warmed selective
Figure 2.6. In Vitro model of HPV16-Mediated Carcinogenesis. HKc cells are isolated from neonatal foreskins transfected with HPV16 plasmid DNA. HKc/HPV16 immortalized cells grew in the MCDB152-LB medium containing epidermal growth factor (EGF) and bovine pituitary extract (BPE) for proliferation. The derived HKc/GFI are selected in media containing high calcium (>0.3mM) and fetal bovine serum, giving rise to differentiation resistant cells (HKc/DR). HKc/DR when transfected with activated ras or HSV2 or SIX1 into nude mice, these HKc/DR cells developed into tumors.
Normal Human Keratinocytes (HKc)
Transfected with HPV16 DNA
Immortalized HKc (HKc/ HPV16
Remove EGF and BPE
Growth factor Independent (HKc/GFI)
Serum or High Ca++
Differentiation Resistant HKc (HKc/DR)
Transfect with activated ras or HSV2 Inject into nude mice
TUMORS
2.4 Making LB agar Plates
250 mL of distilled water was measured and 25 grams of premix LB agar powder
(VWR DF0445-17) was weighed and mixed well into solution. The total volume of the
mix was brought to 500 mL with distilled water, and the solution was transferred to a 1L
flask. This flask was put on a stirring hot plate and allowed to boil for 1 minute while
stirring. The solution was transferred to 1L Pyrex jar and labeled with autoclave tape.
The 1L Pyrex jar was autoclaved at liquid setting for 20 minutes. After agar had cooled
down to about 55-degree Celsius, 25 ml of ampicillin (5 mg/ml) was added to the flask.
Lastly, 20 ml of agar+amp was added to each 100 mm plates under the hood, and left to
cool. The LB agar+amp plates were stored at +4 degree Celsius for later use.
2.5 Cloning p53 shRNA
P53 shRNA top strand
GATCCCCTTGGCAGCCAFACTGCCTTTTCAAGAGAAAGGCAGTCTGGCTGCCAATTTT
TA
P53 shRNA bottom strand
AGCTTAAAAATTGGCAGCCAGACTGCCTTTTCTCTTGAAAAGGCAGTCTGGCTGCCA
AGGG
Briefly, the general steps in utilizing a pSUPER.retro vector include annealing the
forward and reverse strands for the shRNA (shown above). Second, linearize the
annealed oligonucleotides into the vector; transform competent bacteria with the resulting
ligation mix, selecting and amplifying colonies that contain the desired construct.
Annealing the forward and reverse strands: The oligonucleotides were dissolved
in nuclease free H2O to a concentration of 3 ug/mL. The annealing reaction was
assembled by mixing 1 ul of each oligo (forward and reverse) with 48 ul of annealing of
annealing buffer. This mixture was incubated at 90 degree Celsius for 4 min and at 70
degree Celsius for 10 minutes. The annealed oligonucleotide was cooled slowly to 10
degree Celsius and stored at -20 degree Celsius. Second step of linearizing the vector
(pSUPER.retro): 1 uL of the pSUPER.retro vector was linearized with BglII and HindIII
restriction enzymes. The plasmid was first digested with HindIII overnight, followed by a
second overnight digestion of BglII. The reaction was then heat inactivated, and the
resulting DNA was separated by electrophoresis on a 1.1 % agarose gel. The band
representing the pSuper plasmid with BglII/HindIII ends was purified as described below.
2.6 Gel Purification of pSuper plasmid with BglII/HindIII end
QIAquick Gel Extraction Kit was used to purify plasmid DNA. After digestion of
plasmid DNA with HindIII and BglII, the resulting fragments were separated by
electrophoresis on a 1.1% agarose gel, which was then stained with ethidium bromide.
The DNA band was excised from the gel under long-wave UV light using a razor blade.
The gel slice containing the DNA band of interest was cut into smaller pieces and placed
into an Eppendorf tube. A volume of 400 ul of solution 1, equal to 3-fold the weight of
the agarose sliced, was added to the agarose. The agarose was dissolved by incubation
(provided in the kit) was added for collection of the plasmid DNA. The contents were
shaken for 15 minutes at room temperature. After centrifugation (1,000 x g for 10
minutes) pellets were collected. Supernatant was discarded and re-suspension of pellet
using NaI Followed. The sample was centrifuged once more, then the pellet was
re-suspended in 1 ml of new wash. This solution was transferred to a clean and sterile
Eppendorf tube. This washing procedure was repeated multiple times. DNA was then
eluted from the glass milk by re-suspension in distilled H2O. The suspension was
centrifuged and the supernatant containing the DNA was transferred into a sterile
Eppendorf tube.
Ligation into pSUPER.retro vector: The cloning reaction was assembled by
adding 2 uL of the annealed oligonucleotide to 1 uL of T4 DNA ligase buffer. Followed
by addition of 1 uL of the digested pSUPER.retro vector, 5uL nuclease-free H2O and 1
uL T4 DNA ligase. This mixture was incubated overnight at room temperature. After
cloning and prior to transformation, plasmids were treated with BglII (1ul) and incubated
for 30 minutes at 37 degrees Celsius to eliminate the vector that would have
re-circularized, as the BgLII site was destroyed in the recombinant plasmid, but not in the
re-circularized vector. The plasmid was then transformed into bacteria (E. coli), followed
by transfection of our DNA plasmid in HKc/HPV16d-1 cells lines.
2.7 Transfection
Once the HKc/HPV16d-1 cells plated in 6-well plated reached 70-80%
medium (KFSM) as recommended by the manufacturer. P53i-sh was also diluted in
transfection medium. Lipofectamine 3000 and plasmid were then gently mixed (1:1
ratio). The mixture was incubated for 5 minutes. 250 ul of this DNA-lipid complex was
added to the cells and incubated for 6 hours at 37 degrees Celsius in a humidified
atmosphere of 95%air/5%CO2. Cells were then fed fresh KSFM, added to each well
without removing the transfection mix.
2.8 Puromycin selection
After transfection (24hours post) , 2 mL of KSFM medium containing 3ug/mL of
puromycin was added to each well containing transfected cells, which were then
incubated for an additional 24 hours. The medium was replaced with CM media and
colonies were observed closely for several days until all non-transfected cells died, and
transfected cells were ready to be collected for further analysis.
2.9 UV light treatment
Cells were allowed to grow until about 70-80% confluent at 37-degree Celsius.
Cells were first washed using PBS and, while the cell culture dishes were left uncovered
under the hood, the UV light was turned on for a short 30 seconds. CM medium was
added back to the cells and dishes were put back into the incubator at 37 degree Celsius
in a humidified atmosphere of 95%air/5%CO2 for various times (1h, 3h, 6h and 12h).
2.10 Cell collection and Protein extraction
CM media was aspirated when cells reached 80% confluence. After removal of
media, 3 ml of 0.5 % of trypsin was added to the 100 mm dishes. The dishes were put
back in the 37-degree Celsius incubator for 3 minutes or until cells were completely
detached then 500 ul of FBS was added to the detached cell trypsin mixture, to inactivate
the trypsin. The detached cells were then transferred to a 15 ml tube and centrifuged (in a
clinical centrifuge) for minutes.
Once the cell pellets was collected, 300ul of RIPA buffer (containing protease
inhibitors) was added to each tube. The samples were then incubated on ice for 5
minutes. The cell were re-suspended and lysed by vortex-ing. After transfer of mixture to
a 1.5ml tube, the samples were centrifuged at 8,000x g for 10 minutes. Supernatant with
cell lysate was transferred to a new tube. Protein quantification was later performed to
these samples.
2.11 Bradford Assay
The standard protocol was performed in In a 250 μl microplate assay. The 1x dye
reagent was removed from 4°C storage and allowed to be warmed to ambient
temperature. The 1x dye reagent was inverted a few times before use. 2-mg/ml
gamma-globulin standard was used. The following volumes were used 5ul of the standard in each
well, 5ul of sample in each well and 190ul of 1x dye reagent in each well using
disposable cuvette. Protein solutions were assayed in triplicate. For convenience, 6
water and dye reagent. The samples were mixed using a microplate mixer. The plate was
incubated at room temperature for 5 min. the spectrophotometer was set to 595 nm and
absorbance of the standards and samples was measured.
2.12 ELISA (PathScan® Sandwich ELISA Kit)
The required microwell strips were allowed to reach room temperature. Cell
lysates was diluted with Sample Diluent (supplied in each PathScan® Sandwich ELISA
Kit) to a set protein concentration. Addition of 100 µl diluted cell lysate to each well.
The strips were then incubated overnight at 4°C. The strips were washed 4 times with 1X
Wash Buffer using 200 µl (wash procedure) each time. After each wash, the strips were
stroked on fresh towels in order to remove the residual solution in each well. 100 µl of
reconstituted Detection Antibody (green color) was added to each well. The strips were
incubated once more at 37°C for 1 hr. The “wash procedure” was repeated once more,
followed by the Addition of 100 µl of reconstituted HRP-Linked secondary antibody to
each well followed by incubation for 30 min at 37°C and “wash procedure”. After
removal of reconstituted HRP-Linked secondary antibody, wells were again washed
followed by the addition of 100 µl of TMB Substrate to each well. The strips were
incubated for 10 min at 37°C or 30 min at 25°C, then 100 µl of STOP Solution was
added to each well. Absorbance was then measured at 450 mm.
2.13 RNA Extraction
RNA was extracted using RNeasy mini kit (Qiagen) with the manufacturer’s
of Buffer RLT to the cell tube. The tubes were vortexed or pipetted for proper mixture.
The lysates were homogenized accordingly by pipetting the lysate directly into a
QIAshredder spin column placed in a 2 ml collection tube, and centrifuged for 2 min at
full speed. 1 volume of 70% ethanol was added to the homogenized lysate, and mixed
well by pipetting. The total volume of 700 μl of each sample was transferred from
previous step, including any precipitate that may have formed. A volume of 700 μl Buffer
RW1 was added to each RNeasy spin column. The flow-through is collected in the base.
An additional volume of 500 μl Buffer RPE was added to each RNeasy spin column.
Flow-through was again collected in the base. 500 μl Buffer RPE was added to each
RNeasy spin column. The flow-through was once more collected in the base. Each
column was placed in a 2 ml collection tube, centrifuged at full speed for 1 min. Each
RNeasy spin column was placed in a new 1.5 ml collection tube were I Added 30–50 μl
RNase-free water directly to each spin column membrane. Centrifuged for 1 min at
_8000 x g (_10,000 rpm) to elute the RNA. The Collected RNA eluent was stored in -80
degree Celsius freezer.
2.14 cDNA Synthesis (iScript Kit)
The following items were added to a small Eppendorf tube for a total volume of 20
ul: Master mix recipe (20 ul total): 4 ul of 5x iScript reaction kit; 1 ul iScript reverse
transcriptase; 4 ug/ul of RNA template and nuclease free water. The mixture was then
vortexed, spun down and run cDNA was synthesized in a minicycler using iScript
incubation scheme: 5 minutes at 25 degrees Celsius, 30 minutes at 42 degrees Celsius, 5
minutes at 85 degrees Celsius, with an optional hold at 4 degree Celsius. Samples was
diluted with 130 ul of RNF H2O and stored at -20 degree Celsius.
2.15 Real time PCR
cDNA was used for this Real time PCR reaction. Using iQ SYBR green supermix
(Bio-Rad), 25 ul of iQ SYBR green supermix was used per sample, with varied forward
and reverse primer volume and varied RNF H2O for a total volume to 45 ul per reaction.
cDNA samples were boiled for 2 minutes after 5 ul of cDNA was added to the respective
wells of a 96-well Bio-Rad PCR plate along with 45 ul of master mix. Samples were run
in triplicates. The plate was then sealed and centrifuged for 1 minute at 2000 rpm.
The Bio-Rad iCycler used for this PCR reaction was at 8.5 min at 95 degree
Celsius followed by 50 cycles of 95 degree Celsius for 30 seconds, 55 degree Celsius for
30 seconds and 97 degree Celsius for 30 seconds. Completion of amplification with a 30
second cycle at 58 degree Celsius, 10 minutes at 72 degree Celsius and a hold at 4 degree
CHAPTER 3: RESULTS
3.1 Preliminary work
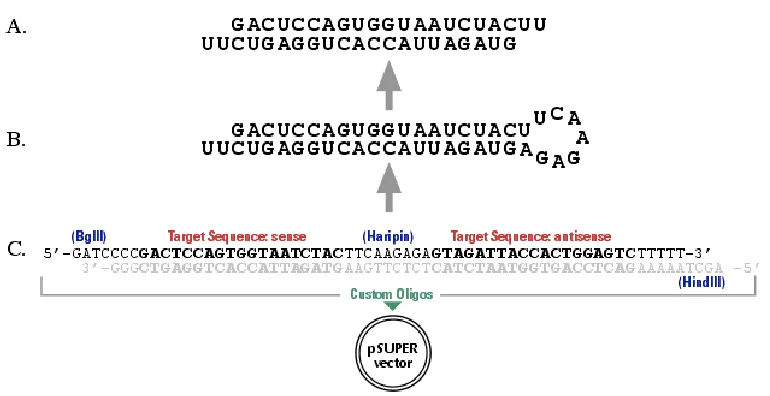
RNA interference approach was used in order to knockdown Tp53. The
pSuper.p53 vector was used, this vector includes a 19-nucleotide sequence from the
target mRNA (both sense and antisense orientation), separated by a short 9-nucleotide
spacer sequence, shown in the figure below.
Using the forward and reverse p53i-sh sequence, the following schematic
transcript of the recombinant vector was made. This RNA product is predicted to fold
Figure 3.7. Hairpin structure schematic
Designed sequence:
p53i-sh top strand:
GATCCCCTTGGCAGCCAGACTGCCTTTTCAAGAGAAAGGCAGTCTGGCTGCCAATTTTT
p53i-sh bottom strand:
AGCTTAAAAATTGGCAGCCAGACTGCCTTTTCTCTTGAAAAGGCAGTCTGGCTGCCAAGGG
Once our DNA plasmid was ready to use, I proceeded in cloning the p53i-sh RNA
into the following vector (pSuper.retro puro), following the appropriate protocol.
\
Figure 3.8 pSuper.retro puro map. PGK promoter: 2766-3164, Puro ORF: 3179-3778, H1 promoter: 2430-2650, Ampicillin resistance ORF: 6367-5501, 3’ delta LTR: 3848-4201, 5’ LTR: 7293-513 (homologous to other MSCV LTR), Stuffer Sequence: 1447-2423
Figure 3.9. Purification of digested plasmid DNA (pSuper.retro puro) DNA plasmid was successfully digested (linearization) with HindIII and BglII (restriction enzymes). The band representing the double-cut DNA plasmid was selectively cut out of the gel and extracted for cloning.
Sample 1 Sample 2 Sample 3
pSuper.retro puro plasmid
Plasmid: 6349bp
6,000 5,000 3,000
The DNA plasmid pBabe puro H-rasV12 was ordered from Addgene. The DNA
map of this plasmid is shown in Figure 8.
pBabe puro HrasV12 plasmid Ladder
Colony 2 uncut
Colony 2 cut
Colony 3 uncut
Colony 3
cut Plasmid = 5811 bp
BamHI = 5117 bp
6,000 5,000 3,000
Figure 3.11. DNA extraction Gel.
3.2 Aim 1
To determine whether mutated H-Ras (H-RasV12) expression results in changes
in E7 and Rb expression levels in different HKc/HPV16 and HKc/DR lines different assay
was performed to measure Rb and E7 protein levels.
HKc/HPV16d-1 cells were transfected with mutated H-Ras, then RNA and
protein were collected for RT/PCR for E7 and ELISA for Rb, assays using
HKc/HPV16d-1 non-transfected as controls. We observed a significant decrease in E7
mRNA expression in the H-RasV12 transfected HKc/HPV16d-1 cells as compared to the
non-transfected cells lines (Figure 12). As expected, this decrease in E7 expression was
accompanied by a marked increase in Rb protein levels detected by ELISA in cell lysates
from H-rasV12-expressing HKc/HPV16d-1, compared to their controls (Figure 13),
0 2 4 6 8 10 12
D1++ not transfected D1++ HRas
RTq-PCR E7 levels in HKc/HPV16 transfected cells
0 0.05 0.1 0.15 0.2 0.25 0.3 0.35
D1++ not transfected D1++ HRas
ELISA Rb levels in D1++ cells transfected with HRas
Figure 3.13. Rb levels in HKc/HPV16d-1 (D1++) cells transfected with H-Ras and their non-transfected control
Absor
ba
nc
e 450mn
3.3 Aim 2
To determine whether p53 can be knock-down by the means of an shRNA in
Human Keratinocyte lines transformed with HPV16 (HKc/HPV16) and HKc/DR lines.
3.3.1UV treatment results
First, in order for the cells to produce sufficient amount of p53 protein, normal
human keratinocytes (HKc) and HKc/HPV16 were stressed using UV light in order to
induce p53 protein production. The cells were given some time to recover with fresh CM
medium after the UV treatment (1, 3, 6 and 12 hours). p53 protein levels were first
measured via ELISA in normal (HKc) as a control. The graph below (figure 14) shows
the result of p53 ELISA after UV treatment in HKc. In UV treated cells, we can make
better comparisons in p53 protein levels between the following groups: HKc non-treated,
HKc 1 hour after treatment and HKc 12 hours after treatment. HKc/HPV16 cell lines p53
ELISA after UV treatment graphs are also shown below (figure 15 and 16). HKc/HPV16
non-transfected cell lines, early passage number (figure 15), did not respond to UV
treatment until 12 hours, where we noticed a slight increase in p53 proteins levels.
However, later passage HKc/HPV16 non-transfected cell lines (Figure 16) did not have a
0 0.5 1 1.5 2 2.5
Normal UV normal (1hour) UV normal (12hour)
A
bsorba
n
ce 4
50
mm
HKc/Normal
0 0.2 0.4 0.6 0.8 1 1.2 1.4 1.6
Normal D1++ D1++ 3hUV D1++ 6hUV d1++ 12hUV
A
bsorba
n
ce 4
50
mm
HKC/HPV16 D1 NON-TRANSFECTED, p53 ELISA
0 0.2 0.4 0.6 0.8 1 1.2 1.4 1.6
normal D1++ D1++ 1hUV D1++ 3hUV D1++ 6hUV D1++ 12UV
Abs
or
ba
nce
45
0mm
HKc/HPV16 NON-TRANSFECTED, p53 ELISA
3.3.2 Human Keratinocyte lines transformed with HPV16 (HKc/HPV16) and
HKc/DR lines
I wanted to determine whether p53 can be knock-down by the means of an
shRNA in Human Keratinocyte lines transformed with HPV16 (HKc/HPV16) and
HKc/DR lines. Therefore, I performed a p53 ELISA in our HKc/HPV16 transfected with
p53i-sh cell line (and their respective controls), additionally we treated them with UV to
induce p53 production. Figure 15 shows the results of a p53 ELISA comparing p53 levels
in HKc/HPV16d-1 (D1++) to normal HKc and to D1++ transfected with p53shRNA. As
compared to control normal HKc, the HKc/HPV16d-1 cell line expresses significantly
lower level of p53 protein. In HKc/HPV16d-1 transfected with p53i-sh (D1++
non-transfected, non UV) we observe even lower p53 proteins levels. However after UV
treatment, the HKc/HPV16d-1 cell lines transfected with p53i-sh still show a surprising
ability to increase expression of p53, which returns to almost the same level of protein
observed in our control (HKc), but does not reach the expression levels triggered by UV
0 0.1 0.2 0.3 0.4 0.5 0.6 0.7 0.8 0.9
A
bso
rban
ce
45
0m
n
HKc/HPV16 D1, P53 Elisa
Figure 3.17. Tp53 ELISA results in the HKc/HPV16d-1 cell line (D1++). The bar graph is listed as follows (left to right) HKc (normal), HKc/HPV16 D1 (non-transfected and non-UV treated), HKc/HPV16 D1 (non-transfected with p53i-sh (non-UV treated), HKc/HPV16 D1 transfected with p53i-sh (1hour after UV treatment), HKc/HPV16 D1 transfected with p53i-sh (3hour after UV treatment), HKc/HPV16 D1 transfected with p53i-sh (6hour after UV treatment), HKc/HPV16 D1 transfected with p53i-sh (12hour after UV treatment) respectively.
Looking at the morphology of HKc/HPV16 cells transfected with p53i-sh after
UV treatment, we notice that the cells are very responsive to UV treatment, as early as 1
hour after UV.
Figure 3.18 UV treated HKc/HPV16 cell morphology. The HKc cell line with no UV treatment has a more elongated shape and adhere better to cell culture plate as compared to UV treated cell line which were less adherent to the cell culture plate and cell shape were more rounded. In addition, it was noticed that the more prolonged the recovery time, the higher the percentage of cell death.
No UV 1h after UV
3h after UV 6h after UV
Differentiation resistant (HKc/DR) cells lines were transfected with p53i-sh and
UV treated. The cells were shown to have
0 0.2 0.4 0.6 0.8 1 1.2 1.4 1.6
normal D1DR p53i
ang D1DR 1hUV D1DR 3hUV D1DR 6hUV D1DR 12hUV
Abs or ba nce 45 0mm
P53 Elisa for D1DR cells transfected
with p53i-sh
D1DR-p53i sh UV treated
Looking at the morphology of HKc/DR cells transfected with p53i-sh after UV
treatment, we notice that the cells are more resistant to UV treatment. Morphological
changes due to UV treatment is not noticed until 6 and 12 hour after UV.
No UV 1h after UV
6h after UV
12h after UV 3h after UV
Furthermore, an ELISA assay was done in order to detect a difference in p53
protein levels in the HKc/HPV16 D1 transfected with mutated HRAs using the ELISA
assay (Figure 22). Surprisingly, HKc/HPV16d-1 cells transfected with H-RasV12 showed
lower levels of p53, as compared to their non-transfected controls. As expected,
HKc/HPV16 D1 non-transfected had much lower p53 protein expression as compared to
the normal (HKc).
0 0.2 0.4 0.6 0.8 1 1.2 1.4 1.6
normal D1++ D1++ HRAS V12
Abs or ba nce 45 0mm
p53 ELISA in HKc/HPV16d-1 cells
transfected with HRas
CHAPTER 4 DISCUSSION
We noticed in the data shown above that p53 levels were at least ten-fold higher
in normal HKc than in HKc/HPV16d-1 not exposed to UV. This difference is to be
attributed to the fact that in HKc/HPV16, E6 promotes p53 degradation; hence the
steady-state levels of p53 are much lower. Transfection with the p53shRNA plasmid
decreases steady-state p53 levels even more (D1++angp53i Transfected). When treated
with UV, the p53i-transfected HKc/HPV16 cells show a further decrease in p53 levels
after one hour, and a delayed increase at 6 h. However, at 12 hours after UV treatment,
the levels of p53 in D1++angp53i Transfected cells are still lower than those in untreated
normal HKc. As shown in figure 11, HPV16 E7 mRNA levels decreased by about 2/3 in
HKc/HPV16d-1 transfected with H-RasV12. This may indicate that H-RasV12 is
partially “replacing” E7 function. To confirm that E7 expression was indeed decreased in
these cells, we performed an ELISA for Rb. As expected, the Rb ELISA shows a marked
increase in Rb protein levels in the HKc/HPV16d-1 cells transfected with H-RasV12.
This indicates that E7 function is at least partially lost in these cells, and Rb is no longer
being degraded or at least not to the same extent as in non-transfected HKc/HPV16d-1.
As I previously mentioned, HARasV12-transfected HKc/HPV16 express lower
levels of HPV16 E7 (figure 12), and E7 function appears to be decreased as well, because
Rb protein levels rise (figure 13). This finding supports the notion that E7 function may
proliferation. HKc/HPV16, and HKc/HPV16 expressing an shRNA against p53, exhibit
some residual ability to respond to UV treatment with an induction of p53 (figure 18).
Accordingly, UV treatment produces visible damage in these cells. HKc/DR appear to be
more resistant than HKc/HPV16 to UV treatment, exhibiting only minor (if at all)
increases in p53 levels. Thus, morphological evidence of cells death in UV treated
HKc/DR is observed only 12h after treatment and not earlier (figure 20). These are
interesting observations that warrant full characterization of the UV responses of
HPV-transformed cells at early and late stages of progression. P53 levels decrease slightly in
HKc/HPV16 transfected with HRasV12(figure 21): this could be due to the decrease of
E7 levels and activity, as E7 is known to stabilize p53. More work is needed to determine
the levels of E6 and E7 in p53shRNA-expressing HKc/HPV16 and HKc/DR, to
conclusively provide proof of principle for our hypothesis
Future Work
The results shown above are encouraging. However, we need to demonstrate
positively that H-Ras is expressed in the transfected cells, and also investigate how H-Ras
cells grow: we have observed slower growth in H-RasV12-transfected cells than in their
parental cell line, but we need to actually measure their growth rate. We presume that the
decrease in E7 mRNA expression would be accompanied by a decrease in E6, as E6 and
E7 messages derive from the same polycistronic mRNA, and in order to produce E7 cells
must splice out most of E6. With less E6, there is more p53 to go around, and cells are
presume that this may be the mechanism that slows down growth in
H-RasV12-transfected cells, but we need to demonstrate that this is (or is not) the case.
Additionally, we should assess the effects of the combined expression of p53
shRNA and H-RasV12 on E6/E7 expression in HKc/HPV16 and HKc/DR lines by
co-transfection of p53 and H-Ras12in HKc/HPV16 cells lines. Using this approach will help
us to assess if HKc/HPV16 and HKc/DR lines can become more independent on E6/E7
activities for proliferation. Additional efforts should be dedicated to exploring the
mechanisms by which HRas signaling leads to decreased expression of E7 in
HKc/HPV16, as well as, exploring the effects of knocking out p53 using CRISPR instead
REFERENCES
1. Jemal A, Bray F, Center MM, Ferlay J, Ward E, Forman D. Global cancer statistics.
CA Cancer J Clin 2011;61:69–90.
2. Curado MP, Boyle P. Epidemiology of head and neck squamous cell carcinoma not
related to tobacco or alcohol. Curr Opin Oncol 2013;25:229–34.
3. Smith EM, Ritchie JM, Summersgill KF, Hoffman HT, Wang DH, Haugen TH,
Turek LP. Human Papillomavirus in Oral Exfoliated Cells and Risk of Head and
Neck Cancer. JNCI J Natl Cancer Inst 2004;96:449–55.
4. Malloy KM, Ellender SM, Goldenberg D, Dolan RW. A survey of current practices,
attitudes, and knowledge regarding human papillomavirus–related cancers and
vaccines among head and neck surgeons. JAMA OtolaryngologyHead & Neck Surg
2013;139(10):1037–42
5. Ramqvist T, Dalianis T. Oropharyngeal cancer epidemic and human papillomavirus.
Emerg Infect Dis 2010;16:1671–7.
6. Bouvard V, Baan R, Straif K, Grosse Y, Secretan B, Ghissassi F El,
Benbrahim-Tallaa L, Guha N, Freeman C, Galichet L, Cogliano V. A review of human
carcinogens—Part B: biological agents. Lancet Oncol 2009;10:321–2.
7. Boscolo-Rizzo P, Del Mistro A, Bussu F, Lupato V, Baboci L, Almadori G, DA
Mosto MC, Paludetti G. New insights into human papillomavirus-associated head and
8. Braakhuis BJM, Brakenhoff RH, Meijer CJLM, Snijders PJF, Leemans CR. Human
papilloma virus in head and neck cancer: the need for a standardised assay to assess
the full clinical importance. Eur J Cancer 2009;45:2935–9.
9. Nichols AC, Dhaliwal SS, Palma D a, Basmaji J, Chapeskie C, Dowthwaite S,
Franklin JH, Fung K, Kwan K, Wehrli B, Howlett C, Siddiqui I, et al. Does HPV type
affect outcome in oropharyngeal cancer? J Otolaryngol Head Neck Surg 2013;42:9.
10. Bernard H-U, Burk RD, Chen Z, van Doorslaer K, zur Hausen H, de Villiers E-M.
Classification of papillomaviruses (PVs) based on 189 PV types and proposal of
taxonomic amendments. Virology 2010;401:70–9.
11. Favre M. Structural polypeptides of rabbit, bovine, and human papillomaviruses. J
Virol 1975;15:1239–47.
12. De Villiers E-M, Fauquet C, Broker TR, Bernard H-U, zur Hausen H. Classification
of papillomaviruses. Virology 2004;324:17–27.
13. Bienkowska-Haba M, Sapp M. The cytoskeleton in papillomavirus infection. Viruses
2011;3:260–71.
14. Walboomers JM, Jacobs MV, Manos MM, Bosch FX, Kummer JA, Shah KV,
Snijders PJ, Peto J, Meijer CJ, Muñoz N; Jacobs; Manos; Bosch; Kummer; Shah;
Snijders; Peto; Meijer; Muñoz (1999). "Human papillomavirus is a necessary cause of
invasive cervical cancer worldwide". J. Pathol. 189 (1): 12–
9.doi:10.1002/(SICI)1096-9896(199909)189:1<12::AID-PATH431>3.0.CO;2-F. PMID 10451482.
15. Cardesa A, Nadal A. Carcinoma of the head and neck in the HPV era. Acta
16. De Villiers E-M. Cross-roads in the classification of papillomaviruses. Virology 2013;
17. 17.Levine AJ1, Oren M.The first 30 years of p53: growing ever more complex. Nat
Rev Cancer. 2009 Oct;9(10):749-58. doi: 10.1038/nrc2723
18. .Rotgers E1, Rivero-Müller A2, Nurmio M1, Parvinen M2, Guillou F3, Huhtaniemi I4,
Kotaja N2, Bourguiba-Hachemi S5, Toppari J1. Retinoblastoma protein (RB) interacts
with E2F3 to control terminal differentiation of Sertoli cells. Cell Death Dis. 2014
Jun 5;5:e1274. doi: 10.1038/cddis.2014.232.
19. Howie HL, Katzenellenbogen RA, Galloway DA. Papillomavirus E6 proteins.
Virology 2009;384:324–34.
20. McLaughlin-Drubin ME, Münger K. The human papillomavirus E7 oncoprotein.
Virology 2009;384:335–44.
21. Baker CC, Phelps WC, Lindgren V, Braun MJ, Gonda MA, Howley PM. Structural
and transcriptional analysis of human papillomavirus type 16 sequences in cervical
carcinoma cell lines. J Virol 1987;61:962–71.
22. Schwarz E, Freese UK, Gissmann L, Mayer W, Roggenbuck B, Stremlau A, zur
Hausen H. Structure and transcription of human papillomavirus sequences in cervical
carcinoma cells. Nature 1985;314:111–4.
23. Gage JR, Meyers C, Wettstein FO. The E7 proteins of the nononcogenic human
papillomavirus type 6b (HPV-6b) and of the oncogenic HPV-16 differ in
retinoblastoma protein binding and other properties. J Virol 1990;64:723–30.
24. Münger K, Werness BA, Dyson N, Phelps WC, Harlow E, Howley PM. Complex
formation of human papillomavirus E7 proteins with the retinoblastoma tumor
25. Scheffner M, Werness BA, Huibregtse JM, Levine AJ, Howley PM. The E6
oncoprotein encoded by human papillomavirus types 16 and 18 promotes the
degradation of p53. Cell 1990;63:1129–36.
26. Dyson N, Howley PM, Münger K, Harlow E. The human papilloma virus-16 E7
oncoprotein is able to bind to the retinoblastoma gene product. Science
1989;243:934–7.
27. Münger K, Baldwin A, Edwards KM, Hayakawa H, Nguyen CL, Owens M, Grace M,
Huh K. Mechanisms of human papillomavirus-induced oncogenesis. J Virol
2004;78:11451–60. 122
28. Moody C a, Laimins L a. Human papillomavirus oncoproteins: pathways to
transformation. Nat Rev Cancer 2010;10:550–60.
29. Vogelstein B, Lane D, Levine AJ. Surfing the p53 network. Nature 2000; 408: 307–
310.
30. Kandoth C, McLellan MD, Vandin F, Ye K, Niu B, Lu C et al. Mutational landscape
and significance across 12 major cancer types. Nature 2013; 502: 333–339
31. Agrawal N, Frederick MJ, Pickering CR, Bettegowda C, Chang K, Li RJ et al. Exome
sequencing of head and neck squamous cell carcinoma reveals inactivating mutations
in NOTCH1. Science 2011; 333: 1154–1157.
32. Stransky N, Egloff AM, Tward AD, Kostic AD, Cibulskis K, Sivachenko A et al.
The mutational landscape of head and neck squamous cell carcinoma. Science 2011;
333: 1157–1160
34. Pylayeva-Gupta, Y., Grabocka, E. & Bar-Sagi, D. RAS oncogenes: weaving a
tumorigenic web. Nat. Rev. Cancer 11, 761–774 (2011)
35. Rampias T, Giagini A, Siolos S, Matsuzaki H, Sasaki C, Scorilas A, Psyrri
A2.RAS/PI3K crosstalk and cetuximab resistance in head and neck squamous cell
carcinoma. Clin Cancer Res. 2014 Jun 1;20(11):2933-46.
36. Weinberger et al.Characterization of HPV and host genome interactions in primary
head and neck cancers. Proc Natl Acad Sci U S A. 2014 Oct 28;111(43):15544-9. doi:
10.1073/pnas.1416074111. Epub 2014 Oct 13.
37. Tomar, S. Differential Gene Expression Pattern in HPV-positive and HPV-negative
Oropharyngeal Carcinoma. (Doctoral thesis). Retrieved from ProQuest Dissertations