Volume 96– No.12, June 2014
A Study of the Effect of Color Quantization Schemes for
Different Color Spaces on Content-based Image
Retrieval
Moheb R. Girgis
Department of Computer Science Faculty of Science Minia University, El-Minia, Egypt
Mohammed S. Reda
Department of Computer Science Faculty of Science Minia University, El-Minia, Egypt
ABSTRACT
Color spaces, color histograms, histogram distance measurements, size and quantization play an important role in retrieving images based on similarities. This paper presents a study of the effect of color quantization schemes for different color spaces (HSV, YIQ and YCbCr) on the performance of content-based image retrieval (CBIR), using different histogram distance measurements (Histogram Euclidean Distance and Histogram Intersection Distance). For the purpose of this study, a CBIR system that implements two content-based image retrieval algorithms has been developed. The first algorithm is based only on the color feature, while the second one is based on combination of the color and texture features. The color histogram is used for image color feature extraction and Haar wavelet transform is used for image texture feature extraction. The WANG image database, which contains 1000 general-purpose color images, has been used in the experiments of this study. The experimental results show which histogram distance measurement is best, which color space gives better retrieval precision, and the best quantization schemes for the considered color spaces, when using only the color feature, and when using a combination of the color and texture features.
General Terms
Content-Based Image Retrieval, Image Processing.
Keywords
Histogram-based image retrieval, Color quantization, Color spaces, Precision, Histogram similarity measures.
1.
INTRODUCTION
Content-based image retrieval (CBIR) is a technique that uses visual image features (color, texture and shape) to retrieve desired images from a large collection of images in a database. These features are extracted directly from the image using specific tools and then stored on storage media. The search in this case is based on a comparison process between the features of the query image and those of the images in the database. CBIR is an important alternative and complement to traditional text-based image searching and can greatly enhance the accuracy of the information being returned. The color feature is one of the most reliable and easier visual features used in image retrieval. It is robust to background complications and is independent of image size and orientation [1]. A lot of techniques available for retrieving images on the basis of Color similarity from image database [2]. Texture is also a powerful low-level feature for image
retrieval. It can be used in combination with the color feature to improve the image retrieval performance [3].
Color spaces, color histograms, histogram distance measurements, size and quantization play an important role in retrieving images based on similarities. This paper presents a study of the effect of color quantization schemes for different color spaces (HSV, YIQ and YCbCr) on the performance of content-based image retrieval, using different histogram distance measurements (Histogram Euclidean Distance and Histogram Intersection Distance). In this study, modified versions of two content-based image retrieval algorithms, Color Histogram Algorithm and Wavelet-Based Color Histogram Algorithm, proposed by Singha and Hemachandran [4], have been used. The color histogram is used for image color feature extraction and Haar wavelet transform is used for image texture feature extraction. The first algorithm is based only on the color feature, while the second one is based on combination of the color and texture features. The WANG image database, which contains 1000 general-purpose color images, has been used in the experiments of this study. The experimental results show which histogram distance measurement is best, which color space gives better retrieval precision, and the best quantization schemes for the considered color spaces, when using only the color feature, and when using a combination of the color and texture features.
The paper is organized as follows: Section 2 describes the color feature, the color spaces used in the study, color quantization, and color histogram. Section 3 describes the texture feature and Haar wavelet transform, which is used for image texture feature extraction. Section 4 describes the histogram distance measurements used in the study, namely, Histogram Euclidean Distance and Histogram Intersection Distance. Section 5 presents the steps of the modified versions of the Color Histogram and Wavelet-Based Color Histogram Algorithms. Section 6 describes the CBIR performance evaluation measure used in the study, namely, the Precision. Section 7 describes the developed CBIR system, and presents the experimental results of the study. Section 8 presents the conclusion of this research work.
2.
COLOR FEATURE
is one of the most commonly used color feature representation in image retrieval. The original idea to use histogram for retrieval comes from Swain and Ballard [7], who realized the power to identify an object using color is much larger than that of a gray scale.
2.1
Color Spaces
A color space is defined as a model for representing color in terms of intensity values [8]. Typically, a color space defines a one- to four-dimensional space. A color component, or a color channel, is one of the dimensions. A color dimensional space (i.e. one dimension per pixel) represents the gray-scale space. The following models are commonly used in color image retrieval systems.
2.1.1
RGB Color Space
The RGB (Red, Green, Blue) color space is the most used color space for computer graphics. The RGB color space is composed of the primary colors Red, Green, and Blue. It is an additive color model as the lights red, green, and blue are combined to create other colors.
2.1.2
HSV Color Space
HSV (Hue, Saturation, Value) color space is much closer to human eye perception of color [9], but is perceptually not uniform [10]. The components of this color space are: Hue, Saturation, and Value, based on the artists (Tint, Shade, and Tone). The coordinate system is a hexacone. The hue represents the chromatic component in this color space and it is the definition of a color by the combination of the primary colors. Saturation refers to the predominance of a particular hue in a color. The value of a color refers to the intensity (the lightness or the darkness of the color).
2.1.3
YIQ Color Space
The YIQ color space is developed for television broadcasting. The Y signal represents the luminance of a pixel and is the only channel used in black and white television. I and Q components for YIQ are the chromatic components. The YIQ system is intended to take advantage of human color-response characteristics. The eye is more sensitive to changes in the orange-blue (I) range than in the purple-green range (Q) - therefore less bandwidth is required for Q than for I. The YIQ color space is not perceptually uniform. Perceptually uniform means that a change of the same amount in a color value should produce a change of about the same visual importance.
2.1.4
YCbCr Color Space
The YCbCr color space was developed as part of ITU-R BT.601 during the development of a world-wide digital component video standard. YCbCr represents color as brightness and two color difference signals. The Y component represents the intensity of the light. The Cb and Cr components indicate the intensities of the blue and red components relative to the green component. This color space exploits the properties of the human eye. The eye is more sensitive to light intensity changes and less sensitive to hue changes. When the amount of information is to be minimized, the intensity component can be stored with higher accuracy than the Cb and Cr components. The JPEG file format makes use of this color space to throw away unimportant information. [11]
2.2
Color Space Quantization
A color quantization is a process that reduces the number of distinct colors used in an image. The intention of color quantization is that the new image should be as visually similar as possible to the original image. For a true color
image, the number of the kind of colors are up to 224 = 16777216, so the direct extraction of color feature from true color will lead to a large computation. In order to reduce the computation, without a significant reduction in image quality, some representative color is extracted, to represent the image, thereby reducing the storage space and enhancing the process speed [12].
A quantization scheme is determined by the color model and the segmentation (i.e., split up) of the color model used. Usually color models represent a color in the form of tuples (generally of three). By applying a standard quantization scheme to a color model, each axis is divided into a certain number of fractions. When the axes are divided into k, l, and m parts, the number (n) of the colors used to represent an image will be: n= k.l.m. A quantization of color model in n colors is often referred to as an n-bins quantization scheme. The segmentation of each axis depends on the used color. [13] The effect of color quantization on the performance of image retrieval has been reported by many authors in [14] [15] [16] and [17], with different quantization schemes, like RGB (8X8X8), Lab (4X8X8), HSV (16X4X4), Lu*v* (4X8X8).
2.3
Color Histogram
A color histogram represents the distribution of colors in an image, through a set of bins, where each histogram bin corresponds to a color in the quantized color space used. A color histogram for a given image is represented by a vector:
H = {H[0], H[1], H[2], H[3], … , H[i], … , H[n]} where i is the color bin in the color histogram and H[i] represents the number of pixels of color i in the image, and n is the total number of bins used in the color histogram. Each pixel in an image will be assigned to a bin of a color histogram. In the color histogram of an image, the value of each bin gives the number of pixels that has the same corresponding color. The normalized color histogram will be calculated as follows:
H' = {H'[0], H'[1], H'[2], H'[3], …, H'[i], …, H`[n]} where H'[i] = , and p is the total number of pixels of an image [18].
3.
TEXTURE FEATURE
Texture is a powerful low-level feature for image retrieval. Texture can be defined as an attribute representing the spatial arrangement of the grey levels of the pixels in a region or image [19]. The common known texture descriptors are Wavelet Transform [20], Gabor filter [21], Co-occurrence Matrices [22], and Tamura features [23]. Wavelet Transform, which decomposes an image into orthogonal components, has been used because of its better localization and computationally inexpensive properties [24] [25].
3.1
Wavelet Transformation
Volume 96– No.12, June 2014
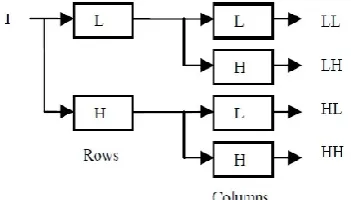
DWT for an image as a 2D signal can be derived from a 1D DWT, implement 1D DWT to every rows then implement 1D DWT to every column. Any decomposition of a 2D image into wavelet involves four sub-band elements representing LL (Approximation), HL (Vertical Detail), LH (Horizontal Detail), and HH (Diagonal Detail), respectively, as shown in Figure 1.
Figure 1: Discrete Wavelet Sub-band Decomposition
The Haar wavelet transform [28] is a discrete wavelet transform, which provides temporal resolution i.e. it captures both frequency and spatial information. The Haar wavelets speed up the wavelet computation to decompose the image into the three detailed sub bands (HL, LH, and HH), and the approximation image (LL), which can be decomposed further. The Haar wavelet's mother wavelet function (t) can be described as:
and its scaling function (t) can be described as:
4.
HISTOGRAM SIMILARITY
MEASURES
An image can be represented by a color histogram, defined by a quantization scheme of color applied to a color model. In order to express the similarity of two histograms in a digital asset, a metric distance is employed. In literature, a wide variety of distance measures between histograms have been defined. The most commonly distance measures used, and which have therefore been used in this study, are the following.
4.1
Histogram Euclidean Distance
The Euclidean Distance [18] between two color histograms h and g is given by:
dE(h, g) = 2 (1)
where M is the number of bins. In this distance formula, there is only comparison between the identical bins in the respective histograms. Two different bins may represent perceptually similar colors but are not compared cross-wise. All bins contribute equally to the distance.
4.2
Histogram Intersection Distance
The color histogram intersection distance [18] between two histograms h and g is given by:
(2)
5.
CBIR WITH DIFFERENT COLOR
QUANTIZATION SCHEMES
The main issues regarding the use of color histograms for indexing involve the choice of color space and correct quantization of the color space. The aim of this research work is to study the effect of color quantization on the performance of content-based image retrieval, using color and texture features, with different color spaces (HSV, YIQ and YCbCr), and two histogram similarity measures, Histogram Euclidean Distance and Histogram Intersection Distance.
In this study, two content-based image retrieval algorithms,
[image:3.595.80.256.151.251.2]Color Histogram Algorithm and Wavelet-Based Color Histogram Algorithm, proposed by Singha and Hemachandran [4], have been used. The color histogram is used for image color feature extraction and Haar wavelet transform is used for image texture and location information extraction. The first algorithm is based only on the color feature, while the second one is based on combination of the color and texture features. Both algorithms use the HSV color space and the Histogram Intersection Distance similarity measure. For the purpose of this study, these algorithms have been modified to enable the use of different color spaces with different color quantization schemes, and two histogram similarity measures, Histogram Euclidean Distance and Histogram Intersection Distance. Figures 2 and 3 show the steps of the modified Color Histogram and Wavelet-Based Color Histogram Algorithms, respectively.
Figure 2: The Modified Color Histogram Algorithm
6.
PERFORMANCE EVALUATION
To evaluate the performance of the CBIR system, with different color spaces, different color quantization schemes, and different histogram similarity measures, the precision measure has been used. Precision measures the ability of the system to retrieve only the images that are relevant. Precision is defined as:
Precision = = (3) where A represents the number of relevant images that are
retrieved, and B represents the number of irrelevant images.
The Modified Color Histogram Algorithm
1. For each image in the database Do
2. Read the image and resize it into 192x128.
3. Convert RGB color space image into the desired color space (HSV, YIQ or YCbCr).
4. Color quantization is carried out using color histogram with the different color quantization schemes that defines the size of the histogram bins for the chosen color space.
5. Normalized histogram is obtained by dividing with the total number of pixels to filter the image features after resizing it and to be sure that the image contents and details do not change after resizing it.
6. End For
7. Repeat Steps 2 to 5 for the query image.
8. Calculate the similarity between the query image and each image in the database.
The number of relevant images retrieved is the number of the returned images that are similar to the query image and in the same particular category of the query image. In this case, the total number of images retrieved is the number of images that are returned by the search engine. The average precision for 10 categories is given by:
P =
(4)
7.
EXPERIMENTS
This section describes the experiments that have been conducted to study the effect of color quantization schemes for different color spaces (HSV, YIQ and YCbCr) on the performance of content-based image retrieval (CBIR), using different histogram distance measurements (Histogram Euclidean Distance and Histogram Intersection Distance).
7.1
Image Database
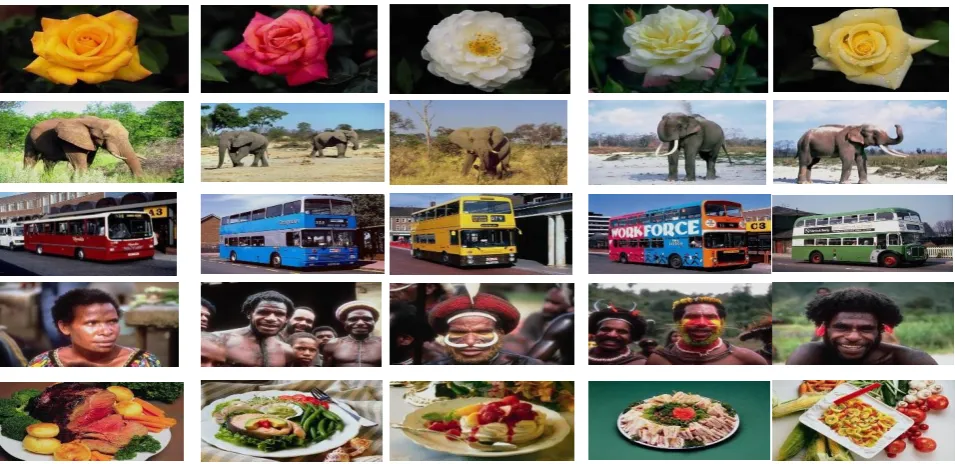
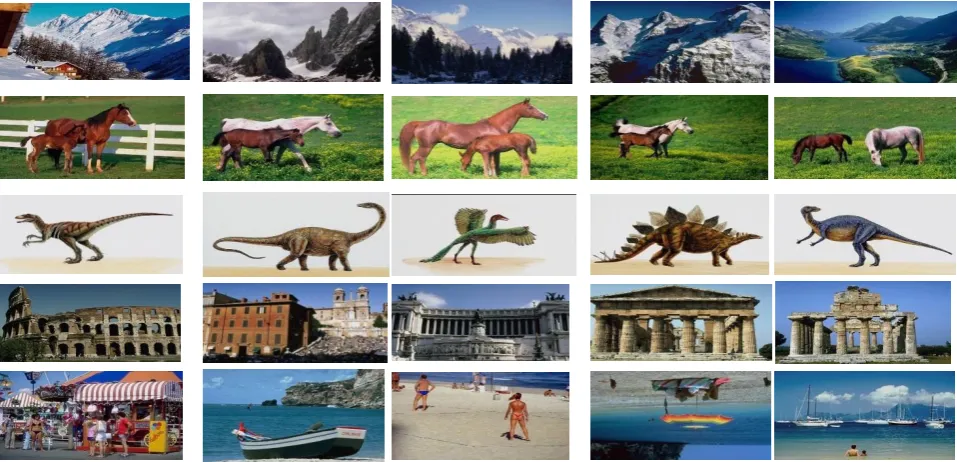
In the experiments, the WANG database [29] [30] has been used, which contains 1,000 images of the Corel stock photo, divided into 10 classes, in JPEG format of size 384x256 and 256x386. A sample of the images of WANG database is shown in Figure 4.
7.2
The Developed CBIR System
For the purpose of studying the impact of color quantization of different color spaces on the accuracy (precision) of CBIR, a CBIR system has been developed, which implements the modified Color Histogram and Wavelet-Based Color Histogram Algorithms, shown in Figures 2 and 3. Precision represents in a retrieval process the chance of obtaining images which are similar to a query image among a group of n retrieved images. In this study, the precision of the top 10 of retrieved images for each query has been calculated. The search is usually based on similarity rather than the exact match.
[image:4.595.61.539.483.715.2]Figure 3: The Modified Wavelet-Based Color Histogram Algorithm
Figure 4: Sample of WANG Image Database
The Modified Wavelet-Based Color Histogram Algorithm
1. For each image in the database Do
2. Read the image and resize it into 192x128. 3. Extract the Red, Green and Blue Components from
an image.
4. Decompose each Red, Green and Blue Component using Haar Wavelet transformation at 1st level to get approximate coefficient and vertical, horizontal and diagonal detail coefficients.
5. Combine approximate coefficient of Red, Green and Blue Component.
6. Similarly combine the horizontal and vertical coefficients of Red, Green and Blue component. 7. Assign the weights 0.003 to approximate
coefficients, 0.001 to horizontal and 0.001 to vertical coefficients.
8. Convert the approximate, horizontal and vertical coefficients into the desired color space (HSV, YIQ or YCbCr) plane.
9. Color quantization is carried out using color histogram with the different color quantization schemes that defines the size of the histogram bins for the chosen color space.
10. Normalized histogram is obtained by dividing with the total number of pixels to filter the image features after resizing it and to be sure that the image contents and details do not change after resizing it.
11.End For
12.Repeat Steps 2 to 10 for the query image.
13.Calculate the similarity between the query image and each image in the database.
Volume 96– No.12, June 2014
Figure 4: Sample of WANG Image Database (Continued)
[image:5.595.58.545.86.538.2]
Figure 5: The interface of the developed CBIR system
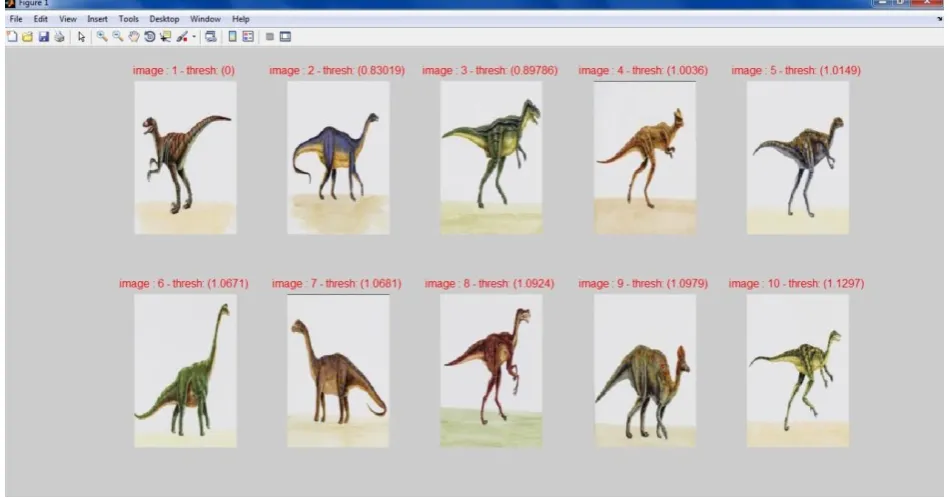
Figure 5 shows the interface of the developed CBIR system, which allows the user to select a query image, the algorithm to be applied, the color space, and quantization scheme. Figure 6 shows the retrieval results window of the developed CBIR system, which displays the top 10 of returned images for the query image.
7.3
Experimental Results Analysis
The modified image retrieval techniques, Color Histogram Algorithm and Wavelet-Based Color Histogram Algorithm, described in Section 5, have been applied using different quantization schemes for three color spaces (HSV, YIQ and YCbCr).
Tables 1 and 2 show the precision of the retrieval results of applying the first algorithm, i.e. using only the color feature, with the two histogram similarity measures, Histogram Euclidean Distance and Histogram Intersection Distance,
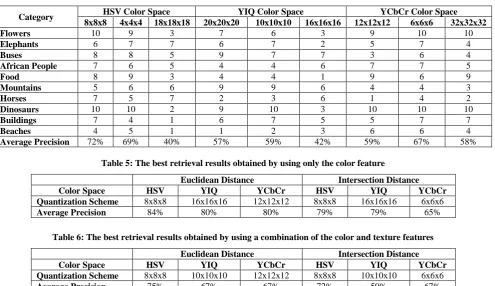
respectively. Table 5 summarizes the best retrieval precision results from these two tables. From this table, it can be seen that the Histogram Euclidean Distance measure gives better precision than the Histogram Intersection Distance measure. Also, it can be seen that the HSV color space gives better precision than the other two color spaces. Finally, it can be seen that the best quantization schemes for HSV, YIQ and YCbCr color spaces, when using only the color feature, are 8x8x8, 16x16x16, and 12x12x12, respectively.
[image:5.595.54.546.312.559.2]Distance measure. Also, it can be seen that the HSV color space gives better precision than the other two color spaces. Finally, it can be seen that the best quantization schemes for
[image:6.595.61.536.124.373.2]HSV, YIQ and YCbCr color spaces, when using a combination of the color and texture features, are 8x8x8, 10x10x10, and 12x12x12, respectively.
Figure 6: The retrieval results window of the developed CBIR system
Table 1. Precision using Color Histogram Algorithm with Euclidean Distance and different quantization schemes for the three color spaces
Category HSV Color Space YIQ Color Space YCbCr Color Space
8x8x8 16x4x4 4x8x8 16x16x16 20x20x20 4x4x4 12x12x12 10x10x10 6x6x6
Flowers 8 4 9 8 8 10 9 9 8
Elephants 8 6 8 3 4 2 6 6 5
Buses 10 10 9 10 10 4 8 8 7
African People 9 8 9 9 10 3 7 6 6
Food 10 9 10 9 9 7 10 10 6
Mountains 6 7 4 9 10 2 8 5 4
Horses 10 8 9 8 4 8 10 8 7
Dinosaurs 10 10 10 10 10 10 10 10 10
Buildings 7 9 7 7 5 1 7 9 3
Beaches 6 6 6 7 7 5 5 6 9
Average Precision 84% 77% 81% 80% 77% 52% 80% 77% 65%
Table 2. Precision using Color Histogram Algorithm with Intersection Distance and different quantization schemes for the three color spaces
Category HSV Color Space YIQ Color Space YCbCr Color Space
8x8x8 16x4x4 4x8x8 16x16x16 20x20x20 4x4x4 6x6x6 24x24x24 32x32x32
Flowers 9 3 9 9 10 10 7 3 1
Elephants 7 6 8 3 4 3 7 4 3
Buses 10 6 9 9 9 4 7 6 5
African People 8 6 7 9 9 3 6 2 6
Food 8 5 8 9 9 8 3 4 6
Mountains 5 5 6 8 8 2 5 8 3
Horses 9 2 8 6 2 9 8 3 7
Dinosaurs 10 10 10 10 10 10 10 6 7
Buildings 7 9 7 7 6 1 2 6 6
Beaches 6 6 6 9 7 4 10 5 3
[image:6.595.48.551.615.759.2]Volume 96– No.12, June 2014
Table 3. Precision using Wavelet-Based Color Histogram Algorithm with Euclidean Distance and different quantization schemes for the three color spaces
Category HSV Color Space YIQ Color Space YCbCr Color Space
8x8x8 4x4x4 18x18x18 20x20x20 10x10x10 16x16x16 12x12x12 6x6x6 32x32x32
Flowers 10 10 7 5 7 9 9 9 10
Elephants 5 5 3 3 6 4 4 5 3
Buses 9 9 9 9 8 4 7 5 6
African People 6 6 7 9 7 2 9 8 7
Food 9 8 9 9 8 2 9 9 10
Mountains 7 6 5 9 9 2 6 6 1
Horses 8 6 7 3 3 3 4 4 5
Dinosaurs 10 10 10 7 8 1 10 10 10
Buildings 6 5 6 6 8 1 4 6 8
Beaches 5 4 5 2 3 1 5 4 4
Average Precision 75% 69% 68% 62% 67% 29% 67% 66% 64%
Table 4. Precision using Wavelet-Based Color Histogram Algorithm with Intersection Distance and different quantization schemes for the three color spaces
Category HSV Color Space YIQ Color Space YCbCr Color Space
8x8x8 4x4x4 18x18x18 20x20x20 10x10x10 16x16x16 12x12x12 6x6x6 32x32x32
Flowers 10 9 3 7 6 3 9 10 10
Elephants 6 7 7 6 7 2 5 7 4
Buses 8 8 5 9 7 7 3 6 4
African People 7 6 5 4 4 6 7 7 5
Food 8 9 3 4 4 1 9 6 9
Mountains 5 6 6 9 9 6 4 4 3
Horses 7 5 7 2 3 6 1 4 2
Dinosaurs 10 10 2 9 10 3 10 10 10
Buildings 7 4 1 6 7 5 5 7 7
Beaches 4 5 1 1 2 3 6 6 4
[image:7.595.54.550.282.568.2]Average Precision 72% 69% 40% 57% 59% 42% 59% 67% 58%
Table 5: The best retrieval results obtained by using only the color feature
Euclidean Distance Intersection Distance
Color Space HSV YIQ YCbCr HSV YIQ YCbCr
Quantization Scheme 8x8x8 16x16x16 12x12x12 8x8x8 16x16x16 6x6x6
Average Precision 84% 80% 80% 79% 79% 65%
Table 6: The best retrieval results obtained by using a combination of the color and texture features
Euclidean Distance Intersection Distance
Color Space HSV YIQ YCbCr HSV YIQ YCbCr
Quantization Scheme 8x8x8 10x10x10 12x12x12 8x8x8 10x10x10 6x6x6
Average Precision 75% 67% 67% 72% 59% 67%
8.
CONCLUSION
This paper presented a study of the effect of color quantization schemes for different color spaces (HSV, YIQ and YCbCr) on the performance of content-based image retrieval (CBIR), using different histogram distance measurements (Histogram Euclidean Distance and Histogram Intersection Distance). For the purpose of this study, a CBIR system that implements two content-based image retrieval algorithms has been developed. The first algorithm is based only on the color feature, while the second one is based on combination of the color and texture features. The color histogram is used for image color feature extraction and Haar wavelet transform is used for image texture feature extraction. The WANG image database, which contains 1000 general-purpose color images, has been used in the experiments of the study.
When using only the color feature, and when using a combination of the color and texture features, the experimental results showed that the Histogram Euclidean Distance measure gives better precision than the Histogram Intersection Distance measure, and the HSV color space gives better precision than the YIQ and YCbCr color spaces. Also, the experimental results showed that best quantization schemes for HSV, YIQ and YCbCr color spaces, when using only the color feature, are 8x8x8, 16x16x16, and 12x12x12, respectively, and when using a combination of the color and texture features, are 8x8x8, 10x10x10, and 12x12x12, respectively.
9.
REFERENCES
[1] Rasheed, W. 2008. Sum of Values of Local Histograms for Image retrieval. Chosun University, Gwangju, South Korea.
[2] Wang, B. 2008. A Semantic Description For Content-Based Image Retrieval. College Of Mathematics And Computer Science, Hebei University, Baoding 071002, China.
[3] Zhang, D. 2004. Improving image retrieval performance by using both color and texture features. In Proc. 3rd Int. Conf. Image Graph., Hong Kong, pp. 172–175.
[4] Singha, M. and Hemachandran, K. 2012. Content Based Image Retrieval Using Color and Texture. Signal & Image Processing: An International Journal (SIPIJ) Vol. 3, No.1, pp. 39-57.
[5] Fuertes, J. M., Lucena, M., Blanca, N. P. D. L., and Martinez, J. C. 2001. A Scheme of Color Image Retrieval from Databases. Pattern Recognition, pp. 323-337.
[6] Chan, Y. K. and Chen, C. Y. 2004. Image retrieval system based on color-complexity and color-spatial features. The Journal of Systems and Software, pp. 65-70.
[7] Swain, M. and Ballard, D. 1991. Color indexing. International Journal of Computer Vision, pp. 11–32. [8] Wang, J. Z. 2001. Integrated Region-Based Image
Retrieval. Boston, Kluwer Academic Publishers. [9] Smeulders, A. M. W., Worring, M., Santini, S., Gupta,
A., and Jain, R. 2000. Content based image retrieval at the end of the early years. IEEE Trans. on Pattern Analysis and Machine Intelligence, Vol.22, No.12, pp. 1349-1380.
[10]Vailaya, A., Figueiredo, M. A. G., Jain, A. K., and Zhang, H. J. 2001. Image classification for content-based indexing. IEEE Trans. on Image Processing, Vol. 10, No.1.
[11]Color spaces - RGB, CMYK, and YCbCr, http://www.rw-designer.com/color-space, Last accessed 4/2014.
[12]Flickner, M., Sawhney, H., Niblack, W., Ashley, J., Huang, Q., Dom, B., Gorkani, M., Hafne, J., Lee, D., Petkovic, D., Steele, D., and Yanker, P. 1995. Query by Image and Video Content The QBIC System. IEEE Computer, pp-23-32.
[13]Broek, E. L., den, van 2005. Human-Centered Content-Based Image Retrieval. Ph.D. thesis Nijmegen Institute for Cognition and Information (NICI), Radboud University Nijmegen, The Netherlands – Nijmegen. [14]Smith, J. R. 1997. Integrated spatial and feature image
system: Retrieval, analysis and compression, Ph.D. dissertation, Columbia University, New York.
[15] Wan X. and Jay Kuo, C.-C. 1996. Image retrieval with multiresolution color space quantization. Proc. SPIE 2898, Electronic Imaging and Multimedia Systems, 148, September 30.
[16] Wan, X. and Jay Kuo, C.-C. 1996 -. Color distribution analysis and quantization for image retrieval. Proc. SPIE 2670, Storage and Retrieval for Still Image and Video Databases IV, 8 (March 13, 1996), pp. 9- 16. [17] Zhang, Z., Li, W., Li, B. 2009 -. An Improving
Technique of Color Histogram in Segmentation-based Image Retrieval. At Fifth International Conference on Information Assurance and Security. IEEE.
[18] Smith, J. R. and Chang, S. F. 1996. Tools and techniques for color image retrieval. IST/SPIE-Storage and Retrieval for Image and Video Databases IV, San Jose, CA, 2670, 426-437.
[19] IEEE 1990. IEEE standard glossary of image processing and pattern recognition terminology. IEEE.
[20] Smith, J. R. and Chang, S. 1994. Transform Features for Texture Classification and Discrimination in Large Image Databases. Proceeding of IEEE International Conference on Image Processing, pp. 407-411.
[21] Manjunath, B., Wu, P., Newsam, S., and Shin, H. 2000. A texture descriptor for browsing and similarity retrieval. Journal of Signal Processing: Image Communication, pp. 33-43.
[22] Haralick, R. 1979. Statistical and structural approaches to texture. IEEE, pp. 786–804.
[23] Tamura, H., Mori, S., and Yamawaki, T. 1978. Textural features corresponding to visual perception. IEEE Transactions on Systems, Man and Cybern, pp. 460-472. [24] Wouwer, G. V. D., Scheunders P., and Dyck, D. V.
1999. Statistical texture characterization from discrete wavelet representation. IEEE Transactions on Image Processing, Vol. 8, pp-592–598.
[25] Livens, S., Scheunders, P., Wouwer, G. V. D., and Dyck, D. V. 1997. Wavelets for texture analysis, an overview. Sixth International Conference on Image Processing and Its Applications, pp. 581–585.
[26] Daubechies. I. 1992. Ten lecturer on wavelet". Philadelphia, PA: Society for Industrial and Applied Mathematics Analysis, vol. 23, pp. 1544–1576.
[27] Mallet, S. 1996. Wavelets for a Vision. Proceeding to the IEEE, Vol. 84, pp. 604-685.