R E S E A R C H
Open Access
HOS network-based classification of power
quality events via regression algorithms
José Carlos Palomares Salas
1,2*, Juan José González de la Rosa
1,2, José María Sierra Fernández
1,2and Agustín Agüera Pérez
1,2Abstract
This work compares seven regression algorithms implemented in artificial neural networks (ANNs) supported by 14 power-quality features, which are based in higher-order statistics. Combining time and frequency domain estimators to deal with non-stationary measurement sequences, the final goal of the system is the implementation in the future smart grid to guarantee compatibility between all equipment connected. The principal results are based in spectral kurtosis measurements, which easily adapt to the impulsive nature of the power quality events. These results verify that the proposed technique is capable of offering interesting results for power quality (PQ) disturbance classification. The best results are obtained using radial basis networks, generalized regression, and multilayer perceptron, mainly due to the non-linear nature of data.
Keywords: Artificial neural networks (ANN); Power quality (PQ); Cumulants; Higher-order statistics (HOS); Regression algorithms; Smart grid (SG); Spectral kurtosis (SK)
Introduction
With the consequent unstoppable increase of electronic equipments demanding electricity, consumers expect uninterrupted availability and quasi perfect power quality (PQ). For that reason, PQ is being the object of continuous interest by researchers and developers, due to its influence over and from the loads, and the recent potential inclusion in the modern smart grid (SG).
In this frame, an adequate PQ assures the necessary compatibility between all equipment connected to the grid [1]. The terms of this compatibility gather several aspects: sustainable power with low losses and high qual-ity and securqual-ity of supply and safety, being at the same time economically efficient, reliable, and resilience [2,3].
Certainly, the future SG would introduce transformative technologies to meet these design requirements, inte-grating intelligence into end-use devices as the key to satisfying the demand response. In parallel, the industry would design ways to incorporate automatic end-use-load participation into the model so that customers are not
*Correspondence: [email protected]
1Research Group PAIDI-TIC-168: Computational Instrumentation and Industrial Electronics (ICEI), Av. Ramón Puyol S/N., E-11202 Algeciras-Cádiz, Spain 2Area of Electronics, Polytechnic School of Engineering, University of Cádiz, Av. Ramón Puyol S/N., E-11202 Algeciras-Cádiz, Spain
bothered by these programs and decisions, and so their lifestyles are not inconvenienced [4].
Due to the above arguments, the role of smart meters and sensors is the first being revised in the present and future SG. These automated meters (AM) used a two-way communicating infrastructure and centralized manage-ment, as well as new features such as the following: outage management, demand response, automatic load shedding, distribution automation, and the ability to enable and commute alternative energy sources.
Provided with this scenario, this research integrates arti-ficial neural networks (ANNs) and advanced signal pro-cessing techniques based in higher-order statistics (HOS) in order to be implemented into an automated smart meter for PQ event detection and classification, within the frame of a SG with a high distribution penetration of renewable sources. Seven regression algorithms are tested based on an hybrid time-frequency battery of char-acteristics, specially designed to deal with non-stationary measurement time series.
The feature extraction stage from PQ disturbances is based on HOS, idea which has been proven to be effi-cient in several works. Indeed, since PQ events are sudden changes in the power line, the HOS are potentially use-ful to characterize each type of electrical anomaly both
in time and frequency domains. As a novelty, the present research exploits the combination of time and frequency domain features, to deal with the inherent non-stationary associated to the electrical anomalies, with the goal to improve the performance of the ANN and to make feasible the integration in an smart meter.
Regarding backgrounds of HOS applications in this field, in the time domain, several notable works are wor-thy, e.g., Bollen et al. introduced new advanced statistical features to PQ event detection [5]. In the same direction, Gu and Bollen [6] found relevant characteristics associ-ated to PQ events in the time and frequency domains. The work by Ribeiro et al. is also remarkable [7], which extracted new time-domain features based in cumulants. The same authors performed the classification of single and multiple disturbances using HOS in the time domain and Bayes’ theory-based techniques [8]. HOS techniques and estimators have also been implemented to specifically detect sags and swells [9].
The categorization of PQ anomalies had been formerly performed by Nezih and Ece in the work [10], where they proved that HOS and quadratic classifiers improve the second-order-based methods. The same authors previ-ously achieved performance in second-order computing, using 2-D wavelets and compression techniques [11,12]; finding, despite the promising results, the limits of the procedure and quantifying its heavy computational cost. Alienated to this work, the researches of Poisson et al. and Santoso et al. [13,14] also reported a wavelet-based method, finding the potential and the drawbacks of the technique so that to implement it in an intelligent meter.
The direct antecedent of the present research in the work by J.J.G. de la Rosa et al. [15], in which they performed a mixed study involving the time-domain vari-ance, skewness, and kurtosis, and they obtained conse-quences combined with the spectral kurtosis (SK), and over a set of real-life measurements, some of them with
mixed PQ perturbations. The same authors proposed a preliminary criteria for seven types of disturbances based on the former estimators [16]. In a previous work [17], they designed an offline case-based reasoner based on time-domain HOS estimators. Furthermore, the authors used also HOS features in classification techniques for characterization of electrical PQ signals [18].
The present paper is designed as follows. The next section summarizes the main advances in the field, pay-ing special attention at the applications of ANN for PQ analysis, and reasoning the contribution of HOS to the feature extraction stage and the architecture. Then, Section Higher-order statistics for PQ monitoring: an enhancement proposal over the DWT exposes the advan-tages of HOS for PQ monitoring and the state-of-the art. In Section Proposed methodology: the HOS-based ANN, the procedure is detailed in order to expose the results later in Section Results; finally, conclusions are drawn in Section Conclusions.
ANN for PQ analysis: towards the HOS paradigm
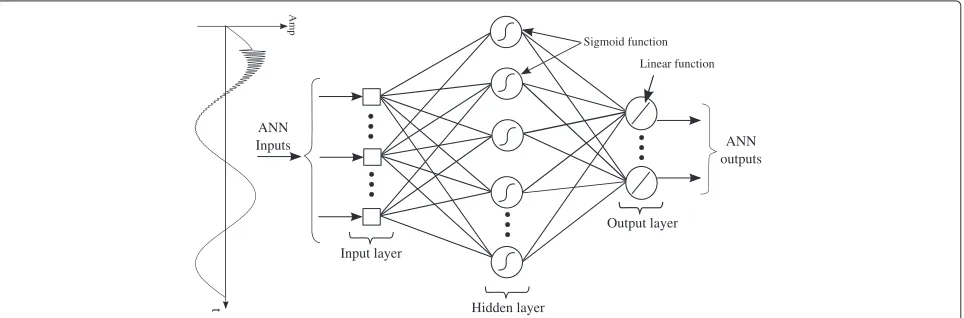
The present paper postulates non-stationary signal pro-cessing with higher-order statistics in the time and fre-quency domains in order to extract a battery of features to be processed via ANNs with regression algorithms. ANNs have been used for classification purposes in myr-iads of works and have proved the utility for a long time [19]; Figure 1 shows a generic architecture, indicating how the input pattern is processed via the neurons to provide with the output vector, in order to introduce the concrete architecture in the present work.
The performance of the potential PQ monitoring sys-tem and consequently the ANN is directly related to the pre-processing and feature extraction techniques used. The main goal of the feature extraction is to represent the data set in a new feature space in which the proba-bility to distinguish classes is higher than the one in the
Output layer
Hidden layer Input layer
Sigmoid function Linear function
ANN outputs ANN
Inputs
t
Amp
original space. Therefore, the identification of efficient pre-processing and feature extraction techniques is a key issue [20].
Some works have shown that the best performance for non-stationary signals is achieved combining time and frequency characteristics obtained in the feature extrac-tion stage via wavelet transforms (WT), on the hypotheses that WT performance is suitable for the analysis of tran-sient signals with easy computation. Three works are worth to be cited as they are directly concerned with our research, involving ANN and PQ analysis. In the first one to mention, Angrisani et al. presented a wavelet network for automated transient detection; basically, it was based in an extended perceptron which incorporated wavelet nodes [21]. They proposed a unique structure based on the introduction of wavelet nodes in the traditional ANN, in the neurons of the first layer, and was applied success-fully to typical transients in the PQ analysis. The number of nodes was fixed to 12, and this number was related to the time location of the perturbation. The network has to be pre-conditioned in order to detect concrete transient signals.
In the same former line, using the WT as a preprocess-ing tool for ANN, the second work by Iñigo Monedero et al. [22] developed a neural perceptron-based (three hidden layers) real-time first system prototype, which was trained using a disturbance generator for pseudo-synthetic waveforms. They obtained a performance of 89% success combining simulated and real-time data. The perturbations were classified in frequency, voltage, and harmonics, and the topology of the ANN (number of hid-den neurons and number of outputs) was highly moveable depending on the PQ event under study.
The third and most recent paper, by Martin Valtierra-Rodriguez et al. [23] involves a new dual neural-network-based methodology to detect and classify single and combined PQ disturbances, consisting, on the one hand, of an adaptive linear network for harmonic and inter-harmonic estimation that allowed computing the root-mean-square voltage and THD indices, from which it is possible to detect and classify sags, swells, outages, and harmonics. A complementary feed-forward neural network was used for pattern recognition using the horizontal and vertical his-tograms of a specific voltage waveform to classify spikes, notching, flicker, and oscillatory transients. The comple-mentary action of these neural networks allows the detec-tion and classificadetec-tion even with simultaneous electrical anomalies, both in noisy and noise less scenarios.
Apart from the difficulties in implementing a real-time processor in the smart grid frame, the main disadvantage of the above procedures lies in the fact that accuracy and repeatability are highly compromised by the second-order estimators (WT andVRMS) used in the feature extraction
stage. Drawbacks arise when the data are corrupted by
noise; specially when the number of samples of the signal window is reduced, and the resolution and repeatability are degraded. This facts are dramatically increased if the tests are performed over synthetic signals of controlled-lab experiences, where predictability is tacitely supposed. In the real-world experiences, the system should be pre-pared for unpredictable phenomena, both in the time and in the frequency domains. As explained hereinafter, this goal is accomplished by statistical parameters of an order higher than two.
Higher-order statistics for PQ monitoring: an enhancement proposal over the DWT
During the last decade, some researches [7,15,24] have demonstrated the usage of HOS features for PQ moni-toring. The motivation of HOS in PQ analysis is twofold. By one side, as HOS measurements are correlations that involve powers higher than two [25], the HOS informa-tion for Gaussian signals is null, as Gaussian processes are described up to the second order. As many measure-ment noises are Gaussian or symmetrically distributed, the HOS may be less degraded by the background noise than the second-order calculations. Secondly, the capa-bility to reveal non-linear characteristics from the data, which is important for pattern recognition scenarios, in concrete to target PQ events, waveforms which exhibit high time variability, like impulsiveness of peakedness.
The usage of HOS as a feature extraction technique for PQ monitoring systems is very promising, and several recent works presented good results with respect to both detection and classification tasks. The most similar work was recently committed by Liu et al. [26]; transients were classified according to the features extracted via the SK and using ANNs. They worked with simulated signals over the five types of synthetic perturbations.
Formerly, it had been shown that combining techniques allows efficient classification of single and simultane-ous disturbances, and more, the usage of the second-and fourth-order HOS features, for a specific lag chosen from Fisher’s discriminant ratio (FDR) criterion, has been enough to deal with the majority of the disturbances considered [24].
Regarding the HOS that has been used in the present research, it is worth remarking that we have made use of a combination in the time and the frequency domains. The ensemble of Equation 11, whose rigorous mathematical treatment is in the appendix, constitutes indirect mea-surements of the variance, skewness, and kurtosis that has been used in the present paper, along with the SK, which is used to locate the transients in the frequency domain.
With the aim of motivating the performance of HOS over second-order methods, a comparison has been devel-oped via the discrete wavelet transform (DWT), which is a promising technique for PQ analysis according to the literature (e.g., [21]). Without the further necessity of expanding expressions, in this section, we recall that every finite energy signals(t)can be decomposed over a wavelet orthogonal basis according to:
s(t)=
Each partial sum, indexed byk, in Equation 1 represents the detail variations at the scalea=2j(at each levelj, the scale is increased by a factor of two):
dj(t)=
The approximation of the signal s(t) can be progres-sively improved by obtaining more levels, with the aim of recovering the signal selectively. For example, ifs(t)varies smoothly, we can obtain an approximation by removing fine scale details, which gather information regarding the high frequencies or rapid variations of the signal. This is done by truncating the sum in Equation 1 at the scale a=2J:
Details corresponding to indexesj<J are not consid-ered in Equation 3.
Hereinafter, a simple experience is exposed illustrating the limitations of the method based in the DWT, in case DWT coefficients were selected to be used as features. The wavelet decomposition tree has been expanded up to level 7 using the mother wavelet sym8. The idea in the background literature is to study the distribution of the signal energy for each level of the tree, which acts as a filter bank. As stated and proved in myriads of refer-ences (e.g., [27]), low index levels point rapid fluctuations of the signal, whereas slow variations are associated to higher (or deeper) decomposition branches. The differ-ence between the energy of the perfect power signal and the energy of the PQ event under test has been studied for
each level. The energy expression that we have considered is the traditional 2-norm, according to Equation 4:
E(s):= N
i=1
si2, (4)
wheresis theN-point vector signal andsi, their associated components. Figure 2 shows the processing results for six prototypes. The limitations of the DWT can be concluded via a simple analysis of the graphs. Firstly, as the DWT analysis consists of a selective filtering, sag and swells cannot be distinguished. Secondly, mixed PQ events are also difficult to separate because the constant incremental energy does not indicate whether a transient is coupled or not. Finally, an eventual noisy environment would mask results in the case of the oscillatory transient (this has been extensively proved).
At the light of the second-order analysis, a more robust set of features is required in order to process real-life measurements. This is achieved via HOS.
Proposed methodology: the HOS-based ANN
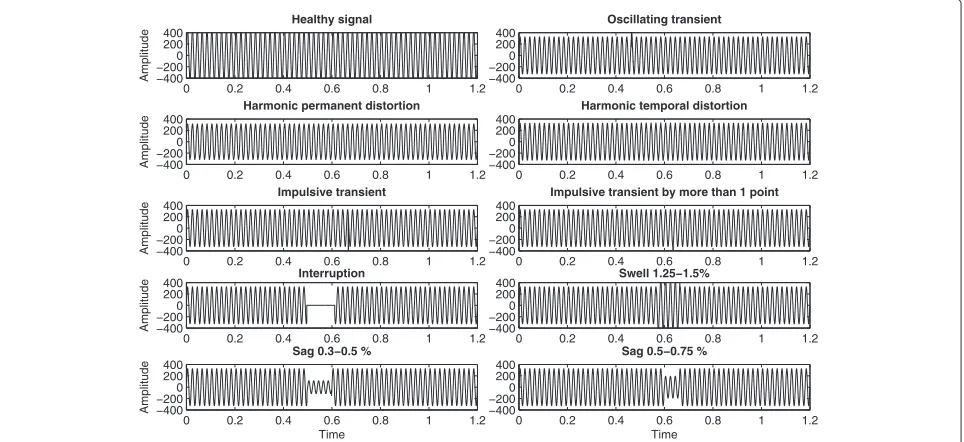
The final goal of this work is the implementation in the future SG to guarantee compatibility between all equipment connected. Data used in this work have been simulated using MATLAB software. The data set gener-ated by the simulation consists of 550 samples including the different studied disturbance kinds, which cover the following disturbances: oscillatory transient, impulsive transient, interruption, harmonic permanent distortion, harmonic temporal distortion, sag, sag plus oscillatory transient, and swell. Each signal comprises a 20K-point synthetic time-domain register with a duration of 1 s (20 KHz sampling frequency). An additive normal noise pro-cess (1% of the amplitude of the signal) has been added in order to achieve a more realistic behavior. Figure 3 shows an example of these signals as well as healthy signal that are utilized in this paper.
The classification techniques used to classify the PQ disturbances are based on regression algorithms. These techniques are multiple linear regression (MLR), adap-tive linear neuron (LIN), multilayer ANNs (BP1 and BP2), radial basis function (RBF) network, exact radial basis (ERB), and generalized regression network (GRN). Every model has been intelligently adapted to meet the objective of PQ classification because each has different character-istics. Table 1 shows the selected parameters correspond-ing to the architecture and activation function of each model used. The final design of each model has been obtained by the optimization of the parameters shown in this table.
0 1 2 3 4 5 6 7
Sag plus oscillatory transient
0 1 2 3 4 5 6 7
Figure 2DWT analysis for different PQ events.From top to bottom and left to right: sag, oscillatory transient, sag plus oscillatory transient, swell, harmonics, and pure power signal. The energy difference is depicted vs. the decomposition level. In the case of additive noise, the method does not guarantee success in the feature extraction stage.
by a process of feature extraction which is based on the combination of higher-order statistics in time and fre-quency domains. The HOS have been computed using a 400-points sliding window (which corresponds to a signal period), with a shift of 10 points over a vector of 20,000 points. After extraction stage, a total of 14
characteristic features are selected, nine of whom corre-spond to time domain and the remaining five to frequency domain. The coefficients selected in the first one cor-respond to the maxima and minima and stable in the second-, third-, and fourth-order cumulants at zero lags (directly related to the variance, skewness, and kurtosis).
0 0.2 0.4 0.6 0.8 1 1.2
Impulsive transient by more than 1 point
0 0.2 0.4 0.6 0.8 1 1.2
Table 1 Parameters of the ANNs
ANN LIN BP1 BP2 RBF ERB GRN
Hidden layers - 1 2 1 1 1
Neurons hidden layer 1 - [4 to 10] [4 to 10] [1 to 150] [1 to 150] [1 to 150]
Neurons hidden layer 2 - - [2 to 5] - -
-TF - S S G G G
TF output L L L L L L
Training algorithm WH LM LM k k k
Spread - - - [1 to 20] [1 to 20] [1 to 20]
LM, Levenberg Marquardt; WH, Widrow Hoff; S, sigmoid; G, Gaussian; L, linear;k,k-means; TF, transfer function.
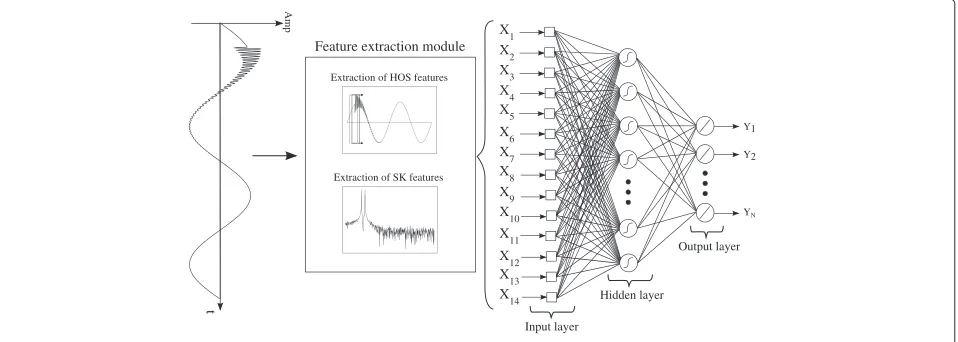
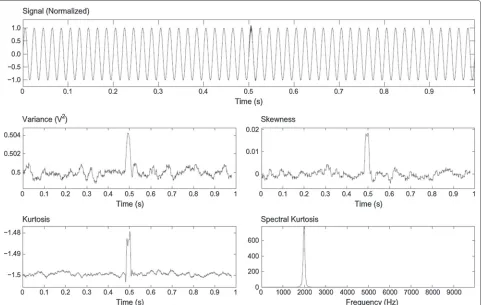
On the other hand, the coefficients selected in the sec-ond one correspsec-ond to the frequency of extreme value of SK, bandwidth of dome, extreme value of SK, num-ber of peaks in SK, and dome very targeted (between 0 and 1). The abstract graphic of this work with the proposed methodology can be seen in Figure 4 where it specifies the feature extraction module. In order to illustrate the capability of the SK to discriminate PQ disturbances, we have selected a practical example con-sisting of an oscillatory transient coupled to the power sine wave. The analysis result is depicted in Figure 5. The time-domain variance increases when it bumps into the transient; this behavior is independent of the transient fre-quency. Similarly, the time-domain skewness and kurtosis detect slight variations. The real detection takes place in the frequency domain; the SK produces a real enhance-ment in 2,000 Hz, along with the high-resolution bump (narrow peak).
The resulting data after carrying out the feature extrac-tion is a matrix of dimension 550 × 14 (samples ×
features). Then, the building of the models is performed by following two steps in order to efficiently classify the disturbances. First, data are normalized so that they are in the interval [−1, 1], for a faster computation [28]. And second one, we divide randomly the data set into three subsets: training, evaluation, and test sets. The training and validation sets, with 70% and 15% of data, respectively, were used for ANN model building; and the third set, with the last 15%, was used to test on the out-of-sample set the classification power of a model.
For comparison purposes, the classification criterion is based on the parameter hit rate (HR), that is defined as follows:
HR= NC NT ×
100% (5)
where NT is the number of test samples and NC is the number of correct disturbance recognition.
t
Amp
Feature extraction module
Extraction of HOS features
Extraction of SK features
Output layer
Hidden layer
Input layer X1 X2 X3 X4 X5 X6 X7 X8 X9 X10 X11 X12 X13 X14
Y1
Y2
YN
Figure 5An example of mixed analysis in the time and frequency domains.An oscillatory transient is detected in the time domain by the second-, third-, and fourth-order statistics, and its frequency is clearly targeted by the spectral kurtosis.
Results
Once the assessed models were configured and opti-mized, they are used in the out-of-sample set. Because the database is small, we choose randomly two test sets, and in each of them, 100 experiments are launched by model. This is realized to achieve statistically meaning-ful results which rule out the random factors influencing the ANNs.
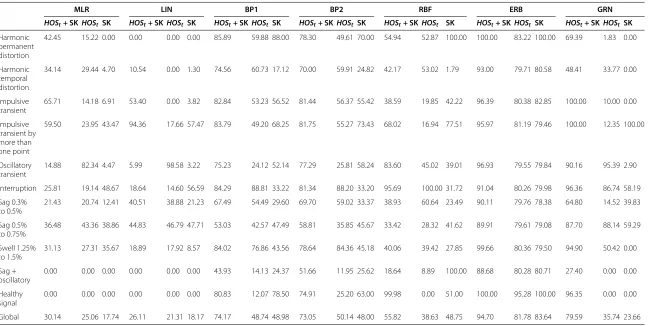
For each model, we have performed three analysis in function of the features used: HOS in the time domain (HOSt), the SK, and the mixed (time and frequency domains) analysis(HOSt+SK). In all of them, the HR was calculated for each model on the 200 offline tests, observ-ing the arithmetic mean. The obtained results showobserv-ing the percentage of effectiveness for classifying disturbances are presented in Table 2. In most models, results obtained in the mixed analysis are better than in the other analy-ses except isolated results. These exceptions represent the 27.27% of the cases presented in Table 2, where the 14.28% of them correspond to(HOSt)features, and the remaining 12.99% correspond to SK features.
As can be seen, the algorithms based on linear models are worse than those based on non-linear schemes. The
best models both individually and collectively are ERB, GRN, and BP1.
Conclusions
In this paper, seven regression algorithms have been applied and compared for PQ disturbances classification. The novel aspect is the introduction of new represen-tative coefficients based on HOS in time and frequency domains. These coefficients are the inputs used in the classification algorithms to verify the occurrence or not of single or multiple disturbances in the electric signals.
The data used to test the proposed method were gen-erated by the MATLAB software. The PQ disturbances considered are the most common on the supply. The best models both individually and collectively are obtained employing radial basis networks, generalized regression, and multilayer perceptron. The overall hit rates obtained are 94.70%, 79.59%, and 74.17%, respectively. This is con-sistent with non-linearity of the used data and emphases of the non-linearity that provide the HOS.
S
alas
et
al.
EURASIP
Journal
o
n
A
dvances
in
Signal
Processing
(2015) 2015:16
Page
8
o
f
1
1
Table 2 Regression algorithms for ANNs
MLR LIN BP1 BP2 RBF ERB GRN
HOSt+ SKHOSt SK HOSt+ SKHOSt SK HOSt+ SKHOSt SK HOSt+ SKHOSt SK HOSt+ SKHOSt SK HOSt+ SKHOSt SK HOSt+ SKHOSt SK
Harmonic permanent distortion
42.45 15.22 0.00 0.00 0.00 0.00 85.89 59.88 88.00 78.30 49.61 70.00 54.94 52.87 100.00 100.00 83.22 100.00 69.39 1.83 0.00
Harmonic temporal distortion
34.14 29.44 4.70 10.54 0.00 1.30 74.56 60.73 17.12 70.00 59.91 24.82 42.17 53.02 1.79 93.00 79.71 80.58 48.41 33.77 0.00
Impulsive transient
65.71 14.18 6.91 53.40 0.00 3.82 82.84 53.23 56.52 81.44 56.37 55.42 38.59 19.85 42.22 96.39 80.38 82.85 100.00 10.00 0.00
Impulsive transient by more than one point
59.50 23.95 43.47 94.36 17.66 57.47 83.79 49.20 68.25 81.75 55.27 73.43 68.02 16.94 77.51 95.97 81.19 79.46 100.00 12.35 100.00
Oscillatory transient
14.88 82.34 4.47 5.99 98.58 3.22 75.23 24.12 52.14 77.29 25.81 58.24 83.60 45.02 39.01 96.93 79.55 79.84 90.16 95.39 2.90
Interruption 25.81 19.14 48.67 18.64 14.60 56.59 84.29 88.81 33.22 81.34 88.20 33.20 95.69 100.00 31.72 91.04 80.26 79.98 96.36 86.74 58.19
Sag 0.3% to 0.5%
21.43 20.74 12.41 40.51 38.88 21.23 67.49 54.49 29.60 69.70 59.02 33.37 38.93 60.64 23.49 90.11 79.76 78.38 64.80 14.52 39.83
Sag 0.5% to 0.75%
36.48 43.36 38.86 44.83 46.79 47.71 53.03 42.57 47.49 58.81 35.85 45.67 33.42 28.32 41.62 89.91 79.61 79.08 87.70 88.14 59.29
Swell 1.25% to 1.5%
31.13 27.31 35.67 18.89 17.92 8.57 84.02 76.86 43.56 78.64 84.36 45.18 40.06 39.42 27.85 99.66 80.36 79.50 94.90 50.42 0.00
Sag + oscillatory
0.00 0.00 0.00 0.00 0.00 0.00 43.93 14.13 24.37 51.66 11.95 25.62 18.64 8.89 100.00 88.68 80.28 80.71 27.40 0.00 0.00
Healthy signal
0.00 0.00 0.00 0.00 0.00 0.00 80.83 12.07 78.50 74.91 25.20 63.00 99.98 0.00 51.00 100.00 95.28 100.00 96.35 0.00 0.00
Global 30.14 25.06 17.74 26.11 21.31 18.17 74.17 48.74 48.98 73.05 50.14 48.00 55.82 38.63 48.75 94.70 81.78 83.64 79.59 35.74 23.66
to find an ANN classifier with better characteristics than obtained in this research.
Appendix
Time-domain cumulants and higher-order spectra Time-domain HOS
Higher-order cumulants are being used extensively to deduce newly statistical features from the data of non-Gaussian measurement time series [29-33]. To reach a compact expression, nomenclature is first introduced.
Let us consider{x(t)} be an rth-order stationary real-valued random process; therth-order cumulant is defined as the jointrth-order cumulant of the random variables x(t), x(t+τ1),. . . , x(t+τr−1). This compacted notation is
expressed via Equation 6:
Cr,x(τ1,τ2,. . .,τr−1)=Cum[x(t),x(t+τ1),. . .,x(t+τr−1)]
(6)
whereτ1,τ2,. . .,τr−1are time shifts, and thenth shifting
is a multiple of the data acquisition sampling period,Ts, and is usually expressed asτn=n·Ts.
Cumulants, defined in the Equation 6, are estimated by using the well-knownLeonov-Shiryaevformula, which expresses the compact relationship among the cumulants of stochastic signals and their moments [9]. In this sense, the expressions for the second-, third-, and fourth-order cumulants for a real, random, and zero-mean (central cumulants) time seriesx(t)can be estimated via:
C2,x(τ)=E{x(t)·x(t+τ)} (7a)
whereE{∗}is the expected value operator. Then, looking at Equation 7, each cumulant is easily interpreted as a cor-relation between the original time series and its associated time-shifted versions, being the computational result of an rth-order cumulant is therth degree of similarity among the aforementioned time series.
Considering a finiteN-sample vector, signal vectorx(n), n=0,· · ·,N−1, the following expressions, Equations 8, 9, and 10 describe the three unbiased estimates for the second-, third-, and fourth-order cumulants, respectively:
ˆ (lag) between samples of a record. The biased expres-sions are estimates over the real terms in the summations of expressions 8, 9, and 10. These expressions establish the correlation between the original signal and its time-shifted versions for the three orders of comparison. The second-order version is the classical auto-correlation, the third-order one account with the symmetry of the signal, and the fourth-order cumulant quantifies the impulsive-ness in the time domain.
Avoided time shifting,τ1 =τ2= τ3= 0 in Equation 7,
leads to the simplest computational expressions for cumu-lants, in Equation 11:
γ2,x=E{x2(t)} =C2,x(0) (11a)
γ3,x=E{x3(t)} =C3,x(0, 0) (11b)
γ4,x=E{x4(t)} −3(γ2,x)2=C4,x(0, 0, 0). (11c)
The ensemble of Equation 11 constitutes indirect mea-surements of the variance, skewness, and kurtosis. Ifx(t) is symmetrically distributed, its skewness is zero (but notvice versa, improbable situations); ifx(t)is Gaussian distributed, its kurtosis is necessarily zero (but not vice versa). Standardization (statistical normalization) makes estimators shift and scale invariant. Standardized quan-tities are defined as γ4,x/(γ2,x)2 and γ3,x/(γ2,x)3/2, for kurtosis and skewness, respectively.
Frequency-domain HOS
spectra are defined as the (r-1)-dimensional Fourier trans-forms of therth-order cumulants, according to:
Sr,x
The power spectrum is the decomposition of the sig-nal power in the frequency domain. When this concept is extended to higher orders, as suggested by Equation 12, the result is called a poly-spectrum. Power spectrum, bi-spectrum, and tri-spectrum are specific cases (particular poly-spectra) of Equation 12, withr=2, 3, and 4, respec-tively. Only power spectrum is real, and the others are complex magnitudes.
The more common higher-order spectra are the bi-spectrum and the tri-bi-spectrum. The first one identifies contributions to a signal’s skewness as a function of frequency pairs, meanwhile the tri-spectrum refers to contributions to a signal’s kurtosis as a function of fre-quency triplets. For this reason, poly-spectra output mul-tidimensional data structures which comprise redundant information, distributed in multi-dimensional geometries, often called tensors. As a consequence, their computa-tion may be impractical in many cases, and to extract the desired information, one-dimensional slices of cumulant sequences and spectra and bi-frequency planes are con-sidered [34,35]. To show this, in the following sections, we present two particular cases of the third- and fourth-order spectra, respectively: a 3-D bi-spectrum application and the performance of an estimator of the fourth-order spectrum for zero time lags, the spectral kurtosis (SK).
Ideally, the spectral kurtosis is a representation of the kurtosis of each frequency component of a process (or data from a measurement instrumentxi). For estimation issues, we will considerMrealizations of the process; each realization containingNpoints; i.e., we consequently con-siderMmeasurement sweeps, each sweep withNpoints. The time spacing between points is the sampling period, Ts, of the data acquisition unit. The SK unbiased indirect estimator is given by Equation 13:
GN2,X,M= M cates the value of the kurtosis for this Fourier frequency. This expression offers an indirect calculation of the SK, as it is obtained directly from the Fourier transforms, and it supposes low computational burden. The graphical
representation of the SK allows the identification of non-Gaussian frequency components. The higher the peak the more variable is the amplitude associated to this Fourier component.
Competing interests
The authors declare that they have no competing interests.
Acknowledgements
The authors would like to thank the Spanish Government for funding the research ProjectTEC2010−19242−C03−03 (SIDER-HOSAPQ). This work is newly supported by the Spanish Ministry of Economy and Competitiveness in the frame of the Statal Plan of Excellency for Research, via the project
TEC2013−47316−C3−2−P(SCEMS-AD-TED-PQR). Our unforgettable
thanks to the trust we have from the Andalusian Government for funding the Research GroupPAIDI−TIC−168 in Computational Instrumentation and Industrial Electronics (ICEI).
Received: 29 October 2014 Accepted: 5 February 2015
References
1. MHJ Bollen, S Bahramirad, A Khodaei, inProceedings on the 2014 IEEE 16th International Conference on Harmonics and Quality of Power (ICHQP). Is there a place for power quality in the smart grid? (University Politehnica of Bucharest Romania, 2014), pp. 713–717
2. EU Expert group 1:, Functionalities of smart grids and smart meters. Technical report, EU Commission Task Force for Smart Grids (2009). http://ec.europa.eu/energy/en/topics/markets-and-consumers/smart-grids-and-meters
3. Y Xiao,Communication and networking in smart grids. (CRC Press, Broken Sound Parkway NW, Suite 300, 2012)
4. WK Reder, IEEE smart grid. Part 2: a grand vision for smart grid. Technical report. IEEE (2014). http://smartgrid.ieee.org/education
5. MHJ Bollen, IY-H Gu, PGV Axelberg, E Styvaktakis, Classification of underlying causes of power quality disturbances: deterministic versus statistical methods. EURASIP J. Adv. Signal Process.2007(1), 1–17 (2007) 6. YH Gu, MHJ Bollen, Time-frequency and time-scale domain analysis of
voltage disturbances. IEEE Trans. Power Deliv.15(4), 1279–1283 (2000) 7. MV Ribeiro, CAG Marques, CA Duque, AS Cerqueira, JLR Pereira, Detection
of disturbances in voltage signals for power quality analysis using HOS. EURASIP J. Adv. Signal Process.2007(1), 1–13 (2007)
8. MV Ribeiro, JLR Pereira, Classification of single and multiple disturbances in electric signals. EURASIP J. Adv. Signal Process.2007(1), 1–18 (2007) 9. A Agüera-Pérez, JC Palomares-Salas, JJG de la Rosa, JM Sierra-Fernández,
D Ayora-Sedeño, A Moreno-Muñoz, Characterization of electrical sags and swells using higher-order statistical estimators. Measurement.
44(Issue 8), 1453–1460 (2011)
10. ON Gerek, DG Ece, Power-quality event analysis using higher order cumulants and quadratic classifiers. IEEE Trans. Power Deliv.21(2), 883–889 (2006)
11. ON Gerek, DG Ece, 2-D analysis and compression of power quality event data. IEEE Trans. Power Deliv.19(2), 791–798 (2004)
12. DG Ece, ON Gerek, Power quality event detection using joint 2D wavelet subspaces. IEEE Trans. Instrumentation Meas.53(4), 1040–1046 (2004) 13. O Poisson, P Rioual, M Meunier, Detection and measurement of power
quality disturbances using wavelet transform. IEEE Trans. Power Deliv.
15(3), 1039–1044 (2000)
14. S Santoso, WM Grady, EJ Powers, J Lamoree, SC Bhatt, Characterization of distribution power quality events with fourier and wavelet transforms. IEEE Trans. Power Deliv.15(1), 247–254 (2000)
15. JJG de la Rosa, JM Sierra-Fernández, A Agüera-Pérez, JC Palomares-Salas, A Moreno-Muñoz, An application of the spectral kurtosis to characterize power quality events. Electrical Power Energy Syst.49, 386–398 (2013) 16. JJG de la Rosa, JM Sierra-Fernández, A Agüera-Pérez, JC Palomares-Salas,
A Jiménez-Montero, A Moreno-Muñoz, inProceedings on the IEEE International Workshop on the Applied Measurements for Power Systems
(AMPS),vol. 1. Power quality events’ measurement criteria based in
17. JJG de la Rosa, A Agüera-Pérez, JC Palomares-Salas, JM Sierra-Fernández, A Moreno-Muñoz, A novel virtual instrument for power quality surveillance based in higher-order statistics and case-based reasoning. Measurement.45(7), 1824–1835 (2012)
18. JC Palomares-Salas, JJG de la Rosa, A Agüera-Pérez, A Moreno-Muñoz, Intelligent methods for characterization of electrical power quality signals using higher order statistical features. Przeglad Elektrotechniczny.
2012(8), 236–243 (2012)
19. S Haykin,Neural Networks. (Englewood Cliffs, NJ, 1994)
20. DD Ferreira, CAG Marques, JM de Seixas, AS Cerqueira, MV Ribeiro, CA Duque,Exploiting Higher-Order Statistics Information for Power Quality Monitoring. (InTech Open Science, 2011). http://intechopen.com 21. L Angrisani, P Daponte, M D’Apuzzo, Wavelet network-based detection
and classification of transients. IEEE Trans. Instrumentation Meas.
50(5), 1425–1435 (2001)
22. I Monedero, C León, J Ropero, A García, JM Elena, JC Montaño,
Classification of electrical disturbances in real time using neural networks. IEEE Trans. Power Deliv.22(3), 1288–1296 (2007)
23. M Valtierra-Rodriguez, de Jesus Romero-Troncoso R, RA Osornio-Rios, A Garcia-Perez, Detection and classification of single and combined power quality disturbances using neural networks. IEEE Trans. Ind. Electron.
61(1), 2473–2482 (2014)
24. DD Ferreira, AS Cerqueira, CA Duque, MV Ribeiro, HOS-based method for classification of power quality disturbances. Electron. Lett.45(3), 183–185 (2009)
25. JJG de la Rosa, A Agüera-Pérez, JC Palomares-Salas, A Moreno-Muñoz, Higher-order statistics: discussion and interpretation. Measurement.
46(8), 2816–2827 (2013)
26. Z Liu, Q Zhang, Z Han, G Chen, A new classification method for transient power quality combining spectral kurtosis with neural network. Neurocomputing.125(1), 95–101 (2014)
27. S Mallat,A wavelet tour of signal processing. (Academic Press, Burlington, MA 01803, 2009)
28. J Sola, J Sevilla, Importance of input data normalization for the application of neural networks to complex industrial problems. IEEE Transa. Nuclear Sci.44(3), 1464–1468 (1997)
29. JM Mendel, Tutorial on higher-order statistics (spectra) in signal processing and system theory: theoretical results and some applications. Proc. IEEE.79(3), 278–305 (1991)
30. CL Nikias, JM Mendel, Signal processing with higher-order spectra. IEEE Signal Process. Mag., 10–37 (1993)
31. CL Nikias, AP Petropulu,Higher-Order Spectra Analysis. A Non-Linear Signal Processing Framework. (Prentice-Hall, Englewood Cliffs, NJ, 1993) 32. AK Nandi,Blind Estimation Using Higher-Order Statistics, vol 1,1st edn.
(Kluwer Academic Publishers, Boston, 1999)
33. JJG de la Rosa, A Moreno-Muñoz, Electrical transients monitoring via higher-order cumulants and competitive layers. Przeglad Elektrotechniczny - Electrical Rev.85(10), 284–289 (2009)
34. J Jakubowski, K Kwiatos, A Chwaleba, S Osowski, Higher order statistics and neural network for tremor recognition. IEEE Trans. Biomed. Eng.
49(2), 152–159 (2002)
35. JJG de la Rosa, I Lloret, CG Puntonet, JM Górriz, Higher-order statistics to detect and characterize termite emissions. Electron. Lett.
40(20), 1316–1317 (2004)
Submit your manuscript to a
journal and benefi t from:
7Convenient online submission
7Rigorous peer review
7Immediate publication on acceptance
7Open access: articles freely available online
7High visibility within the fi eld
7Retaining the copyright to your article