LOCALIZED NEGATIVE INTERFERENCE I N BACTERIOPHAGE A'
PAOLO AMATI' AND MATTHEW MESELSON
Biological Laboratories, Haruard Uniuersity, Cambridge, Massachusetts
Received October 5, 1964.
T has been observed in a variety of organisms that the frequency of multiple
I
exchanges between extremely close markers is much greater than the product of the component 2-factor recombination frequencies. This strong correlation, or negative interference, between rare exchanges is not found between exchanges in separated intervals if the separation is made much greater than the average length of a cistron. Accordingly, the phenomenon may be thought of as a tend- ency for exchanges to occur in short clusters on the genetic map. It is referred to as localized negative interference or, less descriptively, high negative inter- ference.Localized negative interference was first extensively studied by PRITCHARD (1955) working with the fungus Aspergillus. I n bacteriophages T2 and T4, its occurrence has been observed by STREISINGER and FRANKLIN (1956) and more fully characterized by CHASE and DOERMANN (1958). W e wish to report the results of crosses which demonstrate the existence and some of the character- istics of localized negative interference in bacteriophage A.
MATERIALS A N D METHODS
Phage strains: All the experiments described below involve crosss between phages marked with the clear plaque mutation cZ6 (MESELSON 1964.) and with the suppressor-sensitive (sus) mutations described by CAMPBELL (1961). Phages carrying sus mutations are able to plate only on certain suppressed strains of E. coli. Assays on unsuppressed indicator bacteria provide a means for selectively scoring sus+ recombinants. According to current theories of coding and suppres- sion, sus mutations result from single nucleotide changes rather than from deletions or other extensive alterations of the wild-type nucleotide sequ-nce. This view is supported by the observa- tion that all Xsus mutants revert. The extend-d host-range mutation h (KAISER 1962) and the minute plaque mutation mi have been used in several crosses. All phage stocks were prepared on strain C600 by the agar layer method.
Bacterial strains: The strains of E . coli K-12 used in these experiments are listed in Table 1.
Procedure for crosses: Strain C600 was used as host for all crosses. A mixture containing 2.5 X IO9 phages of each parent type was added to 1 ml of bacteria which had been grown to saturation in tryptone broth, centrifuged, and resuspended in 0.01 M MgSO, a t a concentration of 5 x IOs cells/ml. Adsorption was allowed to proceed for 10 minutes a t 37". The infected cells were sedimented by centrifugation to remove unadsorbed phages and were resuspended in broth at a concentration of approximately 5 X 10⁶/ml. After aeration for 1 hour at 37", chloroform was added to promote lysis. The lysate was chilled and passed through a membrane filter to remove bacterial debris. A portion of the parental phage mixture used for each cross was assayed
Aided by a grant from the U.S. National Science Foundation.
Present address: International Laboratory of Genetics and Biophysics, Naples, Italy.
370 P. A M A T I A N D M. MESELSON
TABLE 1 Strains of E. coli
Strain Selects against Reference or origin
C600 nonselective
C600.3 h+
W3350 S U S
K/A h + , sus
APPLEYARD 1954 A mutant of C600 CAMPBELL 1958 KAISER 1962
on the nonselective indicator C600 to insure that both parent types were present at approximately equal concentrations.
At least 1000 plaques were scored in each assay of progeny from a cross’. For the scoring of h, phages were pre-adsorbed to strains C600 or W3350 and then plated on either 0 . 3 or K/A, respectively. On these indicators only phages carrying the h allele form plaques. Under the con- ditions employed, the plating efficiencies of A, Ah, and Ah sus on strain C600 are the same as on the respective strains used for selective scoring. Control platings of parental phage mixtures on the various selective indicators provided assurance that neither mutation nor recombination on the plates caused errors in the measurement of recombination frequencies.
Recombination frequencies are given without correction for finite input.
Occasional mottled plaques, containing both c and c f phages, have not been scored. These plaques result from phage heterozygotes (see LURIA 1962). They are found at a frequency of about 5 x 10⁻⁴ among progeny of the cross A x hc,, but are greatly enriched among sus+
progeny from crosses involving close sus markers very near to c2, (MESELSON, unpublished experiments). This is in accord with the current view that primary recombinant phage chromo- somt-s pxsess short heterozygous regions at sites of genetic exchange.
RESULTS
Mapping of the markers: A genetic map of is shown in Figure 1. The arrange- ment of sus complementation classes 0, P, Q, and R with respect to h and c is that given by CAMPBELL (1961). Recombination frequencies between various pairs of markers are compiled in Tables 2 and 3. Phage recombination frequencies a r e rather sensitive to the conditions of crossing. Therefore, although our values were generally found to be reproducible to within approximately 20 percent, they may not agree that closely with values determined by other investigators.
I I I O h C % mi
t
c Z 6 29 8 3 80 73 21 54 5
Y - Y - -r -l
-O P 0 R
INTERFERENCE I N PHAGE
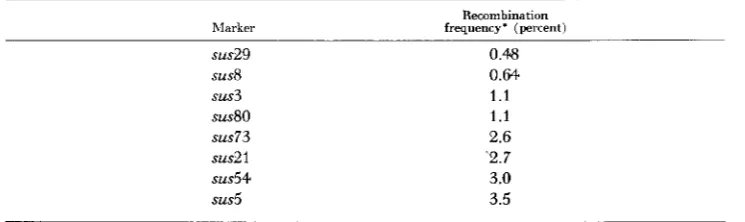
TABLE 2
Two-factor crosses between cZ6 and uarious sus markers
371
hlarker
Recombination frequency* (percent)
sus29
sus8 sus3
sus73
sus21
sus54 sus5
susao
0.48 0.64.
1 . 1 1.1
2.6
-2.7 3.0
3.5
* Each frequency is the average from a pair of two-factor crosses performed with markers in coupling and in repulsion. The recombination frequency is taken as twice the frequency of the sus+ recombinant class.
Complementation tests confirmed CAMPBELL’S grouping of the eight sus
markers 129, 8, 3, 80, 73,21, 54, and 5 into four complementation classes as indi- cated in the figure. The 2-factor recombination frequencies given in Table 2 are in good accord with CAMPBELL’S mapping of these classes. The order of the classes 0, P, Q, and R was additionally confirmed, and markers within the classes 0, P, and Q were ordered on the basis of the segregation of cz6 among sus+ recombi- nants from 3-factor crosses of the type cL6sus, x sus,. The results of these crosses are given in Table 3. The order of the markers sus54 and sus5 has not been established with certainty. In Figure 1, a provisional order is assigned on the basis of the pertinent 2-factor recombination frequencies in Tables 2 and 3.
is shown in Figure 2. For each of 36 different 3-factor crosses, the figure gives the factor
i
by which the proportion of double recombinants exceeds that to be expected for independently occurring exchanges. That is,
i
= R,/(RlR2) (1)where R, and R, are the recombination frequencies in two adjacent intervals and
R, is the frequency of recombination simultaneously in both. It may be noted that according to its definition,
i
may also be looked upon as the factor by which the recombination frequency in one interval is enhanced by selection for recombi- nation in the other. Following HERSHEY (1958), we shall calli
the interference index although it is identical to the quantity Drosophila workers have long referred to as the coefficient of coincidence.The data for ten crosses involving long map intervals are taken from JACOB and WOLLMAN (1954) and KAISER (1955). Their crosses utilize markers which allow the measurement of all three frequencies R I , R,, and R, in the lysate from each three-factor cross.
Of the remaining 26 crosses, 22 involve cZ6 and pairs of sus markers lying to the right of cZ6. The values of R I , R,, and
i
as well as the method of their calcu- lation are given in Table 3. Lastly, by ignoring the segregation of czb, the first four crosses listed in Table 5 may be regarded as three-factor crosses involving triplets of sus markers. The indexi
may be obtained as explained in the table.3 72 P. AMATI AND M. MESELSON
TABLE 3
Three-factor crosses involving cg6 and uarious pairs of sus markers
' 2 6 sus sus
-I
I
I-
RI R2
sus markers
29,8 0.48 0.30 72 4
29,3 0.48 0.51 41 5
29,73 0.48 1.4 18 1
29,21 0.48 1.3 17 1
29,54 0.48 3.3 11 4
8,3 0.64 0.32 28 5
8,80 0.64 0.40 21 3
8,54 0.64 3.5 8 4
3,80 1.1
3,73 1.1
3,21 1.1
3,54 1.1
0.25 35 4
1.35 15 1
1.5 13 1
3.1 8 5
80,73 1.1 1.5 15 2
80,21 1.1 1.1 15 2
80,54 1.1 2.1 11 1
80,5 1.1 3.7 10 2
73,21 2.6 0.08 12 2
73,54 2.6 1.0 8 3
73,5 2.6 1.7 5.5 2
21,54 2.7 1 .0 8 2
21,5 2.7 1.6 6 2
54,5 3.0 0.35 17 2
The recombination frequencies R, and R , are averages for the indicated number of crosses. In most cases, crosses were performed with both possible arrangements of the markers. The marker h was present in some of the above crosses but its segregation is not recorded in the table.
* Values for R, are taken from Table 2.
+
R, is twice the frequency of sus+.1 R , is twice the frequency of the sus+ double recombinant class.
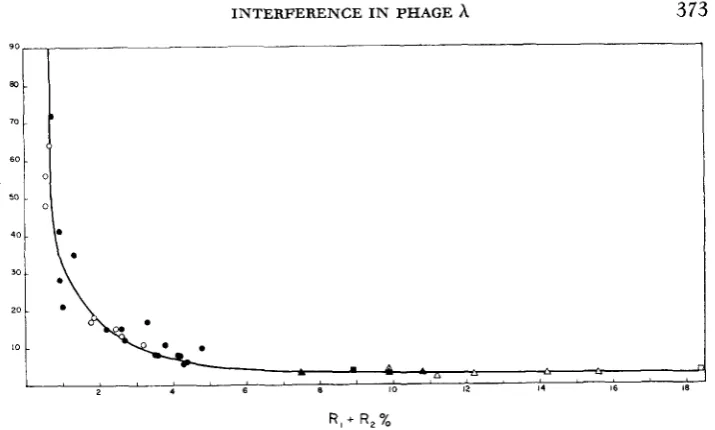
It may be seen in Figure 2 that the value of
i
is a strong inverse function of the length of the interval within which double recombination is selected, rising from a minimum of approximately 3 to values near 100.Localization of the high negative interference: The data of Figure 2 clearly
INTERFERENCE I N P H A G E 3 73
R , + R,%
FIGURE 2.-The relationship of the interference index i to the sum of the component recombi- nation frequencies in each of 36 different three-factor crosses. A Crosses of JACOB and WOLLMAN
(1954). c] Crosses of KAISER (1955). 0 Crosses described in Table 3 and 5 . Filled symbols indi- cate averaged values for crosses performed more than once, usually with markers in different arrangements.
may be made on the basis of the results of crosses presented in Table
4.
Selection for recombination in the short interval between sus3 and sus80 is found to raise the recombination frequency in the adjacent interval c,,-sus3 from the normal value of 1.1 percent to 38 percent, In contrast, recombination in the nonadjacentTABLE 4
The localization of high negative inierference
Twice the Twice the
frequency (%) of the h type
recombinant in the interval h-c,, frequency
( O h 1 of the sus+ type recombinant in the interval c,,-sus3
Cross Unselected Among sus+' Unselected Among sus+*
h c 3 f
+ + + s o
h c + 8 0
+ + 3 +
h + 3 +
+
c+ s o
Average
5.1 28
5.3 23
7.3 31
5.8 25
6.0 27
. .
41
34
33
~~~ ~ ~ ~~~~
* The frequency of recombination between sus3 and sus80 taken as twice the frequency of sus+, was 0.20, 0.21, 0.25,
and 0.24 respectively in the four crosses described in this table:
3 74 P. AMATI A N D M. MESELSON
interval h-cZ6 rises only from 6.0 percent to 127 percent. Thus, selection for re- combination in a short interval increases recombination much more in an adja- cent interval than in a nonadjacent one. In fact, the frequency in the adjacent interval becomes greater than that in the nonadjacent one, whereas without selection the reverse is true. We conclude that the high negative interference observed in h is indeed localized.
High negative interference
in
triple and quadruple exchanges: Several crosseswere performed to determine whether more than two exchanges may occur in a cluster.
In
a multi-factor cross involving several short adjacent intervals, a, b,and c, the recombination frequency in interval a will be greatly enhanced among those phages selected for recombination in the adjacent interval b. However, only if more than two exchanges may occur in a cluster will recombination in interval a be similarly enhanced among phages recombinant in both b and c.
The data of Table
5
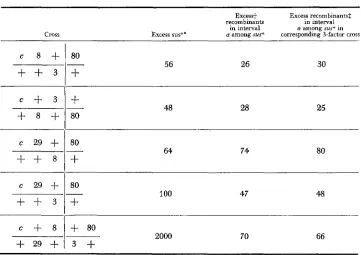
indicate that clusters rather frequently may comprise at least three and even four exchanges. Indeed, the intensity of high negative inter- ference associated with triple and quadruple exchanges appears to be as great asTABLE 5
Negative interference in triple and quadruple exchanges
Cross
+ + 3
c + 3
+ 8 +
c 29
+
c 29
+
+ + 3
c + 8
+
29+
Excess+ Excess recombinants$ recombinants in interval
in interval a among sus+ in Excess SUS+* a among sus* corresponding 3-factor cross
80
+
56 26 30+
-
80 48 28 25
80
_.
+
64 74 8080 -
+
100 47 482000 70 66
+
803 +
* Twice the ratio of the frequency of sus+ to the product of the frequencies in the component sus-sus intervals. The latter are taken from Table 3. These values are presented to show that the adjacent sus-sus intervals are all short enough to exhibit high negative interference in multiple exchanges between them. Note that the values for the first four crosses are simply interference indices as defined by equation (1 ) .
t I n each cross, interval a is that between c2B and the nearest sus marker. The values in this column are the factors by which selection for sus+ increases the recombination frequency in interval a, relative to the frequency without selection given in Table 2.
INTERFERENCE IN PHAGE 3 75 that found for double exchanges, as may be seen by comparing the values in the last two columns of the table. For example, the approximately 70-fold stimulation of recombination in the interval c,,-sus29 which results from selec- tion for recombination in the adjacent interval sus29-sus8 is not significantly changed when selection is made for recombination in all three short intervals sus29-sus8, sus8-sus3, and sus3-sus80.
Our finding of high negative interference in triple and quadruple exchanges is in general agreement with the results of CHASE and
DOERMANN
(1958) and ofPRITCHARD (1 960) in phage T4 and Aspergillus, respectively. It should be noted however that they found the intensity of high negative interference to fall some- what below the value found in three-factor crosses when selection was imposed for a third close exchange.
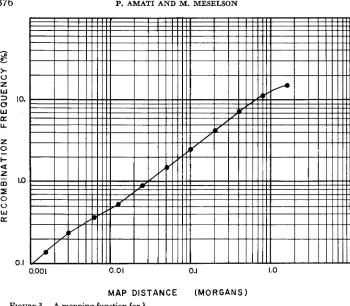
A mapping function for A: The data of Figure 2 may be used to construct a function which transforms recombination frequencies into additive map dis- tances. That is, we may obtain a function giving the number of unit intervals each with recombination frequency R, which may be fitted into any larger inter- val having frequency R. We choose as unit interval R, = 0.01 percent because frequencies of this magnitude and less will be almost perfectly additive if the interference index never rises much above the greatest observed value of approxi- mately 100. This may be seen from the general expression (HALDANE 1919) which relates the frequencies in two adjacent intervals to the frequency for the combined interval
R, = R, f R, - 2i R,R,
where
i
is the interference value defined by equation (1 ).
This relation is exact for recombination frequencies determined in a 3-factor cross and will therefore hold for frequencies measured in separate 2-factor crosses so long as the genetic markers themselves do not influence recombination frequencies.To construct our mapping function, we assume the existence of a continuous interference function i* for the special case R, = R,. Then, we may use equation (2) to find the recombination frequency R (2) for any interval containing two unit intervals
R(2) = 2R, - 2i*RO2
(2)
Next, we use this value of R(2) to compute R ( 4 ) , the frequency for any inter- val containing four unit intervals.
R(4) = 2 R ( 2 ) - 2iSR(2),
3
76 P. AMATI AND M. MESELSONI
0
U W
a
0.00 I 0.01 0.1 1.0
MAP DISTANCE ( M O R G A N S )
FIGURE 3.-A mapping function for A.
of
i
with decreasing interval length should be found to abate-that is, if multiple exchanges are much less likely than single exchanges in such intervals-then a unit interval would correspond to just 0.0001 genetic exchanges. In effect, we assume this to be the case by expressing map lengths in Figure 3 in Morgans rather than in unit intervals, for a Morgan is defined as the map length within which there occurs an average of one genetic recombination (HALDANE 1919). On this basis, 1 O4 unit intervals equal one Morgan.It will be useful in the ensuing discussion to have an estimate of the total map length of h. For this purpose we sum the map lengths of a contiguous set of intervals chosen to span the region between mi and sus1 1, markers known to lie quite near opposite ends of the h chromosome (MESELSON and WEIGLE 1961;
JORDAN
and MESELSON 1964). We have measured recombination frequencies between each adjacent pair of markers in the set mi, ce6, h, sus10, susll. The values are 4.0, 5.5, 4.0, and 1.2 percent respectively. The sum of the correspond- ing map lengths comes to 0.7 Morgans. This value must be regarded as a pro- visional estimate which will require upward revision if, contrary to our assump- tion, the interference index continues to rise sharply with decreasing interval length.DISCUSSION
INTERFERENCE I N PHAGE h 377
of bacteriophage h. But, before discussing our results in detail, it should be empha- sized that they specify the frequency and distribution of exchanges on the genetic map-not necessarily on the chromosome itself. Clearly, incestuous exchanges will not contribute to observed recombination frequencies. Furthermore, any heterogeneity among progeny lines with respect to the opportunity they have had for heterozygous exchange will cause an apparent excess of multiple exchanges even if exchanges are in fact distributed quite randomly among and along prog- eny chromosomes (VISCONTI and DELBRUCK 1953; HERSHEY 1958). Such heterogeneities are likely to be responsible for at least part of the low negative interference which we have noted and which is characteristic of all phage crosses involving long map intervals. More insidious heterogeneities may be imagined to give rise even to localized high negative interference. For example, sufficiently poor mixing of phage chromosomes in the vegetative pool might limit heterozy- gous exchanges to rather short intervals even though exchanges in general may be distributed at random along each chromosome. Although we regard this as an unlikely explanation of localized high negative interference, the present experi- ments are unable to rule it out.
Keeping in mind the above reservations concerning the physical interpretation of our results, we shall attempt to calculate some characteristics of the distribu- tion of genetic exchanges along the h map. I n doing this we must assume that there exists a distribution independent of what part of the map is examined and of what markers are used in crosses (so long as only point mutations are used). W e shall first estimate the mean number of clusters accumulated along a progeny lineage. The mean number of exchanges per cluster may then be obtained as the ratio of the mean total number of exchanges to the mean number of clusters.
As may be seen in Figure 2, high negative interference is found only for recombination within relatively short intervals. This suggests an approximation to the actual map distribution of exchanges that should be adequate to describe recombination between distant markers. In this approximation, each recombinant cluster is replaced by a single exchange and nonrecombinant clusters are omitted. The mean number of such single exchanges accumulated per progeny lineage may be computed as the sum of the map lengths of a set of adjacent long intervals which span the h map. Each map length M may be found from the corresponding observed recombination frequency R according to the relation
-1
2i
M = -1, (1
-2iR)
( 3 )derived by
HALDANE
(1919) from equation(e)
on the condition thati
is constant. Aside from this restriction, the use of equation (3) is essentially equivalent to the more cumbersome iterative numerical method we have introduced above for the construction of Figure 3.378 P. A M A T I A N D M. M E S E L S O N
length we shall calculate from equation (3) is relatively insensitive to the value of
i
over the rangei
= 3 toi
= 0, the lowest possible value. For these limiting cases, the sums of the map distances between adjacent markers in the set sus1 1-suslO-h-c,,-mi are 0.1 7 and 0.15 Morgans, respectively. We conclude that there is an average of approximately 0.16 recombinant clusters per progeny lineage. If the number of exchanges per cluster is about equally likely to be even or odd, the total mean number of clusters, both recombinant and nonrecombinant, is approximately 0.32. It should be noted that the foregoing treatment counts isolated single exchanges as clusters.
Since this estimate refers to the number of clusters on the g-netic map, not on the chromo- some, incestuous exchanges do not contribute. If exchanges occur without regard to genotype in a phage pool containing equal numbers of both parental types, half of all exchanges will be incestuous. Actually, the proportion of incestuous exchanges will be greater than one half becaus-, for a variety of reasons, the ratio of parental types vanes significantly from one phage pool to another (s-e HERSHEY 1958). Thus, the number of clusters pzr linsage on the chromosome must be more than twice the number of clustxs per lineage o n the genetic map.)
With the aid of the mapping function of Figure 3, we computed a lower bound of 0.7 for the mean number of exchanges per progeny lineage. If these are grouped into 0.32 clusters, we arrive at a mean of at least 2.2 exchanges per cluster.
Finally, we may define a characteristic cluster length as the map distance at which the interference index attains its greatest rate of increase. If we assume that such an inflection does occur, our data indicate that it lies at or below approximately 0.02 Morgans, as may be judged from Figures 2 and 3. Accord- ingly, we may take this to be an upper bound for the characteristic cluster length. If map distances are proportional to distances along the h chromosome, this corresponds to approximately 1,500 nucleotide pairs. However, a suggestion that not all clusters are confined to the same length lies in our observation that the intensity of high negative interference does not decline in close triple and quad- ruple exchanges which span a total interval at least several times longer than the maximum characteristic cluster length.
Although the various estimates we have made above are consistent with the available data, the picture they give of the clustering responsible f o r localized negative interference is only approximate and in any case may have to be revised with the extension of crosses to shorter intervals. Some reassurance that our computations are not outrageously misleading may be found in the fact that esti- mates for the physical length and the mean number of exchanges associated with clusters in Aspergillus (PRITCHARD 1960) and in phage T4 (BARRICELLI and DOERMANN 1960; STAHL, EDGAR, and STEINBERG 1964) are not radically differ- ent from those we have computed for h.
S U M M A R Y
INTERFERENCE I N PHAGE 3 79
function constructed from interference data obtained in three-factor crosses, it is estimated that an average of approximately 0.3 clusters, each with an average of about two exchanges, are accumulated along a progeny lineage. Multi-factor crosses indicate that some clusters contain as many as four exchanges. If map lengths are proportional to distances along the DNA molecule, it may be esti- mated that a cluster is confined to an average length of approximately 1,500 nucleotides or less. These results are consistent with previous findings in Asper- gillus and bacteriophage T4.
LITERATURE CITED
APPLEYARD, R. K., 1954
BARRICELLI, N. A., and A. H. DOERMANN, 1960
Segregation of new lysogenic types during growth of a double lysogenic
An analytical approach to the problems of phage recombination and reproduction. 11. High negative interference. Virology 11 :
1 3 6 1 55.
strain derived from Escherichia coli K12. Genetics 39: 440-452.
CAMPBELL, A., 1958 The different kinds of transducing particles in the A-gal system. Cold Spring Harbor Symp. Quant. Biol. 23: 83-84. ~ 1961 Sensitive mutants of bacteriophage A.
Virology 14: 22-32.
genetic structure of bacteriophage T4. Genetics 43: 332-353. CHASE, M., and A. H. DOERMANN, 1958
HALDANE, J. B. S., 1919
High negative interference over short segments of the
The combination of linkage values, and the calculation of distances
The production of recombinants in phage crosses. Cold Spring Harbor
Rtude gCnCtique d'un bactbriophage temper6 d'Escherichia A discrepancy between the physical and the genetic maps
A genetic study of the temperate coliphage lambda. Virology 1 : 424-443. The production of phage chromosome fragments and their capacity for genetic between the loci of linked factors. J. Genet. 8: 299-309.
HERSHEY, A. D., 1958
Symp. Quant. Biol. 23: 19-46. JACOB, F., and E. WOLLMAN, 1954
coli. 11. MCcanisme de la recombinaison gkndtique. Am,. Inst. Pasteur 87: 1-17. JORDAN, E., and M. MESELSON, 1965
of bacteriophage lambda. Genetics 51: 77-86. KAISER, A. D., 1955
-
transfer. J. Mol. Biol. 4: 275-287. 1962
LURIA, S. E., 1962 MESELSON, M., 1964
MFSELSON, M., and J. WEIGLE, 1961 PRITCHARD, R. H., 1960
Genetics of bacteriophagz. Ann. Rev. Microbiol. 16: 205-240.
On the mechanism of genetic recombination between DNA molecules. J. Mol. Biol. 9 : 734-745.
Chromosome breakage accompanying genetic recombina- tion in bacteriophage. Proc. Natl. Acad. Sci. U.S. 47: 857-868.
Localized negative interference and its bearing on models of gene reccmbination. Genet. Res. 1: 1-24. ~ 1955 The linear arrangement of a series of
alleles in Aspergillus nidulans. Heredity 9: 343-371.
The linkage map of bacteriophage T4. Genetics 5 0 : 539-552.
Mutation and recombination at the host range The mechanism of genetic recombination in phage. STAHL, F., R. S. EDGAR, and J. STEINBERG, 1964
STREISINGER, G., and N. C. FRANKLIN, 1956 VISCONTI, N., and M. DELBRUCK, 1953