Temporal and Spatial Variations in Electron Density and
Blackbody Temperature in the Initial Phase of a Laser Ablation
BN Plasma
Koichi SASAKI, Shin YASUDA
1)and Noriharu TAKADA
1)Plasma Nanotechnology Research Center, Nagoya University, Furo-cho, Chikusa-ku, Nagoya 464-8603, Japan
1)Department of Electrical Engineering and Computer Science, Nagoya University,
Furo-cho, Chikusa-ku, Nagoya 464-8603, Japan
(Received 25 February 2008/Accepted 27 March 2008)
Optical emission spectroscopy was used for examining the temporal variations in the spatial distributions of the blackbody temperature and electron density of plasmas produced by laser ablation of a BN target in ambi-ent nitrogen gas. The blackbody temperature was estimated by fitting the continuum componambi-ent in the optical emission spectrum using the Planck’s law of radiation, and the electron density was evaluated from the Stark broadening of a line emission of a B atom. The blackbody temperature was evaluated to be close to 104K and
the electron density was on the order of 1017-1018cm−3, immediately after the irradiation of the laser pulse on
the target. The dynamics of the blackbody temperature and the electron density were understood by considering plasma expansion and the confinement effect of ambient gas.
c
2008 The Japan Society of Plasma Science and Nuclear Fusion Research
Keywords: electron density, blackbody temperature, spatiotemporal variation, optical emission spectroscopy, laser ablation plasma
DOI: 10.1585/pfr.3.023
1. Introduction
Remarkable features of a laser ablation plasma in comparison with a discharge plasma are the high density, the high temperature, and the high pressure particularly in the initial phase after the irradiation of a laser pulse onto a solid-state target. These features should have positive effects in the synthesis of crystalline nanoparticles. There-fore, it is important to evaluate the density and tempera-ture of a laser ablation plasma, and understand their ef-fects on material syntheses. Since laser-ablation plasma has a fast temporal variation and a dynamic spatial dis-tribution, any diagnostic methods applicable to laser abla-tion plasma should have fine temporal and spatial resolu-tions. To date, optical emission spectroscopy is exclusively applied to measure electron densities, electron tempera-tures, and blackbody temperatures of laser-ablation plas-mas [1–5].
Recently, Komatsu and coworkers succeeded in syn-thesizing sp3-bonded BN of the 5H polytypic form by laser
ablation of a BN target in an ambient NH3 plasma [6, 7].
This sp3-bonded 5H-BN is a new material, and is a semi-conductor with a wide band gap corresponding to photolu-minescence at a wavelength of 225 nm [6]. This material can yield strong electron field emission [7]. Although the synthesis mechanism of 5H-BN is not yet understood, it is speculated that the high-temperature, high-pressure plasma
author’s e-mail: [email protected]
produced by laser ablation of a BN target is responsible for the growth of the high-pressure phase sp3-bonded crystal structure. In this study, we examine the blackbody temper-ature and electron density of a laser-ablation BN plasma by optical emission spectroscopy. For understanding the dynamics of laser-ablation plasma in the initial phase, we conducted measurements with temporal and spatial resolu-tions.
2. Experiment
We used the experimental apparatus shown in Fig. 1. A stainless-steel vacuum chamber was evacuated below 3×10⁻⁶Torr using a turbomolecular pump. After evacua-tion, pure N2gas was introduced at a flow rate of 100 sccm
from the bottom of the chamber. The gas pressure was con-trolled from 0 to 10 Torr by changing the evacuation rate using a variable conductance valve. A sintered BN target was installed on a rotating holder in the vacuum chamber. YAG laser pulses at a wavelength of 266 nm irradiated the BN target from the normal direction. The energy, repeti-tion rate, and durarepeti-tion of the YAG laser pulses were 37 mJ, 10 Hz, and 8 ns, respectively. The YAG laser beam was focused using a lens, and the fluence on the target surface was estimated to be 3 J/cm2.
Another lens was used to project the optical emission in front of the target onto an optical fiber array. The opti-cal fiber array consisted of 20 linearly-aligned cores, and
c
2008 The Japan Society of Plasma
Fig. 1 Experimental apparatus.
was positioned to observe the axial distribution of the op-tical emission. The other end of the opop-tical fiber array was placed close to the entrance slit of the monochromator with a focal length of 500 mm. We used gratings with 600 and 2400 grooves/mm, that corresponded to wavelengths res-olutions of 0.2 and 0.05 nm, respectively. The exit side of the monochromator was connected to a charge-coupled device camera with a gated image intensifier (ICCD cam-era), which recorded optical emission spectra at various distances from the target surface. The gate width was 10 ns. The wavelength dependence of the sensitivity of the monochromator including the ICCD camera was cal-ibrated using a standard tungsten lamp. The spatial reso-lution corresponding to each core of the optical fiber array was 0.25 mm. The temporal variations in the optical emis-sion spectra were obtained by changing the delay time be-tween the irradiation of the YAG laser pulse and the trigger to the gate of the ICCD camera. We accumulated spectra from 50 laser shots to improve the signal-to-noise ratio and compensate for poor shot-to-shot reproducibility.
3. Results and Discussion
3.1
Optical emission spectrum and data
analysis
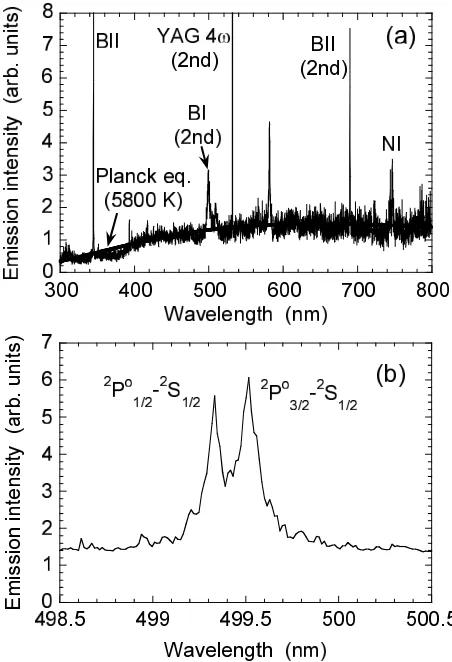
A typical optical emission spectrum in the range from 300 to 800 nm is shown in Fig. 2 (a). This spectrum was obtained without the injection of N2 gas (0 Torr), 50 ns
after the irradiation of the YAG laser pulse. The grating with 600 grooves/mm was used. The measurement po-sition was 1 mm from the target. The optical emission spectrum was composed of several line emissions, which were assigned as BII (345.13 nm, the1Po
1-1D2 transition),
BI (249.68 and 249.77 nm, the2Po
1/2-2S1/2and2Po3/2-2S1/2
transitions), and NI (742.36, 744.23, and 746.83 nm, the
4P
1/2-4So3/2, 4P3/2-4So3/2 and4P5/2-4So3/2 transitions). The
line emission at around 582 nm may be due to an impurity, and its most probable assignments are CI and CII. Second-order diffraction of the YAG laser light was also detected.
As shown in Fig. 2 (a), the spectrum contained a broad continuum component. This continuum emission was be-lieved to be due to blackbody radiation. Under the
assump-Fig. 2 Optical emission spectra observed in vacuum, 50 ns after irradiation of the YAG laser pulse. The mea-surement position was 1 mm from the target surface. (a) The wide-range spectrum observed using a grating with 600 grooves/mm. The thick solid curve represents the Planck’s law of radiation corresponding to a black-body temperature of 5800 K. (b) The fine-resolution spectrum of the BI (2Po-2S) line observed using a
grat-ing with 2400 grooves/mm.
tion of the blackbody radiation, the continuum component is approximated using the Planck’s law of radiation. The thick solid curve shown in Fig. 2 (a) represents the Planck’s law of radiation corresponding to a blackbody temperature of 5800 K. The continuum component was well approxi-mated using the Planck’s law of radiation. Thus, we eval-uated the blackbody temperature of the plasma by optical emission spectroscopy.
Figure 2 (b) shows a fine-resolution spectrum of the BI (2Po-2S) line observed using a grating with
elec-tron densityne(in cm−3), which includes the electron
im-pact width parameterWand the ion broadening parameter
A[3], and is given by
Δλ1/2 =2W
n
e
1016
+3.5A
n
e
1016 1−
3 4N
−1/3 D
W
n
e
1016
, (1)
whereNDis the number of particles in the Debye sphere.
Although the overlapping of the two fine-structure compo-nents was problematic, we considered that the analysis of the BI (2Po-2S) line was the best choice for evaluating the
electron density in the line emissions shown in Fig. 2 (a). The spectrum shown in Fig. 2 (b) was separated into two fine-structure components having the same width using a curve-fitting software. The instrumental broadening was deconvoluted for evaluating the Stark broadening width. The electron impact width parameter and the ion broad-ening parameter of the BI (2Po-2S) line are listed in the
literature [8–10]. We assumed an electron temperature of 10 eV for estimating the electron density, since we did not evaluate the electron temperature from the optical emission spectrum. The assumption of 10 eV is based on a report on the electron temperature of a laser ablation plasma [11]. If we assume an electron temperature of 1 eV, the elec-tron density becomes roughly three times that evaluated at 10 eV. We thus evaluated the electron density of the plasma by optical emission spectroscopy.
3.2
Blackbody temperature
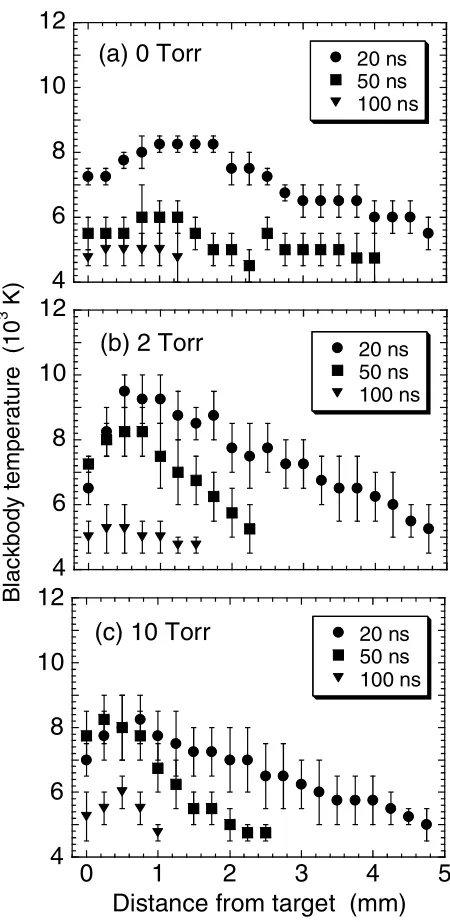
Figure 3 shows the temporal variation in the spatial distribution in the blackbody temperature. This result was obtained by repeating the data analysis at various measure-ment positions and delay times, after the irradiation of the YAG laser pulse. The error bars illustrated in Fig. 3 repre-sent the ambiguity in the fitting between the spectral distri-bution of the continuum component and the Planck’s law of radiation. As shown in Fig. 3, the blackbody temper-atures at delays within 100 ns were approximately 5000-10000 K. The evaluation of the blackbody temperature was difficult after 100 ns because of the low amplitude of the continuum component in the optical emission spectra.
When nitrogen gas was not injected (0 Torr), as shown in Fig. 3 (a), the spatial distribution of the blackbody tem-perature 20 ns after irradiating the YAG laser pulse had a peak at a distance of approximately 1.4 mm from the tar-get surface. The spatial distribution was rather confined even in the initial phase (20 and 50 ns). In contrast, at gas pressures of 2 and 10 Torr, the blackbody temperature had steep distributions, as shown in Figs. 3 (b) and 3(c). The peak positions were 0.8 and 0.4 mm from the target at gas pressures of 2 and 10 Torr, respectively. In other words, the peak position was closer to the target at a higher gas pressure. In addition, as shown in Fig. 3, the temporal de-crease in the blackbody temperature at the peak position was slower at a higher gas pressure, whereas at a long
dis-Fig. 3 Temporal variation in the spatial distribution of the black-body temperature observed at gas pressures of (a) 0 Torr, (b) 2 Torr, and (c) 10 Torr.
tance from the target, the decrease in the blackbody tem-perature was roughly independent of gas pressure.
3.3
Electron density
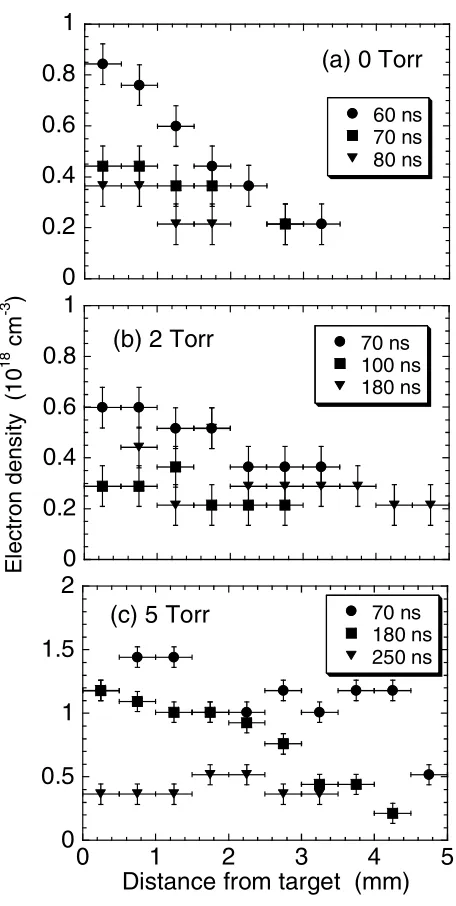
gov-Fig. 4 Temporal variation in the spatial distribution of the elec-tron density observed at gas pressures of (a) 0 Torr, (b) 2 Torr, and (c) 5 Torr.
erned by the continuum component. As shown in Fig. 4, we evaluated the electron density as being on the order of 1017-1018cm−3.
The electron density in the initial phase had a peak adjacent to the target surface and a steep decrease as the distance from the target increased. At long delay times (180 ns at 2 Torr, and 250 ns at 5 Torr), the spatial distribu-tion of the electron density became uniform. The temporal decay of the electron density was much slower at higher gas pressures as shown in Fig. 4.
3.4
Discussion
Although the spectra including both line and contin-uum emissions, as shown in Fig. 2 (a), were observed at
delay times ranging from 50 to 100 ns, there is a possibility that the line and continuum components are emitted from different parts of the plasma. This is because the optical emission spectrum before 50 ns is governed by the con-tinuum component, whereas only line emissions were ob-served in the optical emission spectrum after 100 ns. This result suggests that the continuum and line emissions are observed from dense and rarefied plasmas, respectively. Considering the radial distribution of the plasma density, the continuum component shown in Fig. 2 (a) may be emit-ted from the central part that has a high density, whereas the line emissions may be from the peripheral region that has a rarefied density. However, even if the continuum and line emissions do not represent the behavior of the entire region, it would be possible to present a brief discussion on the dynamics of the laser ablation plasma based on the results of optical emission spectroscopy.
The dynamics of the blackbody temperature and elec-tron density are basically understood by considering the expansion of the plasma and the confinement effect of am-bient gas. The blackbody temperature in amam-bient gas had a steeper distribution than in vacuum, which is attributed to the confinement of the plasma by ambient gas. The slower temporal decay of the blackbody temperature is also un-derstood by assuming that adiabatic expansion is the dom-inant cooling mechanism of the plasma. Plasma expansion is restricted in ambient gas, resulting in the longer decay time constant of the blackbody temperature. Although col-lisions with ambient gas would contribute to a relatively rapid decrease in the blackbody temperature at a long dis-tance from the target, the dominant cooling mechanism of the initial-phase laser-ablation plasma is considered to be adiabatic expansion.
Since a volume loss of electrons by recombination is not expected in the early-phase (< 250 ns) of a laser-ablation plasma [4], the temporal variation in the spatial distribution of the electron density shown in Fig. 4 is also understood by plasma expansion and confinement. The longer decay time constant of the electron density at a higher gas pressure is consistent with the confinement ef-fect of ambient gas. The highest electron density at a gas pressure of 5 Torr, as shown in Fig. 4 (c), has not yet been understood; however additional ionization by collision of confined electrons would probably enhance the electron density.
4. Conclusions
We investigated blackbody temperatures and electron densities of laser-ablation BN plasmas by optical emis-sion spectroscopy. Temporal and spatial variations in the blackbody temperature and electron density were exam-ined using a linearly-aligned optical fiber array and a gated ICCD camera. The blackbody temperature 20 ns after ir-radiation of the YAG laser pulse was approximately 104K.
-1018cm−3. The temporal and spatial variations in the blackbody temperature and electron density are basically understood by considering plasma expansion and the con-finement effect of ambient gas.
[1] F.J. Gordillo-V´azquez, A. Perea, A.P. McKiernan and C.N. Afonso, Appl. Phys. Lett.86, 181501 (2005).
[2] S.S. Harilal, B. O’Shay and M.S. Tillack, J. Appl. Phys.98, 013306 (2005).
[3] N.M. Shaikh, B. Rashid, S. Hafeez, Y. Jamil and M.A. Baig, J. Phys. D: Appl. Phys.39, 1384 (2006).
[4] S. Namba, R. Nozu, K. Takiyama and T. Oda, J. Appl. Phys.99, 073302 (2006).
[5] S. Amoruso, R. Bruzzese, N. Spinelli, R. Velotta, M. Vitiello and X. Wang, Appl. Phys. Lett.84, 4502 (2004).
[6] S. Komatsu, K. Kurashima, H. Kanda, K. Okada, M. Mitomo, Y. Moriyoshi, Y. Shimizu, M. Shiratani, T. Nakano and S. Samukara, Appl. Phys. Lett. 81, 4547 (2002).
[7] S. Komatsu, A. Okudo, D. Kazami, D. Golberg, Y.B. Li, Y. Moriyoshi, M. Shiratani and K. Okada, J. Phys. Chem. B 108, 5182 (2004).
[8] H.R. Griem, Plasma Spectroscopy (McGraw-Hill, New York, 1964).
[9] H.R. Griem, Principles of plasma spectroscopy (Cam-bridge University Press, Cam(Cam-bridge, 1997).
[10] H.R. Griem, Spectral line broadening by plasmas (Aca-demic Press, New York, 1974).