Plasma and Fusion Research: Regular Articles Volume 3, 018 (2008)
Development of a Plasma Diagnostics System Using an Impulse
Waveform Voltage
Tokihiko TOKUZAWA, Kazuo KAWAHATA, Yasuhiko ITO, Kenji TANAKA, Ichihiro YAMADA
and LHD Experimental Group
National Institute for Fusion Science, Toki 509-5292, Japan
(Received 30 November 2007/Accepted 7 March 2008)
A new application using an electric impulse signal has been developed for electron density profile measure-ments in the Large Helical Device (LHD). Using an impulse waveform voltage, which has broadband frequency components, we constructed an ultrashort pulsed radar reflectometer with 28 channels in X-, Ka-, and U-band frequency components. The effect of the bandwidth of an inline band-pass filter was investigated, and was opti-mized. For a multiple-channel and multiple-frequency band system, a new switching technique and multiplexer were developed. Using the Abel inversion method, the reconstructed electron density profile was obtained from the delay time as a function of the probing frequency. Good agreement with other diagnostics was obtained.
c
2008 The Japan Society of Plasma Science and Nuclear Fusion Research
Keywords: impulse, microwave radar, electron density profile, microwave reflectometer, LHD DOI: 10.1585/pfr.3.018
1. Introduction
An impulse waveform voltage can be utilized for electron density profile measurements in high-temperature plasma, because it has broad band frequency components in Fourier space. This means that one electric impulse signal can replace a broadband microwave source. For example, when we use a 10-ps full-width half-maximum (FWHM) impulse, frequency components up to 100 GHz are produced. This impulse is used for producing a pulsed radar for plasma density measurements, which is known as an ultrashort pulsed radar reflectometer [1–3]. Because the radar measurement is conducted over a very short period of time, the plasma can be treated as a stationary object. This means that the effect of fluctuations in the cut-offlayer in one frequency scanning period can be ignored. In addi-tion, this ultrashort pulsed radar reflectometer system uses a time-of-flight (TOF) measurement technique. The TOF measurements have the advantage that the ordinary and ex-traordinary polarization of each component in the reflected wave are distinguishable by the time lag.
In the Large Helical Device (LHD) [4], we developed ultrashort pulsed radar reflectometer systems using two im-pulse generators. One source was a Picosecond Pulse Labs, Model 4015C Impulse Generator with a Model 5208 Im-pulse Forming Network, which generates a voltage im-pulse with an amplitude of−2.2 V and FWHM of 23 ps. The other source was a Model 4016 Impulse Generator with a Model 5206 Impulse Forming Network, which gen-erates an impulse with and an amplitude of−2.0 V ampli-tude and FWHM of 18 ps. These impulse waveforms and frequency spectra are shown in Fig. 1. Initially, we
con-author’s e-mail: [email protected]
structed a six-channel Ka-band (26-40 GHz) microwave reflectometer using a 23-ps impulse [5]. Then, for more de-tailed and wider-ranging profile measurements, the system was upgraded with the addition of multiple spatial chan-nels and frequency bands.
In Sec. 2 of this paper, we describe the current ultra-short pulsed radar reflectometer system in the LHD, and the experimental procedure for estimating a suitable band-width for the inline band-pass filter (BPF). For the system consisting of multiple channels and bands, the new switch-ing technique and multiplexer are presented in Sec. 3. The resultant density profile measured using this reflectometer and the comparison with other diagnostic results are de-scribed in Sec. 4. We summarize the results in Sec. 5.
2. Ultrashort Pulsed Radar
Reflec-tometer System
The schematic of the ultrashort pulsed radar reflec-tometer system is shown in Fig. 2. A Model 4016 Im-pulse Generator with an amplitude of−2.0 V and FWHM of 18 ps is utilized as an initial source. For obtaining the desired frequency components from this impulse, we uti-lize the standard rectangular waveguide. When the impulse is launched into the waveguide, it is transformed into a chirped wave that includes broad frequency components of the standard base band. This is caused by the disper-sion of electromagnetic wave in the waveguide. The group velocityυgin the waveguide is described by
υg=c1−(λ/2a)2. (1) Here,cis the speed of light,ais the long side length of the rectangular waveguide, andλis the wavelength of the
c
2008 The Japan Society of Plasma
Fig. 1 Waveform of an impulse from (a) PSPL-4015C (FWHM:23 ps) and (b) PSPL-4016 (FWHM:18 ps), and (c) those frequency spec-tra.
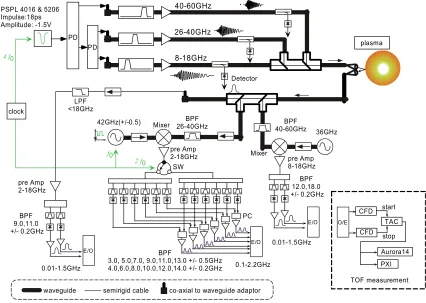
Fig. 2 Schematic view of ultrashort pulsed radar reflectometer system. PD is a power divider, PC is a power combiner, and SW is a single-pole double-throw switch.
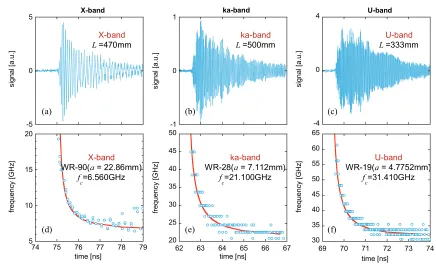
electromagnetic wave in vacuum. The chirped wave out-put from the waveguide is shown in Figs. 3 (a-c), and the resultant frequency components are shown in Figs. 3 (d-f). Here, the frequency is analyzed using the zero-crossing method. The frequency component gradually decreases, and is almost in agreement with the value calculated using
X-Plasma and Fusion Research: Regular Articles Volume 3, 018 (2008)
Fig. 3 (a-c) Chirped waveform through each standard rectangular waveguide. (d-f) Temporal evolution of frequency components of each chirped signal (open circles) and calculated values (line). (a, d) X-mode, (b, e) Ka-band, (c, f) U-band.
band, Ka-band, and U-band. Each frequency component is amplified by a corresponding microwave power amplifier, and combined to one transmission line.
The combined chirped microwave is launched into the plasma. The incident wave reflects back from the cut-off layers corresponding to each frequency component. The reflected wave is divided and directed to the detection stage of each frequency band. The X-band frequency compo-nents are detected directly through two band-pass filters of 9 and 11 GHz. The Ka-band and U-band components are detected by a super heterodyne detection system. In the mixer, the reflected wave is downshifted by the fre-quency of a local microwave oscillator. The oscillator frequencies for the Ka-band and U-band components are approximately 42 and 36 GHz, respectively. For the Ka-band, the output from the mixer is amplified by an inter-mediate frequency (IF) amplifier, and then led to a single-pole double-throw (SPDT) switch. Each IF signal is fil-tered by 12 BPFs, whose center frequencies range from 3 to 14 GHz. Twelve signals are detected by Schottky-barrier diode detectors to obtain the reflected signal pulses. For the U-band, two BPFs with center frequencies of 12 and 18 GHz are utilized.
The detected pulses are amplified by pulse amplifiers and led to electro-optical (E/O) converters, after which the TOF measurement is conducted. For discriminating the reflected pulse, we utilize constant fraction discriminators (CFD) because the pulse amplitude changes during the plasma discharge. A fraction of the incident wave is ex-tracted using a directional coupler, its power is measured,
and this wave is used as a reference pulse. Both the refer-ence pulse as the start signal and the reflected pulse as the stop signal are led to a time-to-amplitude converter (TAC). The output voltage of the TAC is proportional to the time difference between the start and the stop signals. The spa-tial precision estimated from the TAC output was previ-ously tested, and was found to be less than 6 mm [6].
Figure 4 shows the cross section of the LHD and the transmission path in the vacuum vessel. The transmission line comprises two corrugated waveguides to avoid trans-mission losses. At the tip of the waveguide, a mirror is attached and used as a launcher towards the plasma center. Since this launcher is located around a groove in the heli-cal coil, the microwave is launched from the high-magnetic field side. The reflected wave is received by another cor-rugated waveguide using a mirror. These waveguides are wrapped in a carbon sheath to protect them from heat dam-age, since the waveguides cross the diverter leg region.
Fig. 4 Cross section of LHD and transmission line in the vacuum vessel.
Fig. 5 Temporal evolution of (a) magnetic axis, (b) line aver-aged density, and (c) time of flight of reflected pulse.
plasma discharge, in which the magnetic axis is swept pe-riodically every 108 seconds. It was observed that the elec-tron density layer of 1×10¹⁸m−3also changes every 108
seconds. We can therefore successfully obtain the entire time evolution.
Plasma and Fusion Research: Regular Articles Volume 3, 018 (2008) field strength is changed such that the ECE layer does not
cross the line of sight. Figure 7 (b) shows the accuracy of the TOF measurement as a function of the bandwidth of
Fig. 6 Normalized waveform of detector output pulse through each BPF, the center frequency of which is 30 GHz.
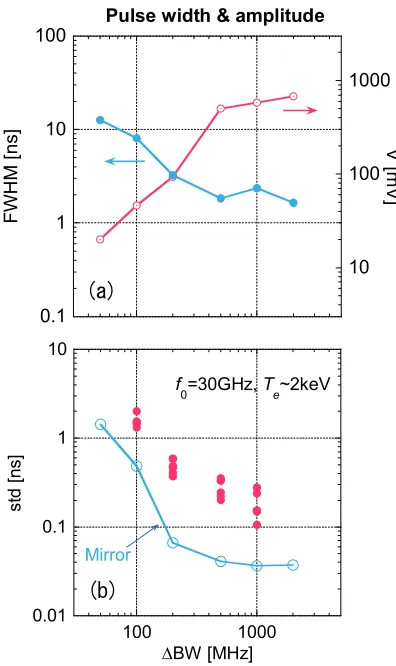
Fig. 7 (a) Pulse width and amplitude of each BPF. (b) Uncer-tainty of TOF measurement. Mirror reflection (open cir-cles) and plasma experiment (closed circir-cles).
BPF. When the microwave reflects from the mirror tar-get, the standard deviation (std) of TOF measurement is also plotted. When the bandwidth is over 200 MHz, it is seen that the uncertainty becomes sufficiently small. The minimum value is approximately 40 ps in this TOF mea-surement system. On the other hand, when the bandwidth is less than 100 MHz, the uncertainty increases abruptly, because the pulse width in the time domain is very large for the temporal response of the current CFD in the TOF measurement system. Therefore, a bandwidth of 500 MHz is selected for the present use.
3. The
Development
of
a
Multi-Channel
and
Multi-Frequency
Band System
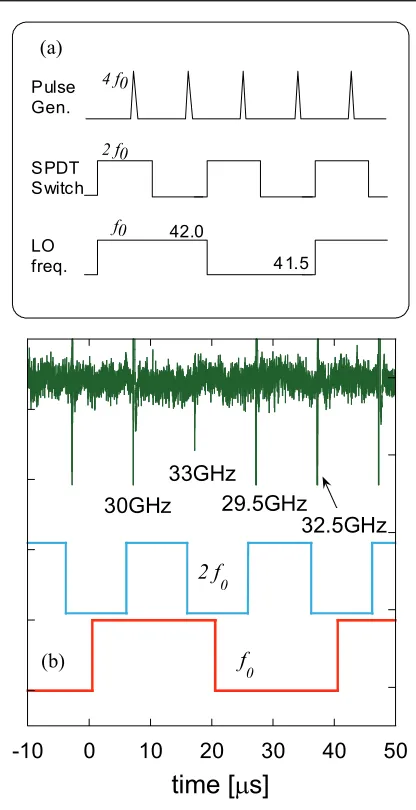
For utilizing broadband frequency components de-rived from an impulse, we developed several measure-ment techniques. Among them is a switching technique, which is applied to the multi-channel system in the Ka-band. Figure 8 (a) shows the timing diagram of the switch-ing operation. The frequency of the local oscillator is var-ied from 41.5 to 42.0 GHz with a repetition rate of f0. A SPDT switch is operated at a repetition rate of 2f0, with the impulse repetition rate of 4f0, which is generally 100 kHz. The frequency components of the detector output are then changed four times for each cycle of the oscilla-tor frequency. For example, when the 9 and 12 GHz BPFs are paired, the measurable frequencies of the incident mi-crowave components are 29.5, 30.0, 32.5, and 33.0 GHz. One important advantage is that there is no need for addi-tional TOF measurement electronics, such as CFDs, TACs, or E/O converters. An example of the frequency switching operation is shown in Fig. 8 (b). When the local frequency is fixed at 42.0 GHz, the 9-GHz BPF, which has an inci-dent frequency component of 33 GHz, is located behind a 6-way divider and the 12-GHz BPF, which has an incident frequency component of 30 GHz, is located behind another divider. When the level of the switching signal is high, only the 30-GHz signal is passed. The same discriminator then collects both the 30- and 33-GHz signals.
correspond-Fig. 8 (a) Timing diagram of switching operation. The fre-quency of the local oscillator is changed from 41.5 to 42.0 GHz with the repetition rate off0. The SPDT switch is operated with a 2f0repetition rate. (b) Example of the frequency switching operation.
ing waveguide, and detected beyond the combined and di-vided region. Therefore, the loss from all the frequency components becomes lower than that from the previous di-rectional coupler system. In the case of the U-band, the improvement is approximately 10 dB.
4. Density Profile Measurements
The ultrashort pulsed radar reflectometer system oper-ates with an ordinary-mode polarization, and has 28 chan-nels consisting of 2 chanchan-nels in the X-band, 24 chanchan-nels in the Ka-band and 2 channels in the U-band. The mea-sured flight time of each frequency pulse reflected from the plasma is expressed byτp(ω0)= dφ(ω)
dω
ω=ω0 =2
c
rc(ω0)
ra
1
1−ω2pe(x) ω2
0
dx,
(2)
Fig. 9 (a) Picture of the multiplexer. (b) Transmissivity of each frequency component.
whererais the edge of the plasma,cis the velocity of the light,ω0 is the probing frequency,ωpe is the plasma fre-quency, andrc(ω0) is the position where the plasma
fre-quency equals the probing frefre-quency. The measured delay timeτmis expressed byτm=τwg+τvac+τp. Here,τwgis the delay time of the waveguide andτvac is the delay time in a vacuum. For determining the values ofτwgandτvacat each probing frequency, we perform an in situ calibration. An example of the temporal behaviors of the TOF of several reflected pulses is shown in Fig. 10. The experi-ment is conducted with a magnetic field strength of 2.75 T and a magnetic axis position of 3.60 m in the LHD. The delay time is defined by the traveling time from the plasma edge, whose position is calculated using the result of the in situ calibration and a magnetohydrodynamic (MHD) equi-librium calculation, to each cut-offlayer. When the corre-sponding cut-offlayer is generated in the plasma, each re-flected wave appears in order. As the density increases, the delay time gradually decreases because the cut-offlayer moves gradually towards the outside.
Plasma and Fusion Research: Regular Articles Volume 3, 018 (2008)
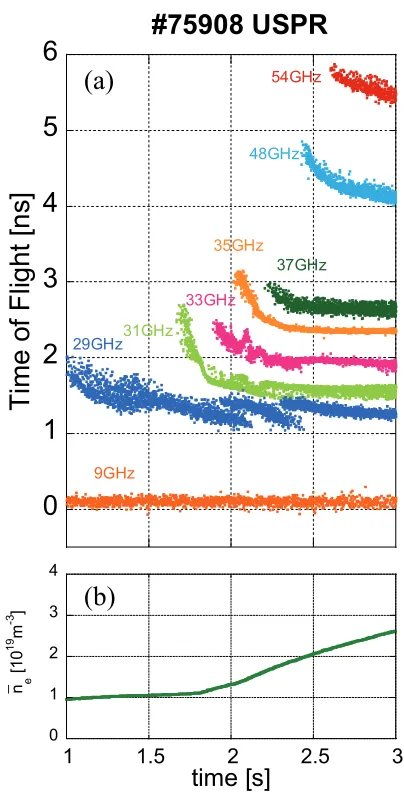
Fig. 10 Temporal evolution of (a) TOF of each reflected fre-quency component, and (b) averaged density.
the frequency is shown in Fig. 11 (a). Because the mea-sured points are discrete and limited, the TOF profile has to be interpolated using a cubic spline. By Abel inversion, the position of the corresponding cut-offlayer is given by
rc(ω0)= c
π ω0
0
τ(ω)
ω2 0−ω2
dω. (3)
Figure 11 (b) shows the reconstructed density profile. Here the horizontal axis indicates the distance from the as-sumed plasma edge.
A comparison with other diagnostics such a far-infrared (FIR) laser interferometer and a Thomson scatter-ing system is shown in Fig. 12. Here, the density profiles are plotted as a function ofρ, because each diagnostic is located in a different toroidal section and along a diff er-ent line of sight in each cross section. They are almost in agreement, but some discrepancies remain at the boundary region. Therefore, we believe that more spatial channels are required for more accurate measurements particularly
Fig. 11 (a) Profile of measured TOF of each channel as a function of the probing frequency, and (b) Reconstructed density profile.
at the edge.
Fig. 12 Density profiles of FIR interferometer (dashed line). Thomson scattering (triangles), and reflectometer (open circles).
5. Summary
An impulse waveform voltage was utilized as a broad band frequency source for electron density profile mea-surements. We installed a 28 channel ultrashort pulsed radar reflectometer system in the LHD. The frequency bandwidth of the BPF was observed to be important for the accuracy of TOF measurements, the optimum bandwidth of which was obtained experimentally. For a multi-channel system, the switching technique was utilized for TOF mea-surements. In additional, for a multi-band system, the newly developed multiplexer exhibited good characteris-tics, and was shown to reduce transmission loss. Conse-quently, we succeeded in measuring the delay time of each probing frequency and reconstructing the electron density profile.
As a future study, an important aim would be to con-duct a higher-density plasma measurement. A THz reflec-tometer system using a photoconductive antenna has al-ready been planned in [9]. This is also based on a THz pulse radar technique. The pulse shape is similar to the impulse. We will try to apply this to a fusion plasma ex-periment in the near future.
Acknowledgements
This study was partially supported by a Grant-in-Aid from the Japan Society for the Promotion of Science to one of the authors (TT), and also by NIFS07ULHH507 from the budget Grant-in-Aid by the National Institute for
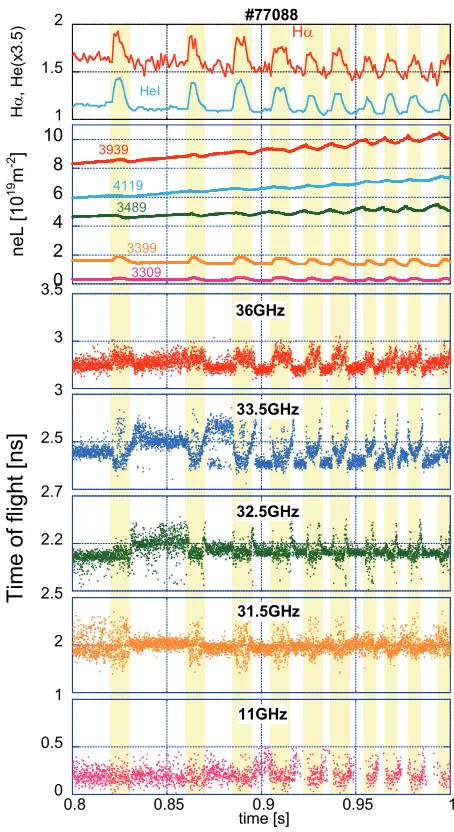
Fu-Fig. 13 Temporal evolution of Hαand HeI, the line-integrated electron density measured using a FIR interferometer, and the TOF of each reflected pulse.
sion Science.
[1] Y. Rohet al., Rev. Sci. Instrum.74, 1518 (2003). [2] C.W. Domieret al., Rev. Sci. Instrum.75, 3868 (2004). [3] S. Kubotaet al., Rev. Sci. Instrum.70, 1042 (1999). [4] O. Motojimaet al., Nucl. Fusion43, 1674 (2003). [5] T. Tokuzawaet al., Nucl. Fusion46, S670 (2006). [6] T. Kanebaet al., J. Plasma Fusion Res. Ser.6, 417 (2004). [7] H. Nakanishiet al., Fusinon Eng. Des.66-68, 827 (2003). [8] S. Moritaet al., Nucl. Fusion47, 1033 (2007).
[9] T. Tokuzawaet al., Proc. LAPD2007 (CD-rom), Takayama,