R E S E A R C H A R T I C L E
Open Access
A systematic review of the evidence that brain
structure is related to muscle structure and their
relationship to brain and muscle function in
humans over the lifecourse
Alixe HM Kilgour
1,2*, Oliver M Todd
2and John M Starr
1,2Abstract
Background:An association between cognition and physical function has been shown to exist but the roles of muscle and brain structure in this relationship are not fully understood. A greater understanding of these relationships may lead to identification of the underlying mechanisms in this important area of research. This systematic review examines the evidence for whether: a) brain structure is related to muscle structure; b) brain structure is related to muscle function; and c) brain function is related to muscle structure in healthy children and adults.
Methods:Medline, Embase, CINAHL and PsycINFO were searched on March 6th 2014. A grey literature search was performed using Google and Google Scholar. Hand searching through citations and references of relevant articles was also undertaken.
Results:53 articles were included in the review; mean age of the subjects ranged from 8.8 to 85.5 years old. There is evidence of a positive association between both whole brain volume and white matter (WM) volume and muscle size. Total grey matter (GM) volume was not associated with muscle size but some areas of regional GM volume were associated with muscle size (right temporal pole and bilateral ventromedial prefrontal cortex). No evidence was found of a relationship between grip strength and whole brain volume however there was some evidence of a positive association with WM volume. Conversely, there is evidence that gait speed is positively associated with whole brain volume; this relationship may be driven by total WM volume or regional GM volumes, specifically the hippocampus. Markers of brain ageing, that is brain atrophy and greater accumulation of white matter hyperintensities (WMH), were associated with grip strength and gait speed. The location of WMH is important for gait speed; periventricular
hyperintensities and brainstem WMH are associated with gait speed but subcortical WMH play less of a role. Cognitive function does not appear to be associated with muscle size.
Conclusion:There is evidence that brain structure is associated with muscle structure and function. Future studies need to follow these interactions longitudinally to understand potential causal relationships.
Background
Maintaining good levels of brain and muscle function across the lifespan is crucial to achieving a good quality of life [1-3]. There is substantial evidence showing an association between cognition and muscle function [4-8], however the role of muscle and brain structure within this association is less well understood. A greater understanding of this role
will help to improve current knowledge of the mechanisms linking brain and muscle function over the lifecourse.
Several theories have been proposed as to why rela-tionships between brain and muscle structure and func-tion may exist. The common cause hypothesis postulates that there are core common underlying processes which drive ageing throughout the human body. The construct was originally described in a paper by Lindenberger and Baltes in 1994 who noted that measures of visual and auditory acuity accounted for variance in intelligence in old age [9]. Since then experiments in caloric restriction * Correspondence:[email protected]
1
Centre for Cognitive Ageing and Cognitive Epidemiology, University of Edinburgh, Room F2, 7 George Square, Edinburgh EH8 9JZ, UK
2
Geriatric Medicine Unit, University of Edinburgh, Edinburgh, UK
© 2014 Kilgour et al.; licensee BioMed Central Ltd. This is an Open Access article distributed under the terms of the Creative Commons Attribution License (http://creativecommons.org/licenses/by/2.0), which permits unrestricted use, distribution, and reproduction in any medium, provided the original work is properly credited. The Creative Commons Public Domain Dedication waiver (http://creativecommons.org/publicdomain/zero/1.0/) applies to the data made available in this article, unless otherwise stated.
have demonstrated that the ageing process can be slo-wed down in multiple systems throughout the body by one intervention [10,11]. However, environmental fac-tors also impact on how tissues change across the life-course and another theory by Mitnitski et al. proposes that the number of environmental stressors experienced (e.g. disease, smoking) and the ability to recover from them, vary the level of deficit accumulation experienced in multiple organ systems, and hence how tissues like brain and muscle change with age [12]. Potential under-lying mechanisms include: pro-inflammatory cytokines (e.g. TNF-alpha and IL-6); the role of glucocorticoids and their intracellular amplifier 11beta-hydroxysteroid de-hydrogenase type 1 [13-15]; the role of vitamin D [16,17]; exercise as a way to improve cardiovascular fitness in addition to its beneficial effect through hormones and cy-tokines [18-20]; and cellular senescence (e.g. through oxi-dative stress) [21,22].
In view of these theories, there should be a correlation between the structure and function of brain and muscle throughout our lifetime in the absence of significant pathology. This systematic review will search for studies that test the hypotheses that brain structure is related to muscle structure and/or function and that muscle struc-ture is related to brain function in healthy children and adults. Previous studies and reviews have looked at evi-dence relating brain function (e.g. MMSE score) to muscle function (e.g. walking speed) therefore this sep-arate but closely related field of literature will not be included in this review [5,23-25].
Methods
The study protocol was published online in December 2011 at: http://www.ccace.ed.ac.uk/sites/default/files/ Kilgouretal.pdf.
Inclusion criteria
Population
All human subjects regardless of age were included in the study; from newborn babies to the oldest old, includ-ing post-mortem studies. This study is examininclud-ing the re-lationship between brain and muscle in health, not within the effects of pathology therefore studies looking at how a disease affects brain or muscle were excluded. However studies which included a healthy control group, where the data from these subjects can be or was ana-lysed separately were included. As morbidity increases in frequency with age it would be very restrictive to include solely those studies which include only participants who are free from any disease, therefore studies will be in-cluded provided the subjects have been recruited in a way that did not pre-dispose to morbidity being more prevalent than in the general population (e.g. from a dia-betes clinic).
It was planned that subgroup analysis would be undertaken where possible and would include data be-ing extracted to investigate the effects of gender, age, socioeconomic status and ethnicity.
Interventions/Comparators
Not applicable as the study is investigating normal physiology.
Outcomes
Brain structure
Whole brain volume (WBV) or total brain volume (TBV)
Volume or cross sectional area of regions within the brain (e.g. hippocampus, frontal lobes)
White matter integrity (e.g. White matter hyperintensities (WMH) or white matter signal abnormalities (WMSA)
Histological findings about brain structure on autopsy
Brain function
Any recognised measure of cognitive function including: memory, attention, executive function, language and processing speed
Reaction time will not be used as this is dependent on aspects of brain and muscle structure and function
Muscle structure
Muscle cross sectional area on CT, MRI or USS
Muscle volume (using CT or MRI)
Whole body lean tissue mass using DEXA, giving: total lean mass (TLM) or appendicular lean mass (ALM)
Bioimpedance analysis (BIA)
Histological findings on muscle biopsy or on autopsy
Muscle function
Any recognised test of muscle strength, including isometric, isotonic, isokinetic tests
Any recognised test of muscle power
Functional tests of muscle function (e.g. usual or maximum gait speed)
Study design
Observational studies including cohort studies and cross sectional studies were included and the control arm of case control studies. Case reports were excluded as these would not contain evidence of normal physiological relationships out with pathology. The only other limiter used was “ hu-man”in Medline, Embase and PsycINFO but not Cinahl as it appears to screen out human studies erroneously.
Search strategy
Database searches of Medline, Embase, CINAHL and PsycINFO were undertaken. All languages were included in the search. The Medline search strategy can be found in Appendix 1. The searches were all performed on 6th March 2014. A grey literature search was performed using Google and Google Scholar. Hand searching through cita-tions and references of relevant articles was also undertaken.
Study selection
The search was undertaken by two independent re-searchers. Titles +/− abstracts found using our search strategy were independently screened for relevance. The full text of the selected studies was reviewed against the inclusion criteria, and reasons for exclusion at this stage were recorded. At this point the two researchers met to discuss shortlists and discuss any articles which only one researcher had selected to decide if they should be in-cluded or not. Disagreements were resolved by consen-sus or adjudication by a third party (a Professor in Geriatric Medicine).
Data extraction
The Clinical Fellow (AK) performed the data extraction using a data extraction sheet written by the Clinical Fel-low and approved by the two co-authors (OT, JS).
Contacting authors
Of the 84 studies found through our search, we wrote to 79 to request data or associations which were not given in the text. Five of the studies had given all the associa-tions for the variables listed in the text. A letter was sent by email to either the corresponding author (after check-ing they were still workcheck-ing at the study location) or the last author (after the same checking process). Only one author was written to from each study (e.g. all articles arising from the Kansas Brain Aging Project, were grouped together when requesting extra data/associa-tions). After the initial email a further email was sent around 2 weeks later to act as a reminder. Studies were given a minimum of around 1 month to reply.
Out of the 79 studies we wrote to: 25 studies (32%) sent either the requested data or associations; 22 (28%) replied stating they would try and send the data or asso-ciations to us but then never did; 12 studies (15%) re-plied stating they either no longer had access to the data
or did not want to send either the requested data or as-sociations to us; and 20 (25%) never replied to either of the emails.
Quality assessment and risk of bias
All papers included in the study had their inclusion and ex-clusion criteria reviewed to check for possible bias in the study selection. The topic of the review is not looking at an intervention, therefore the risk of reporting bias for an in-dividual paper is small. Also, in most of the papers, the re-lationship between muscle and brain was not the primary topic of the paper, further decreasing the risk of reporting bias. However when contacting the authors, asking for ei-ther the data or the associations, it was considered that the studies which replied may show some bias. The authors may look at their data and only reply if an association was found, or if they found a strong relationship they may not want this to be initially reported within a systematic review, but rather in a paper in its own right. All summary mea-sures were included (e.g. odds ratio, beta).
Data analysis
A narrative synthesis was completed. It was thought un-likely that the data would be comparable enough to allow meta-analysis (i.e. different measures of cognition, different muscle groups studied using different ma-chines) and this proved correct. It was hoped that sub-group analysis would be undertaken, either in the form of a meta-analysis or more likely as a narrative synthesis for the reasons mentioned in the above paragraph.
Results
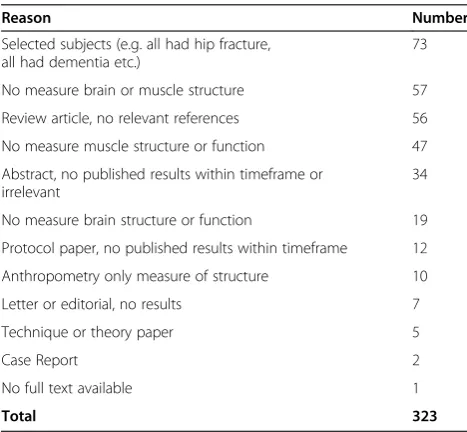
The search results are presented in the PRISMA flow diagram in Figure 1. Reasons for exclusion of articles after reviewing the full text are reported in Table 1. After applying the inclusion and exclusion criteria 84 articles were identified; 53 articles either reported the appropri-ate associations or sent us the data or associations re-quested (Tables 2, 3 and 4), and 31 articles contained the required data but did not report the association be-tween them and did not supply either the data or associ-ations requested (Table 5). Out of the 53 articles which could be included in the review; 6 contained data on brain structure and muscle structure (Table 2); 33 con-tained data on brain structure and muscle function (Table 3); and 14 contained data on brain function and muscle structure (Table 4).
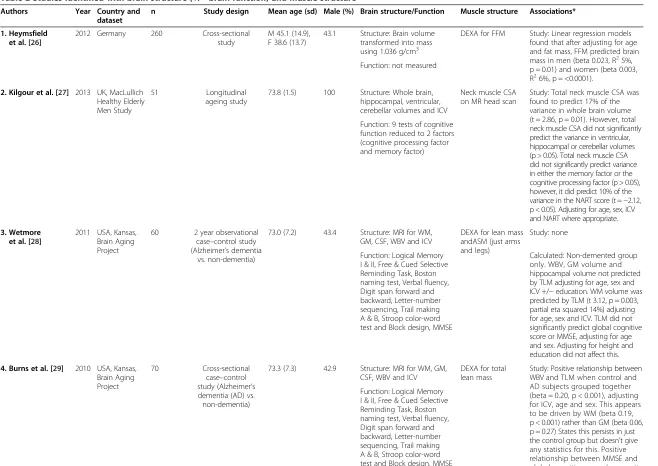
Association of brain structure and muscle structure Of the six articles which looked at the relationship be-tween brain structure and muscle structure, three were from the Kansas Brain Aging Project [28-30], and the others were from Germany, UK and USA, Phoenix [26,27,31] (Table 2).
The Kansas Brain Aging Project was set up to deter-mine the effects of exercise and cardiorespiratory fitness on age-related brain changes. Only one of the papers from this project reported the relationship between brain and muscle structure [29]: Burns et al. reported a positive relationship between WBV and TLM (beta 0.20, p < 0.001) when control and subjects with Alzheimer’s disease (AD) were grouped together, adjusting for age sex and intracranial volume (ICV), and they note that this was driven by WM volume [29]. They state that this relationship persists in just the control group but do not give any statistics for this relationship. A General Linear Model (GLM) was performed on the data from the non-demented group supplied to us by the study authors from the Kansas Brain Aging Project [28-30]. WBV, grey matter (GM) volume and hippocampal volume were not predicted by TLM adjusting for age, sex and ICV +/− education. White matter (WM) volume was predicted by TLM (t 3.12, p = 0.003, partial eta squared 14%) adjust-ing for age, sex and ICV. Adjustadjust-ing for total years of for-mal education only slightly attenuated the results (t 2.99, p = 0.004, partial eta squared 13%).
Kilgour et al. also looked at older subjects however they used neck muscle CSA as a measure of muscle bulk [27]. They found that total neck muscle CSA predicted 17% of the variance in whole brain volume (p = 0.01),
but they found no significant association between total neck muscle CSA and ventricular, hippocampal or cere-bellar volumes (p > 0.05), adjusting for age, sex, ICV and NART (a measure of childhood intelligence).
The other two studies looked at younger subjects. Heymsfield et al. specifically set out to investigate the Records identified through
database searching Medline 7399 Embase 12,191
PsycInfo 885 Cinahl 1766 (n = 22,241)
Additional records identified through other sources
(n = 4)
Records after duplicates removed (n = 18,496)
Records screened (n = 18,496)
Records excluded (n = 18,089)
Full-text articles assessed for eligibility
(n = 407)
Full-text articles excluded with reasons (see Table 1)
(n = 323)
Studies included in qualitative synthesis
(n=84)
Identification
Screening
Eligibility
Included
Figure 1PRISMA flow diagram showing study selection.
Table 1 Full-text articles excluded, with reasons
Reason Number
Selected subjects (e.g. all had hip fracture, all had dementia etc.)
73
No measure brain or muscle structure 57
Review article, no relevant references 56
No measure muscle structure or function 47
Abstract, no published results within timeframe or irrelevant
34
No measure brain structure or function 19
Protocol paper, no published results within timeframe 12
Anthropometry only measure of structure 10
Letter or editorial, no results 7
Technique or theory paper 5
Case Report 2
No full text available 1
Total 323
Table 2 Studies identified with brain structure (+/−brain function) and muscle structure
Authors Year Country and
dataset
n Study design Mean age (sd) Male (%) Brain structure/Function Muscle structure Associations*
1. Heymsfield et al. [26]
2012 Germany 260 Cross-sectional
study
M 45.1 (14.9), F 38.6 (13.7)
43.1 Structure: Brain volume
transformed into mass using 1.036 g/cm3
DEXA for FFM Study: Linear regression models
found that after adjusting for age and fat mass, FFM predicted brain mass in men (beta 0.023, R25%, p = 0.01) and women (beta 0.003, R26%, p = <0.0001).
Function: not measured
2. Kilgour et al. [27] 2013 UK, MacLullich Healthy Elderly Men Study
51 Longitudinal
ageing study
73.8 (1.5) 100 Structure: Whole brain,
hippocampal, ventricular, cerebellar volumes and ICV
Neck muscle CSA on MR head scan
Study: Total neck muscle CSA was found to predict 17% of the variance in whole brain volume (t = 2.86, p = 0.01). However, total neck muscle CSA did not significantly predict the variance in ventricular, hippocampal or cerebellar volumes (p > 0.05). Total neck muscle CSA did not significantly predict variance in either the memory factor or the cognitive processing factor (p > 0.05), however, it did predict 10% of the variance in the NART score (t =−2.12, p < 0.05). Adjusting for age, sex, ICV and NART where appropriate. Function: 9 tests of cognitive
function reduced to 2 factors (cognitive processing factor and memory factor)
3. Wetmore et al. [28]
2011 USA, Kansas, Brain Aging Project
60 2 year observational
case–control study (Alzheimer’s dementia
vs. non-dementia)
73.0 (7.2) 43.4 Structure: MRI for WM,
GM, CSF, WBV and ICV
DEXA for lean mass andASM (just arms and legs)
Study: none
Function: Logical Memory I & II, Free & Cued Selective Reminding Task, Boston naming test, Verbal fluency, Digit span forward and backward, Letter-number sequencing, Trail making A & B, Stroop color-word test and Block design, MMSE
Calculated: Non-demented group only. WBV, GM volume and hippocampal volume not predicted by TLM adjusting for age, sex and ICV +/−education. WM volume was predicted by TLM (t 3.12, p = 0.003, partial eta squared 14%) adjusting for age, sex and ICV. TLM did not significantly predict global cognitive score or MMSE, adjusting for age and sex. Adjusting for height and education did not affect this.
4. Burns et al. [29] 2010 USA, Kansas, Brain Aging Project
70 Cross-sectional
case–control study (Alzheimer’s dementia (AD) vs. non-dementia)
73.3 (7.3) 42.9 Structure: MRI for WM, GM,
CSF, WBV and ICV
DEXA for total lean mass
Study: Positive relationship between WBV and TLM when control and AD subjects grouped together (beta = 0.20, p < 0.001), adjusting for ICV, age and sex. This appears to be driven by WM (beta 0.19, p < 0.001) rather than GM (beta 0.06, p = 0.27) States this persists in just the control group but doesn’t give any statistics for this. Positive relationship between MMSE and global cognitive score (composite Function: Logical Memory
I & II, Free & Cued Selective Reminding Task, Boston naming test, Verbal fluency, Digit span forward and backward, Letter-number sequencing, Trail making A & B, Stroop color-word test and Block design, MMSE
et
al.
BMC
Geriatric
s
2014,
14
:85
Page
5
o
f
3
5
w.biomedce
ntral.com/1
Table 2 Studies identified with brain structure (+/−brain function) and muscle structure(Continued)
of the cognitive tests) and lean mass when grouping AD and control subjects together. States that controlling for dementia status attenuates these results, but no specific statistics given. Calculated: See Wetmore et al. (2011) for Kansas Brain Aging Project data analysis.
5. Honea et al. [30] 2009 USA, Kansas, Brain Aging Project
56 healthy controls
Cross-sectional case–control study (Alzheimer’s
dementia vs. non-dementia)
73.3 (6.2) 41.1 Structure: MRI for GM, WM,
CSF, WBV, hippocampal and parahippocampal volumes
DEXA for total lean mass
Study: none
Function: MMSE Calculated: See Wetmore et al.
(2011) for Kansas Brain Aging Project data analysis.
6. Weise et al. [31] 2013 USA, Phoenix 76 Cross-sectional study
32.1 (8.8) 31.6 Structure: MRI brain
volumes (GM, WM, CSF, regional GMV)
DEXA, FFMI
(FFM/height2) Study: Fat-free mass index (FFMI)was negatively associated with
GMV of the bilateral temporal lobes, ventromedial prefrontal cortex (vmPFC) (mainly subgenual portion of the ACC) and caudolateral orbitofrontal cortex and unilaterally with the left insular cortex (all p < 0.01). After adjusting for percentage body fat and fat mass, negative associations of FFM with GMV of the right temporal pole and bilateral vmPFC remained. All models adjusted for age, sex and handedness.
Function: not measured
*Associations column key: Study = results published within the study; Calculated = study authors supplied raw data to us and we performed the analysis.
et
al.
BMC
Geriatric
s
2014,
14
:85
Page
6
o
f
3
5
w.biomedce
ntral.com/1
Table 3 Studies identified with brain structure and muscle function
Author Year Country and dataset
n Study design Mean age (sd) Male (%) Brain structure# Muscle function Associations*
Brain structure and grip strength
1. Sachdev et al. [32]
2009 Australia, PATH through life project
432 Observational
cohort study
M 62.61 (1.42) F 62.62 (1.44)
52.8 Volumes of GM, WM and
CSF, ICV and TBV (GM plus WM). Brain atrophy and subcortical atrophy, WMH
Grip strength in writing hand
Study: Total brain WMH volume predicted grip strength in men (beta−0.140, delta R20.019,
p < 0.05) but not in women (beta−0.140, delta R20.018, p > 0.05).
2. Anstey et al. [33]
2007 Australia, PATH through life project
432 Observational
cohort study
62.63 (1.43) 51.6 Total, anterior, midbody
and posterior corpus callosum (CC) area
Grip strength in writing hand
Study: Grip strength adjusted for sex and ICV was found to correlate with CC midbody area (r = 0.103, p < 0.05), however CC total area and anterior and posterior CC areas did not significantly correlate with grip strength (p > 0.05).
3. Sachdev et al. [34]
2006 Australia, PATH through life project
469 Observational
cohort study
M 62.56 (1.44) F 62.53 (1.47)
51.8 Volumes of GM, WM and
CSF, ICV and TBV (GM plus WM). Brain atrophy and subcortical atrophy, WMH
Grip strength in writing hand
Study: None, see other articles from the PATH through life project for analysis using this dataset.
4. Sachdev et al. [35]
2005 Australia, PATH through life project
478 Observational
cohort study
M 62.56 (1.44) F 62.54 (1.47)
52.3 WMH, ICV Grip strength
in writing hand
Study: Total brain WMH significantly predicted grip strength (beta−0.09, p = 0.002) adjusted for age, sex and depression. Correcting for comorbidity, cognition and brain atrophy did not attenuate the results (beta−0.13, p =0.001).
5. Doi et al. [36]
2012 Japan 110 Cross-sectional
study
75.4 (7.1) 50 GM, WM, CSF, brain atrophy
(measured using healthy volunteers)
Grip strength Study: A MLR model found that
grip strength is not related to brain atrophy (beta−0.082 (SE 0.005) p = 0.54). Adjusting for age, gender, BMI, education, MMSE, Tokyo Metropolitan Institute of Gerontology Index of Competence, geriatric depression scale and change in walking whilst dual tasking. No other associations given.
6. Hardan et al. [37]
2003 USA, Philadelphia 41 controls Case–control
study
18.6 (8.6) Not given Caudate, putamen and
total brain volume
Grip strength Study: Non-significant trends
showed a negative correlation between right grip strength and total caudate volume (r =−0.303, p = 0.05) and left grip strength (r =−0.28, p = 0.07) in the control group. Not corrected for age or sex. No relationships given for other measures.
et
al.
BMC
Geriatric
s
2014,
14
:85
Page
7
o
f
3
5
w.biomedce
ntral.com/1
Table 3 Studies identified with brain structure and muscle function(Continued)
Brain structure and gait speed
7. Piguet et al. [38]
2006 Australia, Sydney Older Person's Study
111 Longitudinal
observational cohort study
M 85.29 (2.89) F 85.72 (3.41)
54.5 Cerebellar vermis area,
(V1, V2 and V3 and total), Cerebellar volume, cerebral volume and ICV
Timed walk over 5 m, adjusted for lower limb arthritis
Study: None of the brain size measures (cerebellar vermis area, cerebellar volume or cerebral volume) significantly predicted timed walk (p > 0.05) after adjustment for age (but not sex, as was not deemed to be a significant contributor after univariate analyses).
8. Callisaya et al. [39]
2013 Australia, Tasmanian Study of Cognition and Gait (TASCOG)
225 Longitudinal
cohort study
71.4 (6.8) 56.4 ICV, GM, WM-lesion
free, hippocampal volume, WML
4.6 metre GaitRite computerized walkway (preferred speed)
Study: MLR were performed to investigate the relationship of longitudinal change in brain volumes and gait speed. They found that white matter atrophy (beta 0.25 (CI 0.09-0.40) p = 0.001), greater WML progression (beta−0.89 (CI−1.75- -0.02) p = 0.045), grey matter atrophy (beta 0.25 (CI 0.00-0.19) p = 0.06) and hippocampal atrophy (beta 0.01 (CI 0.00-0.02) p = 0.006) were all associated with a greater decline in gait speed.
9. Srikanth et al. [40]
2010 Australia, TASCOG 385 Longitudinal
cohort study
72.2 (7.1) 56 WMLV, TBV Gait speed using
4.2 m GAITRite system
Study: none, see Callisaya et al. (2013) for analysis using the TASCOG dataset.
10. Srikanth et al. [41]
2009 Australia, TASCOG 294 Longitudinal
cohort study
72.3(7.0) 55.4 WMLV, TBV Gait speed using
4.2 m GAITRite system
Study: none, see Callisaya et al. (2013) for analysis using the TASCOG dataset.
11. Elbaz et al. [42]
2013 France, Three-city study
4010 Cohort study 73.4 (4.6) 38.4 WML volumes 6 metre walk speed
(usual and maximum)
Study: Logistic regression stratified by education found that high WML volumes were not associated with slow walking speed among highly educated participants (OR = 0.72), but were associated with a 2-fold-increased risk of slow walking speed among those with low education (OR = 3.19/1.61 = 1.99) (p interaction = 0.026), adjusted for sex, age and total WM volume. Results remained unchanged after adjustment for height, BMI, and MMSE score.
Given: WM volume did not predict walking speed at baseline, adjusted for age, gender and ICV in a MLR (p > 0.05, n = 1510), or decline in walking speed over 7 years, adjusted for age, gender, ICV and
et
al.
BMC
Geriatric
s
2014,
14
:85
Page
8
o
f
3
5
w.biomedce
ntral.com/1
Table 3 Studies identified with brain structure and muscle function(Continued)
baseline walking speed, (p > 0.05, n = 928). A logistic regression found that WM volume was not significantly associated with an increased risk of being in the quartile with the highest walking speed decline (p > 0.05).
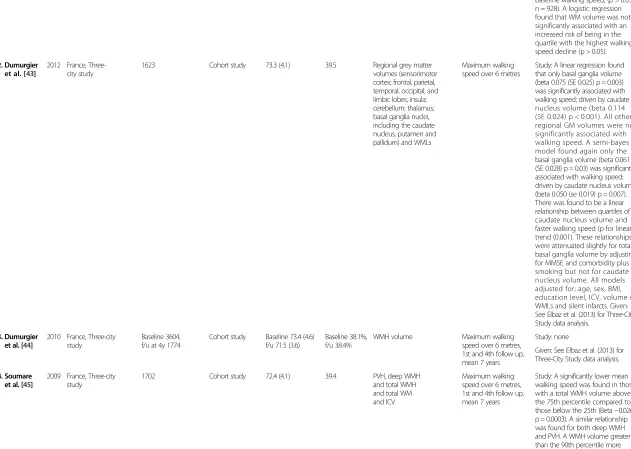
12. Dumurgier et al. [43]
2012 France, Three-city study
1623 Cohort study 73.3 (4.1) 39.5 Regional grey matter
volumes (sensorimotor cortex; frontal, parietal, temporal, occipital, and limbic lobes; insula; cerebellum; thalamus; basal ganglia nuclei, including the caudate nucleus, putamen and pallidum) and WMLs
Maximum walking speed over 6 metres
Study: A linear regression found that only basal ganglia volume (beta 0.075 (SE 0.025) p = 0.003) was significantly associated with walking speed; driven by caudate nucleus volume (beta 0.114 (SE 0.024) p < 0.001). All other regional GM volumes were not significantly associated with walking speed. A semi-bayes model found again only the basal ganglia volume (beta 0.061 (SE 0.028) p = 0.03) was significantly associated with walking speed; driven by caudate nucleus volume (beta 0.050 (se 0.019) p = 0.007). There was found to be a linear relationship between quartiles of caudate nucleus volume and faster walking speed (p for linear trend (0.001). These relationships were attenuated slightly for total basal ganglia volume by adjusting for MMSE and comorbidity plus smoking but not for caudate nucleus volume. All models adjusted for; age, sex, BMI, education level, ICV, volume of WMLs and silent infarcts. Given: See Elbaz et al. (2013) for Three-City Study data analysis.
13. Dumurgier et al. [44]
2010 France, Three-city study
Baseline 3604, f/u at 4y 1774
Cohort study Baseline 73.4 (4.6) f/u 71.5 (3.6)
Baseline 38.1%, f/u 38.4%
WMH volume Maximum walking
speed over 6 metres, 1st and 4th follow up, mean 7 years
Study: none
Given: See Elbaz et al. (2013) for Three-City Study data analysis.
14. Soumare et al. [45]
2009 France, Three-city study
1702 Cohort study 72.4 (4.1) 39.4 PVH, deep WMH
and total WMH and total WM and ICV
Maximum walking speed over 6 metres, 1st and 4th follow up, mean 7 years
Study: A significantly lower mean walking speed was found in those with a total WMH volume above the 75th percentile compared to those below the 25th (Beta−0.026, p = 0.0003). A similar relationship was found for both deep WMH and PVH. A WMH volume greater than the 90th percentile more than doubled the risk of decline
et
al.
BMC
Geriatric
s
2014,
14
:85
Page
9
o
f
3
5
w.biomedce
ntral.com/1
Table 3 Studies identified with brain structure and muscle function(Continued)
in walking speed compared with subjects with lower volumes of WMH (OR 2.6 (1.5-4.5), p = 0.001). This finding was replicated when looking at PVH but not for deep WMH volume. Given: See Elbaz et al. (2013) for Three-City Study data analysis.
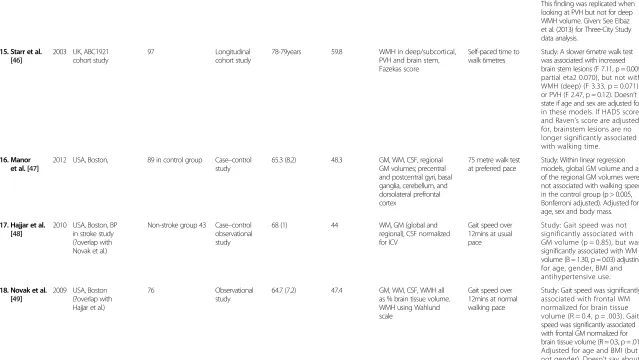
15. Starr et al. [46]
2003 UK, ABC1921 cohort study
97 Longitudinal
cohort study
78-79years 59.8 WMH in deep/subcortical,
PVH and brain stem, Fazekas score
Self-paced time to walk 6metres
Study: A slower 6metre walk test was associated with increased brain stem lesions (F 7.11, p = 0.009, partial eta2 0.070), but not with WMH (deep) (F 3.33, p = 0.071) or PVH (F 2.47, p = 0.12). Doesn’t state if age and sex are adjusted for in these models. If HADS score and Raven’s score are adjusted for, brainstem lesions are no longer significantly associated with walking time.
16. Manor et al. [47]
2012 USA, Boston, 89 in control group Case–control
study
65.3 (8.2) 48.3 GM, WM, CSF, regional
GM volumes; precentral and postcentral gyri, basal ganglia, cerebellum, and dorsolateral prefrontal cortex
75 metre walk test at preferred pace
Study: Within linear regression models, global GM volume and all of the regional GM volumes were not associated with walking speed in the control group (p > 0.005, Bonferroni adjusted). Adjusted for age, sex and body mass.
17. Hajjar et al. [48]
2010 USA, Boston, BP in stroke study (?overlap with Novak et al.)
Non-stroke group 43 Case–control observational study
68 (1) 44 WM, GM (global and
regional), CSF normalized for ICV
Gait speed over 12mins at usual pace
Study: Gait speed was not significantly associated with GM volume (p = 0.85), but was significantly associated with WM volume (B = 1.30, p = 0.03) adjusting for age, gender, BMI and antihypertensive use.
18. Novak et al. [49]
2009 USA, Boston (?overlap with Hajjar et al.)
76 Observational
study
64.7 (7.2) 47.4 GM, WM, CSF, WMH all
as % brain tissue volume. WMH using Wahlund scale
Gait speed over 12mins at normal walking pace
Study: Gait speed was significantly associated with frontal WM normalized for brain tissue volume (R = 0.4, p = .003). Gait speed was significantly associated with frontal GM normalized for brain tissue volume (R = 0.3, p = .01). Adjusted for age and BMI (but not gender). Doesn’t say about other regional brain volumes, ie temporal etc. WMH volumes and PVH and punctuate scores were not associated with gait speed (p > 0.05).
et
al.
BMC
Geriatric
s
2014,
14
:85
Page
10
of
35
w.biomedce
ntral.com/1
Table 3 Studies identified with brain structure and muscle function(Continued)
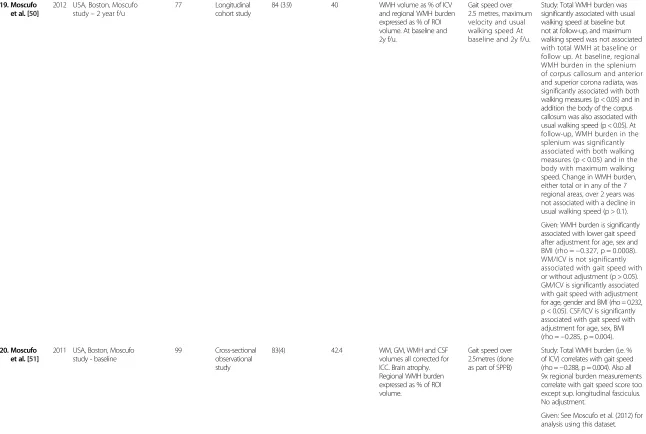
19. Moscufo et al. [50]
2012 USA, Boston, Moscufo study–2 year f/u
77 Longitudinal
cohort study
84 (3.9) 40 WMH volume as % of ICV
and regional WMH burden expressed as % of ROI volume. At baseline and 2y f/u.
Gait speed over 2.5 metres, maximum velocity and usual walking speed At baseline and 2y f/u.
Study: Total WMH burden was significantly associated with usual walking speed at baseline but not at follow-up, and maximum walking speed was not associated with total WMH at baseline or follow up. At baseline, regional WMH burden in the splenium of corpus callosum and anterior and superior corona radiata, was significantly associated with both walking measures (p < 0.05) and in addition the body of the corpus callosum was also associated with usual walking speed (p < 0.05). At follow-up, WMH burden in the splenium was significantly associated with both walking measures (p < 0.05) and in the body with maximum walking speed. Change in WMH burden, either total or in any of the 7 regional areas, over 2 years was not associated with a decline in usual walking speed (p > 0.1).
Given: WMH burden is significantly associated with lower gait speed after adjustment for age, sex and BMI (rho =−0.327, p = 0.0008). WM/ICV is not significantly associated with gait speed with or without adjustment (p > 0.05). GM/ICV is significantly associated with gait speed with adjustment for age, gender and BMI (rho = 0.232, p < 0.05). CSF/ICV is significantly associated with gait speed with adjustment for age, sex, BMI (rho =−0.285, p = 0.004).
20. Moscufo et al. [51]
2011 USA, Boston, Moscufo study - baseline
99 Cross-sectional
observational study
83(4) 42.4 WM, GM, WMH and CSF
volumes all corrected for ICC. Brain atrophy. Regional WMH burden expressed as % of ROI volume.
Gait speed over 2.5metres (done as part of SPPB)
Study: Total WMH burden (i.e. % of ICV) correlates with gait speed (rho =−0.288, p = 0.004). Also all 9x regional burden measurements correlate with gait speed score too except sup. longitudinal fasciculus. No adjustment.
Given: See Moscufo et al. (2012) for analysis using this dataset.
et
al.
BMC
Geriatric
s
2014,
14
:85
Page
11
of
35
w.biomedce
ntral.com/1
Table 3 Studies identified with brain structure and muscle function(Continued)
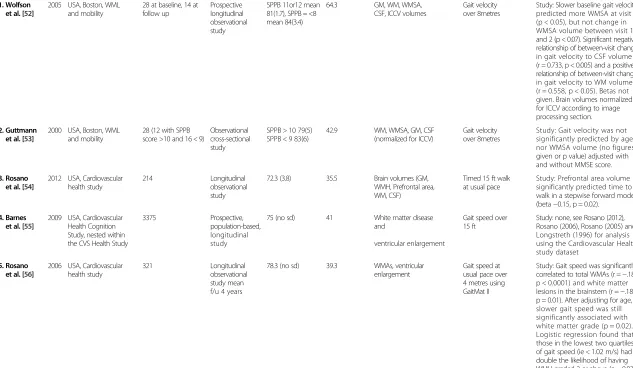
21. Wolfson et al. [52]
2005 USA, Boston, WML and mobility
28 at baseline, 14 at follow up
Prospective longitudinal observational study
SPPB 11or12 mean 81(1.7), SPPB = <8 mean 84(3.4)
64.3 GM, WM, WMSA,
CSF, ICCV volumes
Gait velocity over 8metres
Study: Slower baseline gait velocity predicted more WMSA at visit 1 (p < 0.05), but not change in WMSA volume between visit 1 and 2 (p < 0.07). Significant negative relationship of between-visit change in gait velocity to CSF volume (r = 0.733, p < 0.005) and a positive relationship of between-visit change in gait velocity to WM volume (r = 0.558, p < 0.05). Betas not given. Brain volumes normalized for ICCV according to image processing section.
22. Guttmann et al. [53]
2000 USA, Boston, WML and mobility
28 (12 with SPPB score >10 and 16 < 9)
Observational cross-sectional study
SPPB > 10 79(5) SPPB < 9 83(6)
42.9 WM, WMSA, GM, CSF
(normalized for ICCV)
Gait velocity over 8metres
Study: Gait velocity was not significantly predicted by age nor WMSA volume (no figures given or p value) adjusted with and without MMSE score.
23. Rosano et al. [54]
2012 USA, Cardiovascular health study
214 Longitudinal
observational study
72.3 (3.8) 35.5 Brain volumes (GM,
WMH, Prefrontal area, WM, CSF)
Timed 15 ft walk at usual pace
Study: Prefrontal area volume significantly predicted time to walk in a stepwise forward model (beta−0.15, p = 0.02).
24. Barnes et al. [55]
2009 USA, Cardiovascular Health Cognition Study, nested within the CVS Health Study
3375 Prospective,
population-based, longitudinal study
75 (no sd) 41 White matter disease
and
ventricular enlargement
Gait speed over 15 ft
Study: none, see Rosano (2012), Rosano (2006), Rosano (2005) and Longstreth (1996) for analysis using the Cardiovascular Health study dataset
25. Rosano et al. [56]
2006 USA, Cardiovascular health study
321 Longitudinal
observational study mean f/u 4 years
78.3 (no sd) 39.3 WMAs, ventricular
enlargement
Gait speed at usual pace over 4 metres using GaitMat II
Study: Gait speed was significantly correlated to total WMAs (r =−.18, p < 0.0001) and white matter lesions in the brainstem (r =−.18, p = 0.01). After adjusting for age, slower gait speed was still significantly associated with white matter grade (p = 0.02). Logistic regression found that those in the lowest two quartiles of gait speed (ie < 1.02 m/s) had double the likelihood of having WMH graded 3 or above (p = 0.03), after adjustment for age, race, gender, and prevalent clinical CVD. VE graded >4 was not found to be significantly predicted by gait speed, however VE graded > 5 was, independent of age, gender, race and presence of CVD (OR = 2.91 for 1st vs. 4th quartile, OR 3.82 for 2nd vs 4th quartile)
et
al.
BMC
Geriatric
s
2014,
14
:85
Page
12
of
35
w.biomedce
ntral.com/1
Table 3 Studies identified with brain structure and muscle function(Continued)
26. Rosano et al. [57]
2005 USA, Cardiovascular health study
2450 Longitudinal
observational study mean f/u 4 years
74.4 (4.7) 43 WMH and ventricular
enlargement (graded as minimal, moderate and severe)
Gait speed over 15 ft at usual pace, starting from standing still
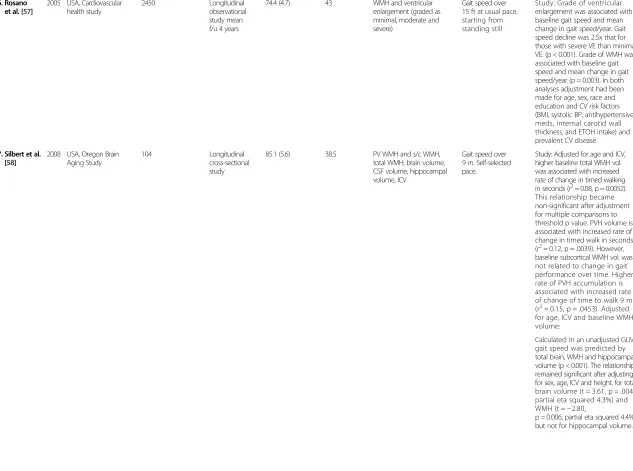
Study: Grade of ventricular enlargement was associated with baseline gait speed and mean change in gait speed/year. Gait speed decline was 2.5x that for those with severe VE than minimal VE. (p < 0.001). Grade of WMH was associated with baseline gait speed and mean change in gait speed/year (p = 0.003). In both analyses adjustment had been made for age, sex, race and education and CV risk factors (BMI, systolic BP, antihypertensive meds, internal carotid wall thickness, and ETOH intake) and prevalent CV disease.
27. Silbert et al. [58]
2008 USA, Oregon Brain Aging Study
104 Longitudinal
cross-sectional study
85.1 (5.6) 38.5 PV WMH and s/c WMH,
total WMH, brain volume, CSF volume, hippocampal volume, ICV
Gait speed over 9 m. Self-selected pace.
Study: Adjusted for age and ICV, higher baseline total WMH vol. was associated with increased rate of change in timed walking in seconds (r2= 0.08, p = 0.0052). This relationship became non-significant after adjustment for multiple comparisons to threshold p value. PVH volume is associated with increased rate of change in timed walk in seconds (r2= 0.12, p = .0039). However, baseline subcortical WMH vol. was not related to change in gait performance over time. Higher rate of PVH accumulation is associated with increased rate of change of time to walk 9 m (r2= 0.15, p = .0453). Adjusted
for age, ICV and baseline WMH volume:
Calculated: In an unadjusted GLM, gait speed was predicted by total brain, WMH and hippocampal volume (p < 0.001). The relationship remained significant after adjusting for sex, age, ICV and height, for total brain volume (t = 3.61, p = .004, partial eta squared 4.3%) and WMH (t =−2.80,
p = 0.006, partial eta squared 4.4%) but not for hippocampal volume.
et
al.
BMC
Geriatric
s
2014,
14
:85
Page
13
of
35
w.biomedce
ntral.com/1
Table 3 Studies identified with brain structure and muscle function(Continued)
28. Marquis et al. [59]
2002 USA, Oregon Brain Aging Study
108 Longitudinal
cross-sectional study
83.2 (7.9) 37 Total brain volume,
hippocampal volume, ICV
Gait speed over 9 m. Self-selected pace.
Study: Negative correlation between hippocampal volume and time to walk 30 ft (r =−.12). No p value given.
Calculated: See Silbert et al. (2008) for Oregon Brain Aging Study data analysis.
Brain structure and gait speed plus grip strength or isometric knee extension strength (IKES)
29. Rosano et al. [60]
2010 Iceland, AGES-Reykjavik study
795 Longitudinal
cohort study
M 75.6 (5.4) F 75.6 (5.7)
41.1 MTR, ICV, brain parenchyma
volume, semiquantitative subcortical WMH and PVH and total WMH volume, brain atrophy index
Gait speed over 6 m usual speed and maximal isometric knee extension strength
Study: In men: Time to walk 6metres predicted by WMH volume (beta 0.13, p = 0.02) but not brain atrophy or peak height MTR (adjusted for age and brain size as includes measure of brain atrophy). In women: Usual walking speed predicted by lower MTR height (i.e. indicating abnormal brain tissue) (beta−0.14 (p = 0.01), increased WMH (beta 0.12, p = 0.003) and greater brain atrophy (beta 0.15, p = 0.01) (adjusted for age and brain size). Lower muscle strength associated with peak height MTR (p < 0.005, beta not given).
30. Aribisala et al. [61]
2013 UK, LBC 1936 study 694 Longitudinal
cohort study
69.5 (0.7) wave 1 and 72.5 (0.7) wave 2
52.9 TBV, ventricular volume,
GM, NAWM and WML at wave 2
6 metre walk (normal walking pace) and grip strength at wave 1 and 2
Study: Grip strength at wave 1 significantly predicts ventricular volume at wave 2 (standardized beta−0.10), however there was no significant association with other brain volumes. 6metre walk at wave 1 predicted TBV (−0.07), ventricular volume (0.09), NAWM (−0.07) and WML (0.11) all p < 0.05. Grip strength at wave 2 was associated with ventricular volume (−0.11) and NAWM (0.08). 6 MW at wave 2 was associated with TBV (−0.07), NAWM (−0.09) and WML (0.11) all p < 0.05. Change in physical function between wave 1 and 2 (i.e. decrease in grip strength or increase in 6 MW) was not significantly associated with any brain volume measure. GM volume did not significantly associate with any of the physical function variables at wave 1 or 2. All analyses were adjusted for age, ICV, age 11 IQ, years of education, social class, comorbidity and smoking status. Corrected for false discovery rate.
et
al.
BMC
Geriatric
s
2014,
14
:85
Page
14
of
35
w.biomedce
ntral.com/1
Table 3 Studies identified with brain structure and muscle function(Continued)
31. Rosano et al. [62]
2011 USA, Cardiovascular health study
643 Longitudinal
observational study
72.1-72.6 broken down by BP diagnosis
31-42.7 broken down by BP diagnosis
WMH scale 0-9 Gait speed over 15 ft,
starting from standstill. Grip strength of dominant hand.
Study: none, see Rosano (2012), Rosano (2006), Rosano (2005) and Longstreth (1996) for analysis using the Cardiovascular Health study dataset.
32. Rosano et al. [63]
2008 USA, Cardiovascular health study
3156 Longitudinal
observational study mean f/u 4 years
74 (4.6) 43.2 White matter disease
score, brain atrophy score (ventricular enlargement)
Gait speed over 15 ft and grip strength in dominant hand
Study: none, see Rosano (2012), Rosano (2006), Rosano (2005) and Longstreth (1996) for analysis using the Cardiovascular Health study dataset.
33. Longstreth et al. [64]
1996 USA, Cardiovascular health study
3658 Longitudinal
observational study
70.7 (no sd) 41.7 MR WMSA graded 0-9 Time to walk 15feet,
grip strength in dom and non-dom hand
Study: Time to walk 15 ft correlated with white matter grade (0–9) (r = 0.153, p < 0.001), with adjustment for age, sex and presence of clinically silent stroke on MRI. Same model showed no significant associated between grip strength in dom hand or non-dom hand and white matter grade (p > 0.05).
#
All brain structure variables performed using MRI.
*Associations column key: Study = results published within the study; Given = associations calculated by study authors and supplied to us for this review; Calculated = study authors supplied raw data to us and we performed the analysis.
et
al.
BMC
Geriatric
s
2014,
14
:85
Page
15
of
35
w.biomedce
ntral.com/1
Table 4 Studies identified with brain function and muscle structure
Author Year Country and dataset
n Study design Mean age
(sd)
Male (%)
Brain function Muscle structure
Associations*
1. Berryman et al. [65]
2013 Canada, Training Intervention Study
48 Baseline characteristics
from a large physical training intervention
study
70.8 (5.4) 41.67 MMSE & modified
Stroop test
LBM (DEXA) Study: none
Calculated: A GLM showed no association between LBM and MMSE, Stroop naming, reading or inhibition tasks, adjusted for sex and age. However there was an association between the Stroop flexibility task and LBM (t 2.126, p = 0.039, partial eta squared 9.3%), however after adjusting for education and height the effect was attenuated (p > 0.05).
2. Bites et al. [66]
2013 Chile 306 Retrospective study M 74.9 (61–91),
F 75.5 (69–90)
24.5 MMSE TLM, Arm LM
and Legs LM (DEXA)
Study: none
Calculated: Authors sent one data sheet for this study and Bunout et al., as there is a large amount of overlap between the studies. N = 401, mean age 75.3 (sd 4.8), males 28.7%. GLM performed adjusting for sex and gender. Total LM (t 2.38, p = 0.018, partial eta squared 1.4%) and Leg LM (t 3.53, p < 0.001, partial eta squared 3.1%) were both associated with MMSE score but Arm LM is not. After adjusting for height the relationship between total LM and MMSE is non-significant and between leg LM and MMSE is attenuated (t 2.09, p = 0.038, partial eta squared 1.1%).
3. Bunout et al. [67]
2005 Chile 298 RCT M 75.4 (4.8)
F 75.8 (4.7)
29.2 MMSE TLM, Arm LM
and Legs LM (DEXA)
Study: none
Calculated: See Bites et al. 2013 for analysis using this dataset
4. Auyeung et al. [68]
2013 Chinese University of Hong Kong
-4y f/u
3153 Prospective observational
study
M 71.76 (4.67) F 72.03 (5.07)
49.7 CSI-D and MMSE ASM, LLMM,
FFM (DEXA)
Study: none
Given: CS-CSID did not predict TLM or ASM at baseline or at 4 years (all p > 0.05). However baseline MMSE was associated with baseline TLM (rho = 0.058, p = 0.002) and ASM (rho = 0.061, p = 0.001) and at follow-up (TLM rho = 0.058, p = 0.002, ASM rho = 0.054, p = 0.005). MMSE at follow up was not associated with TLM or ASM at baseline or follow-up (p > 0.05).
et
al.
BMC
Geriatric
s
2014,
14
:85
Page
16
of
35
w.biomedce
ntral.com/1
Table 4 Studies identified with brain function and muscle structure(Continued)
5. Auyeung et al. [69]
2011 Chinese University of Hong Kong
-4y f/u
2737 Prospective observational
study
M 71.6 (4.58) F 71.5 (4.85)
55.3 CSI-D and MMSE ASM (DEXA) Study: In men, low baseline ASM
predicted lower MMSE score after 4 years (B = 0.246, p < 0.01) however after adjustment for age, years of education and baseline MMSE it no longer did (p > 0.05). In women, ASM did not significantly predict MMSE after 4 years, either before adjustment or after (p > 0.05).
Given: see Auyeung et al. (2013) for analysis using this dataset
6. Lee et al. [70]
2011 Chinese University of Hong Kong
4000 Prospective observational
study
M 72.3 (5.0) F 72.5 (5.3)
50 CSI-D and MMSE ASM, LLMM,
FFM (DEXA)
Study: none
Given: see Auyeung et al. (2013) for analysis using this dataset
7. Auyeung et al. [71]
2008 Chinese University of Hong Kong
-baseline
4000 Prospective observational
study
M 72.3 (5.0) F 72.5 (5.3)
50 CSI-D and MMSE ASM (DEXA) Study: none
Given: see Auyeung et al. (2013) for analysis using this dataset
8. Pedersen et al. [72]
2012 Denmark 72
controls
Cross-sectional study Median 53
(48–60 inter quartile range)
46 DART, WAIS-III information subtest, TMT-A&B, Rey Auditory Verbal Learning Test (RAVLT), Symbol Digit Modalities Test (SDMT), and fluency tests
FFM (DEXA) Study: None
Calculated: FFM did not predict the cognitive z score with or without adjusting for BMI and childhood intelligence (Danish Adult Reading Test, DART). The six individual cognitive tests were then analysed: FFM did not predict RAVLT, SDMT, category fluency (using animals) or TMT-b test, with or without adjusting for BMI and childhood intelligence (DART). Unadjusted, there was no significant association between the letter fluency test (using“s”) and FFM (P > 0.05), however after adjustment for BMI and DART, letter fluency was significantly associated with FFM (t 2.34, p = 0.02, partial eta squared 7.7%). TMT-a test did significantly predict FFM (t 3.08, p = 0.003, partial eta squared 12.3%). After adjusting for BMI and DART the relationship became non-significant.
9. Magri et al. [73]
2006 Italy 27
controls
Cross-sectional case–control study
Controls 33.3 (7.15)
0 MMSE FFM (BIA) Study: none
Calculated: FFM did not significantly predict MMSE (p > 0.05), adjusting for age. Adjustments for BMI and educational level did not significantly affect the results.
et
al.
BMC
Geriatric
s
2014,
14
:85
Page
17
of
35
w.biomedce
ntral.com/1
Table 4 Studies identified with brain function and muscle structure(Continued)
10. Lasaite et al. [74]
2009 Lithuania 29
healthy controls
Observational case–control study
66.2(6.3) 0 TMT-A and B and digit
span
FFM (BIA) Study: none
Calculated: FFM does not significantly predict TMT-A or B adjusting for age +/−height (p > 0.05). Trend with FFM predicting digit span (t 1.96, p = 0.06, partial eta squared 13%) but attenuated when adjusted for height in addition to age (p = 0.37).
11. Liu et al. [75]
2014 Taiwan, I-Lan
Longitudinal Aging Study
983 Population based ageing
cohort study
65.2 (9.3) 50.6 MMSE LBM and Relative
ASM (=ASM/ height2) (DEXA)
Study: A t test comparing mean MMSE in those with normal RASM and those within the lowest 20 % of RASM found a significant difference in men and women of all ages (p < 0.05).
Given: In a MLR, RASM did not predict MMSE after adjusting for age and sex (beta−0.003, p = 0.940). Adjusting for education in addition did not affect the results.
12. Moore et al. [76]
2012 USA, Baltimore
Longitudinal Study of Aging
786 Longitudinal cohort study 66.3 (range
26–96)
51.9 California Verbal Learning Test (CVLT), digit-span test, TMT A & B
Mid-femur thigh CSA (CT)
Study: none
Given: In a linear regression, none of the cognitive tests predicted thigh CSA, adjusting for age and gender. After adjusting for age, gender and height, the digit-span backward test became significantly associated with thigh CSA (beta−1.55, p = 0.024).
13. Kamijo et al. [77]
2014 USA, FITKids
Study
37 (healthy weight)
Cross-sectional study (case– control substudy comparing obese and healthy weight
children)
8.8 (0.6) 46 Kaufman Brief Intelligence
Test (K-BIT)
TLM (DEXA) Study: none
Calculated: Authors sent one data sheet for the FITKids study as there is considerable overlap in subjects between the two Kamijo et al. papers [77,78], (n = 139, mean age 8.8 (sd 0.6), male 51.1%). A GLM found that TLM did not predict K-BIT after adjustment for age and gender (p > 0.05). Adjusting for BMI in addition did not alter the results.
14. Kamijo et al. [78]
2012 USA, FITKids
Study
126 Cross-sectional study 8.9 (0.5) 50 Kaufman Brief Intelligence
Test (K-BIT)
TLM (DEXA) Study: none
Calculated: as per Kamijo et al. [77]
*Associations column key: Study = results published within the study; Given = associations calculated by study authors and supplied to us for this review; Calculated = study authors supplied raw data to us and we performed the analysis.
et
al.
BMC
Geriatric
s
2014,
14
:85
Page
18
of
35
w.biomedce
ntral.com/1
Table 5 Studies identified with measures of brain structure or function and muscle structure or function but no associations given in paper or on request
Authors Year Country and dataset n Study design Mean age (sd) Male (%) Brain structure or
function
Muscle structure or function
Studies with brain structure and muscle structure (re:Table2)
1. Chowdhury et al. [79]
1994 Sweden 8 Methodology paper 35 (8) 100 Brain volume (CT) Calculated skeletal muscle
volume (CT)
Studies with brain structure and muscle function (re:Table3)
2. Liu-Ambrose et al. [80]
2010 Canada, Exercise RCT in Vancouver
155 RCT, prospective over
52 weeks
69.6 (2.9) 0 Whole brain volume (MRI) Gait speed, quads strength
and muscle power
3. Nadkarni et al. [81]
2012 Canada, Sunnybrook Dementia Study
20 controls Cross-sectional substudy of longitudinal study
75 (9) 40 Score on Age-Related
White Matter Change Scale (MRI)
Self-selected speed on a treadmill
4. Sullivan et al. [82]
2005 USA, California, Stanford 51 Case–control study 45.2 (13.9) 100 Caudate, putamen, nucleus
accumbens and medial septal / diagonal band volumes and ICV (MRI)
Bilateral grip strength
Studies with brain function and muscle structure (re:Table4)
5. Guthrie et al. [83]
2004 Australia, The Melbourne Women's Midlife Health Project
1897 9 year prospective,
observational population based sample
Median 50 0 Episodic verbal memory
using a 10 word recall task (CERAD)
Body composition (DEXA)
6. Ellis et al. [84]
2009 Australian Imaging, Biomarkers and Lifestyle (AIBL) study of aging
768 healthy controls
Longitudinal case control study (AD vs MCI vs
normal)
70.0 (7.0) 43 CVLT-II, Logical memory,
RCFT, digit span, digit symbol coding, D-KEFS verbal fluency, BNT, clock, WTAR, Stroop.
Body composition (DEXA) in subgroup in Perth
7. Dao et al. [85]
2013 Canada, Exercise RCT in Vancouver
114 Secondary analysis of
RCT data
69.4 (2.9) 0 Stroop test, MMSE Sub-total lean mass (DEXA)
8. Schwartz et al. [86]
2013 Canada, Saguenay Youth Study
983 Longitudinal cohort
study
M 14.9 (1.8), F 15.1 (1.9)
48.8 Executive function and
Memory
FFM (BIA)
9. Bagger et al. [87]
2004 Denmark, PERF study 5607 Prospective, observational
cohort study
71.1 (6.6) 0 Short Blessed Test TLM (DEXA)
10. Abellan van Kan [88]
2013 France, EPIDOS study 3025 Prospective multi-centre
cohort study
80.51(3.9) 0 SPMSQ Lean mass and ALM (DEXA)
11. Nourhashemi et al. [89]
2002 France, EPIDOS study 7105 Cross-sectional study 80.3 (3.65)
(SPMSQ > =8)
0 SPSMQ for orientation,
concentration and memory
FFM (DEXA)
12. Nourhashemi et al. [90]
2001 France, EPIDOS study 7364 Prospective multicentre
study
Broken down by ADLs; means 79.9-82.7 years
0 Pfeiffer’s test (aka SPMSQ) Body composition (DEXA)
13. Paolisso et al. [91]
1997 Italy, Naples 30 (>50y), 30
(75-99y) 19 (>99y)
Observational study 44.5(1.8), 78(0.7), 102(0.8)
46.8 MMSE FFM (BIA)
et
al.
BMC
Geriatric
s
2014,
14
:85
Page
19
of
35
w.biomedce
ntral.com/1
Table 5 Studies identified with measures of brain structure or function and muscle structure or function but no associations given in paper or on request
(Continued)
14. Malaguarnera et al. [92]
2007 Italy, Sicily 66 Placebo controlled,
randomized, double-blind, 2-phase study
101(1.3) treatment, 101(1.4) placebo
31.8 MMSE Total muscle mass (BIA)
15. Jacobsen et al. [93]
2012 Netherlands 318 RCT Mean for each arm
given range 73.4-74.0
0 15 words test and Trails
B test
BIA and DEXA
16. Genton et al. [94]
2011 Switzerland 213 in 1999
and 112 in 2008
Cross-sectional study with 9 year f/u visit
1999 M 71.7(5.2) 1999 49.3 MMSE FFM (BIA), ASMM (DEXA) and
BCM (total body potassium)
2008 M 80.3(5.2) 2008 49.1
1999 F 73.2(5.5)
2008 F 82.2(5.6)
17. Donaldson et al. [95]
1996 USA, Baltimore 73 Cross-sectional study 68.8 (7.2) 31.5 MMSE FFM (DEXA)
18. Bove et al. [96]
2013 USA, Boston, Harvard 12 Cross-sectional study 31.6 (6.4) 0 Multiple tests broken
down to 5 cognitive domains
Cross sectional area of mid-thigh (CT)
19. Papadakis et al. [97]
1995 USA, California, San Francisco
104 Cross-sectional study 75.5(4.9) 100 MMSE, Trails B and DSST Lean tissue mass (DEXA)
20. Janssen [98] 2006 USA, Cardiovascular health study
Baseline 5036 Longitudinal observational study (over 8 years)
65-70 (42.7%), 71–76 (32.7%), 83–89 (18.2%),≥90 (6.4%)
43.6 MMSE Whole body muscle mass (BIA)
and normalized for height to the skeletal muscle index (SMI, kg/m2)
21. Masley et al. [99]
2008 USA, Florida 56 RCT Controls 43.5 (11.2),
Intervention 47.1 (9.4)
Control 39.3, Intervention
53.6
CNS vital signs battery FFM (BIA)
22. Houston et al. [100]
2012 USA, Health, Aging, and Body Composition study
2641 Longitudinal cohort study 74.7 (2.9) 48.9 MMSE Lean mass (DEXA)
23. Middleton et al. [101]
2011 USA, Health, Aging, and Body Composition study
197 Cross-sectional study from
a 9 year longitudinal cohort study
Separated into tertile of activity, means range from 73.9-75.8
Not given 3MS FFM (DEXA)
24. Koster et al. [102]
2010 USA, Health, Aging, and Body Composition study
2949 Cross-sectional study from
a 9 year longitudinal cohort study
Age 70–79 at baseline 48.5 3MS Total bone-free lean mass,
trunk lean mass, appendicular lean mass (DEXA)
25. de Rekeneire et al. [103]
2003 USA, Health, Aging, and Body Composition study
2926 Baseline data from a
9 year longitudinal cohort study
Diabetes mellitis (DM) 73.6 (2.9) and non-DM 73.6 (2.9)
DM 55.9 Non-DM 46.9
MMSE and DSST Lean mass and lean soft tissue
mass (i.e. lean mass minus bone) (DEXA)
26. de Rekeneire et al. [104]
2003 USA, Health, Aging, and Body Composition study
Fallers 652, non-fallers
2398
Baseline data from a 9 year longitudinal cohort
study
Range 70-79 Fallers 41.7,
non-fallers 50.3
Teng Mini-mental State Examination and DSST
Total muscle mass and skeletal muscle mass in the legs (DEXA)
27. Watts et al. [105]
2013 USA, Kansas, Brain Aging Project
74 healthy controls
Longitudinal case–control study (Alzheimer’s dementia vs. controls)
74.0 (7.2) 43 MMSE Lean mass (DEXA)
et
al.
BMC
Geriatric
s
2014,
14
:85
Page
20
of
35
w.biomedce
ntral.com/1
Table 5 Studies identified with measures of brain structure or function and muscle structure or function but no associations given in paper or on request
(Continued)
28. Canon et al. [106]
2011 USA, National Health and Nutrition Examination Survey (NHANES)
867 Cross-sectional
longitudinal study
Range 60-85 44.8 Digit-symbol coding test Lean tissue mass (DEXA)
29. Garry et al. [107]
2007 USA, New Mexico Aging Process Study
809 rolling participants (average 302 seen per year)
Longitudinal Aging study (1979–2003)
60+ Varied between years
40 3MS (annual), WAIS R digit
span, Fuld object memory evaluation, Color Trails 1 and 2, clock drawing (all less than annual)
Annual skeletal tissue mass (DEXA)
30. Haren et al. [108]
2008 USA, St Louis, African-American Health Study
124 Population based
longitudinal study
56.1(4.4) 100 MMSE, TMT A&B TLM and ASM (DEXA)
31. Dvorak et al. [109]
1998 USA, Vermont 30 Case–control study 73(7) 43.3 MMSE ASM and FFM (DEXA)
et
al.
BMC
Geriatric
s
2014,
14
:85
Page
21
of
35
w.biomedce
ntral.com/1
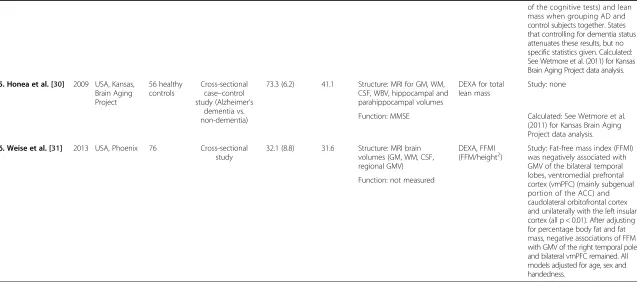
relationship between brain mass and body composition [26]. They performed multiple linear regression and found that after adjusting for age and fat mass, FFM pre-dicted brain mass in men (beta 0.023, R2 5%, p = 0.01) and women (beta 0.003, R2 6%, p = <0.0001). Fat mass or bone mineral content did not significantly predict brain mass in either sex. So they conclude that it is FFM that drives the relationship between body size and brain size not bone or fat mass. Weise et al. investigated the associations between regional grey matter volume and fat free mass index (FFMI = FFM/height2) [31]. They found several areas of grey matter volume that were sig-nificantly associated with FFMI (p < 0.01, see Table 2), however after adjusting for percentage body fat or fat mass only two areas remained significant (the right tem-poral pole and bilateral ventromedial prefrontal cortex).
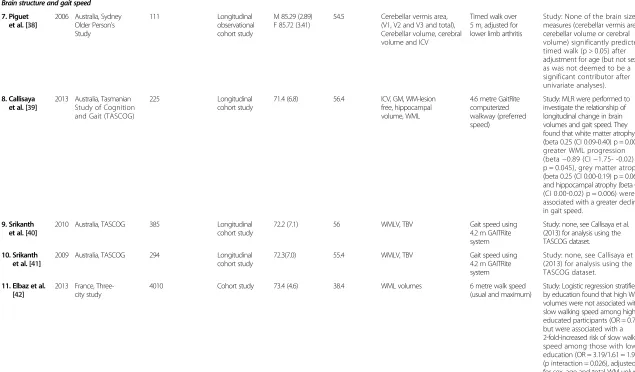
Association of brain structure and muscle function Thirty three studies which included measures of brain structure and muscle function were identified (Table 3). The muscle function variables most commonly studied were grip strength and gait speed. Only one study was identified which used a different measure of muscle function and that was maximal isometric knee extension strength (IKES) [60]. The brain structure variables in-clude: corpus callosum area, and volumes for total and regional GM and WM, cerebrospinal fluid (CSF), cere-bellum, hippocampus, basal ganglia and whole brain volume and measures of prevalence of WMH, either volume or scoring systems (e.g. Fazekas).
Brain structure and grip strength
The PATH through life project [32-35], the Cardiovascu-lar Health Study [55-57,62-64], the Lothian Birth Cohort 1936 study [61], a study from japan [36] and a study from Philadelphia [37] all looked at the relationship be-tween grip strength and brain structure.
There are four papers identified by our search strategy from the PATH through life project, which was set up to track and define the lifespan course of depression, anx-iety, substance use and cognitive ability. In one paper from this project, Anstey et al. (2007) studied the rela-tionship between the area of the corpus callosum (CC) (measured in three sections: anterior, midbody and pos-terior; and total area) and grip strength [33]. They used the grip strength from the hand the subject wrote with and adjusted for age, sex and ICV. They found no sig-nificant relationship between total, anterior or posterior CC area and grip strength however they found a positive relationship between midbody CC area and grip strength (beta −0.09, p < 0.05). They conclude that this is due to the association between midbody CC and the motor cor-tices. Another paper from the PATH through life project studied the association between grip strength and the
percentage of WM occupied by WMH in different brain areas [35]. They found that a larger percentage of WMH per WM volume is associated with decreased grip strength for both the total brain and several brain areas (frontal, temporal, parietal, anterior horn and periven-tricular body (all p < 0.01)). However, the amount of WMH in the occipital lobe, the cerebellum and the pos-terior horn was not associated with grip strength. The 2009 paper from this study further investigated the rela-tionship between WMH and grip strength [32]. This time they looked at the relationship in men and women separately. They found that larger amounts of WMH was associated with reduced grip strength, adjusting for age, depression severity and brain atrophy index, in men (p < 0.05) but not in women (n/s). However they com-ment that they feel that the relationship between WMH volume and motor function is likely to be the same in both sexes and that their finding may be due to the dif-ference in WMH amount between men and women in their study population. Sachdev’s 2006 paper from this study did not look at the relationship between motor function and brain structure and the authors did not re-spond to our data request [34].
The Cardiovascular Health Study (CHS) is a large, lon-gitudinal, observational study of risk factors for cardio-vascular disease in adults 65 years or older, which commenced in 1989 [52]. The CHS measured grip strength and gait speed and WMSA, however only one paper from this study looked at the relationship between grip strength and WMSA [64]. In this paper Longstreth et al. (1996) performed a partial correlation which found no significant association between grade of WMSA (graded on a scale of 0–9) and grip strength in either the dominant or non-dominant hand (p > 0.05) after adjusting for age, sex and presence of clinically silent stroke on MRI [64].
The Lothian Birth Cohort 1936 study measured grip strength at baseline and 3 years later at which point brain volumes were also measured [61]. It is the only study to look at longitudinal changes in muscle strength and brain structure. Grip strength at wave 1 predicted ventricular volume at wave 2 (standardized beta −0.10), however there was no significant association with other brain volumes and grip strength at wave 2 predicted ventricular volume (−0.11) and NAWM (0.08). There-fore, increased grip strength was associated with less brain atrophy in this wave. However, decreased grip strength over 3 years was not significantly associated with any brain volume measure.
used an index to intracranial volume to calculate degree of brain atrophy. No associations with the other mea-sured brain volumes were included in the paper.
The paper by Hardan et al. looked at the association between caudate volume and grip strength in both hands in children and young adults [37]. They found non-significant statistical trends using Pearson’s correlation between total caudate volume and mean grip strength in the right (r =−0.303, p = 0.05) and left (r =−0.28, p = 0.07) hands. The relationships are negative, therefore there is a trend that those with larger caudate nuclei were found to have lower grip strength in both hands.
Gait speed and brain structure
The Sydney Older Person’s Study [38], the TASCOG study [39-41], the Three-City Study [42-45], the AGES-Reykjavik study [60], ABC1921 study [46], WML and mobility study [52,53], further studies from Boston [47-51], the Cardiovascular Health Study [54-57,62-64], the Oregon Brain Aging Study [58,59], the LBC1936 study [61] all looked at the relationship between struc-tural brain measures and gait speed. There were 27 stud-ies identified to include in this section, making it the most researched association in our review. The measure-ment of gait speed varied considerably, with studies vari-ously using maximum speed or usual pace, and some studies requiring a turn halfway through the ment and others not. The distance used for the measure-ment also varied from 2.5 to 75 metres, however the most commonly used measure was usual pace over 6 metres.
The Sydney Older Person’s Study was set up to investi-gate the environmental, biological and social determi-nants of healthy ageing. Within it Piguet et al. looked at the relationship between timed walk over 5 meters, ad-justed for lower limb arthritis, and cerebellar vermis area (broken down into V1, V2 , V3 and total), and total cere-bellar volume. None of the measures of cerecere-bellar size/ volume significantly predicted the timed walk [38].
The Tasmanian Study of Cognition and Gait was set up to examine the role of age-related brain changes in causing problems with walking, balance and cognitive abilities in the general community. It measured brain volumes and usual walking speed over 4.6 metres at baseline and 31 months [39]. They found that a greater decline in gait speed over this period was associated with more WM atrophy and hippocampal atrophy and greater accumulation of WML (p < 0.05). There was a non-significant trend with GM atrophy and decline in gait speed (p = 0.06).
The Three-City study is a longitudinal study of the re-lation between vascular diseases and dementia in per-sons aged 65 years and older in France, which includes measures of WM volume and maximum walking speed
over 6 metres and a repeat walking speed test at the fourth follow up assessment (i.e. roughly 7 years after the first). There were four papers identified from this study which contained reference to these variables.
Soumare et al. looked at the association between WMH volume and both baseline walking speed and de-cline in walking speed over the 7 year follow up period [45]. They adjusted for age, gender, education and brain white matter volume. They found a significantly lower mean walking speed in those with a total WMH volume above the 75th percentile compare to those below the 25th. They found similar relationships for both deep WMH and periventricular hyperintensities (PVH), how-ever further analyses revealed that PVH may have more of an effect on walking speed than deep WMH. They also looked at WMH volume and the decline in walking speed over the follow up period. They found that having a WMH volume greater than the 90th percentile, more than doubled the risk of decline in walking speed com-pared with subjects with lower volumes of WMH. This finding was replicated when looking at PVH but not for deep WMH volume. Elbaz et looked at this association further and found that large WMH volumes were not associated with slow walking speed among highly edu-cated participants (OR = 0.72), but were associated with a 2-fold-increased risk of slow walking speed among those with low education (OR = 3.19/1.61 = 1.99) (p interaction = 0.026) [42]. Results remained un-changed after adjustment for height, BMI, and MMSE score.
Dumurgier et al. looked at GM volumes and gait speed in the same cohort and found that only basal ganglia volume (beta 0.075 (SE 0.025) p = 0.003) was signifi-cantly associated with walking speed; driven by caudate nucleus volume (beta 0.114 (SE 0.024) p < 0.001) [43]. All other regional GM volumes were not significantly as-sociated with walking speed.
The authors from the Three-City study provided fur-ther associations between the variables of interest on written request [39-41]. They looked at the relationship between WM volume and maximal walking speed at baseline, and walking speed decline over 31 months using a multiple linear regression (MLR) and found no significant association. Finally they performed a logistic regression between a one standard deviation increase in WM volume and the risk of having the highest walking speed decline, which was again not significant.