Available Online at www.ijpret.com 347
INTERNATIONAL JOURNAL OF PURE AND
APPLIED RESEARCH IN ENGINEERING AND
TECHNOLOGY
A PATH FOR HORIZING YOUR INNOVATIVE WORK
PROCESS SIMULATION ANALYSIS OF QUALITY MANAGEMENT SYSTEM IN
INDUSTRIES
PROF. HEMANT R. BHAGAT1, DR. V. G. ARAJPURE2, PROF. MEGHA LONDHEKAR3
1. Principal, DRGP, Amravati 2. Principal, KCOE, Jalgaon 3. Asst. Prof. JCOET, Yavatmal
Accepted Date: 05/03/2015; Published Date: 01/05/2015
\
Abstract: Now a day’s process simulation analysis is known as the key initiative of any quality
management system implemented in industries. Most of the industries adopt ISO 9000 clauses and TQM model guidelines to meet specific objectives as well as quality improvement. However by observing Indian scenario it can be easy to depict that most industries are not practicing software’s simulation analysis to predict the behavior of process variation and output. Present research paper will provide the concept of introducing the process simulation analysis supported by many software tools to support the organization about merits/demerits prior to execution and implementation of process management, the concept suggested in this paper will provide guidelines to many industrial practionors. While initiating process improvement objects.
Keywords: ISO 9000 QMS, Process Improvement, Process Analysis, Inventory Management,
Resource Utilization
Corresponding Author: PROF. HEMANT R. BHAGAT
Access Online On:
www.ijpret.com
How to Cite This Article:
Hemant R. Bhagat, IJPRET, 2015; Volume 3 (9): 347-354
Available Online at www.ijpret.com 348 INTRODUCTION
Building a good process simulation model can be a lot of work. But you could underutilize or even waste all of that effort by running the model once or twice, watching the animation, taking a few numbers you like out of output reports, and making process improvement recommendation based on those numbers. Instead, we recommend that you use proper statistical techniques and effectively analyze the model performance measures.1 You will gain tremendous benefits from the experimental power of simulation with this approach. First of all, you will greatly enhance the credibility of your simulation activity. Second, you will minimize the risk of making erroneous recommendations. This paper presents you with typical process performance measurements generated by simulation. It describes how simulation generates statics for these measures and what techniques to use for statistical output analysis. Then, it presents techniques for designing simulation experiments and evaluating the outcome of these experiments.
MODEL PERFORMANCE MEASUREMENTS
Measurements are the key. If you cannot measure it, you cannot control it. If you cannot control it, you cannot manage it. If you cannot manage it, you cannot improve it. It’s as simple as that. Measurements may be focused on finances, quality, resources, or investors. Process simulation aids in the improvement of quality-driven measurements, such as service level and waiting time, and resource driven measurements, such as cycle time and activity cost. In order to improve a process, you need to develop critical effectiveness, efficiency, and, adaptability measurements and targets for the process. Process effectiveness is how well the process meets the requirements of its end customers. Efficiency is the output per unit of input. It is a measure of how many resources the process uses to provide the output. Efficiency is for the benefit of the process owner whereas effectiveness is for the benefit of the customer. Process adaptability is the flexibility of the process to handle future, changing customer expectation and today’s special customer requests. Although process simulation focuses on analysis and improvement or efficiency measurements, it also provides indirect benefits for process
effectiveness and adaptability measurements3
ISO 9001:2008 QMS
Available Online at www.ijpret.com 349
efficiency of the QMS. The aim of this standard is improvement of the performance of the organization and satisfaction of customers and other interested parties. iv. ISO 19011 provides guidance on auditing and environmental management systems.
Together they form a coherent set of QMS standards facilitating mutual understanding in national and international business. New ISO 9001:2008 families of standards were published in November 2008.It focuses on how the provisions of this standard can be applied for continual improvement of quality and how it helps in international accreditation of an organization and its programmes. ISO 9000 is a generic standard and does not go into the details of how to run an individual organization and hence deals with high level principles only. The ISO 9001:2008 Revised standards are reborn in simpler, cleaner and more flexible form with major emphasis on process approach, customer satisfaction, continual improvement and use of Plan DO-CHECK-ACT (PDCA) principles. The shift from procedure to process based activity i.e. conformance to performance enables organization to link Business Objectives to Business Effectiveness more directly.
Cycle time
Cycle time is the total time a transaction spends traversing a process. This means cycle time includes value added process time, waiting time for resources and waiting time for conditions. Reducing total cycle time is a key issue in almost all critical business processes. Reducing total cycle time may reduce cost and improve the quality of the output; it can even increase sales. For example, if you cut product development cycle time, you will probably gain market share because you get your product to your potential customer earlier. If you reduce production cycle time, you can reduce inventory. If you reduce billing time, you will definitely improve cash flow. Out of the most valuable outputs of process simulation is the automatic tracking and calculation of cycle time. Every time a transaction enters the model through a GENERATE activity, the model logs in the entry time. When that transaction exits the model through a DISPOSE activity, the model logs in the exit time. The difference between the exit time and the entry time is the calculated cycle time for that instance of that transaction type. Armed with these data, a process simulation tool provides valuable statistics for average, standard deviation, and minimum and maximum cycle time measurements
Transaction Count
Available Online at www.ijpret.com 350
transaction departs the model through a DISPOSE activity, the throughput count is incremented.
Activity Cost:
When we define a resource in a process model, we define it in terms of the number of available units, usage costs, setup costs, and fixed costs. When we define an activity, we assign the resources required to perform it, the duration for the activity, and the transactions that it processes. During the simulation, the model automatically keeps track of the time each transaction spends in an activity and the time each resource is assigned to that activity. Activity cost calculations provide a realistic way for measuring an analyzing the costs of activities. Object-oriented process simulation tools allow detail breakdown of activity costs by resource or transaction type in addition to providing aggregated process costs6
Resource Utilization
Resource utilization statistics are time persistent statistics. During a simulation, resources change states from busy to idle, from unavailable to reserve. Resource utilization defines the percentage of time that a resource spends in each state. The availability and assignment of resources dictate the allocation of resources to activities in a model. So, the resource utilization results provide useful statistics in measuring and analyzing underutilization or overutilization of resources
Wait Time
Available Online at www.ijpret.com 351 Techniques for Stastical Analysis of Output
Whether you obtain useful output from your process simulation depends on the design of the simulation runs. This means deciding how long to run the simulation (one day, one week, or one year) and how many times to replicate the simulation. To obtain useful output and make meaningful recommendations, you could run a number of independent replications, each short, or you could use a single replication with a very long run. Traditional statistical techniques that work well for analyzing input data are not adequate for analyzing simulation output data. So, how do you perform output analysis of your process simulation model? Well, this is a very involved topic and there are many excellent books written on it. Rather than diving into great detail on this topic, we will briefly describe the concepts and commonly practiced techniques and provide you with references for additional reading on the topic7
Terminating Simulations
Terminating simulations have a definitive time or state for beginning and a definitive time or state for ending. For example, if you are interested in modeling the front-office processes in a bank, the start and end times for the simulation may be 9.00 a.m. to 4.00 p.m. or, if you are interested in modeling the front office processes during peak hours, the start and end times may be 11.30 a.m. and 1.30 p.m. terminating simulations repeat a cycle of starting empty, becoming busy for a while, and finally emptying again. For terminating simulations, deciding on simulation run length is easy; its the period during which you wish to analyze the process. As for the number of replications (or sample size), the following formula works well for establishing a statistically valid number of replications.
Available Online at www.ijpret.com 352
the simulation output from replication to replication is different; the simulation output from run to run would be the same
Nonterminating Simulations
Nonterminating or steady-state simulations do not have a specific start or end time. These simulations can go on and on forever without affecting the outcome of the performance
measures. There are two techniques for analyzing the output from nonterminating simulations.
Multiple-Replication Technique
This technique is essentially the same technique as used for analyzing terminating simulation output. So, what’s wrong with making a very long run and running multiple replications for nonterminating simulations? The problem is that the initial conditions you use to start the simulation (if you start with no transaction in the process) are probably not representative of steady-state performance of the process. Such conditions, of course, introduce biases into the simulation output. One approach for eliminating bias for non-terminating simulations is to define a warm-up period and remove the statistics collected during that period from the simulation output for analysis. In fact, most process simulation tools provide a way to do this. Those simulation tools that provide real-time graphing features make it easier to determine how long the warm-up period should be.
Batch-Means Technique:
An alternative technique to the multiple-replication technique is the batch-means technique. Since the ideal situation is to get as close to steady state as possible, you can make one very long simulation run. This gives you one replication, so you can’t really estimate variances nor do statistical analysis. The batch-means technique allows you to since the simulation into batches of observations and treats the means of these batches as independent and unbiased observations of steady-state performance. Because the simulation run is very long, the initial bias is not as server as with the multiple-replication technique.
Designing Simulation Experiments
Available Online at www.ijpret.com 353
and determine the performance measures of interest, you took the first steps toward designing simulation experiments. Unfortunately, we have seen many simulation projects in which users get too busy with the model-building tasks and do not follow through with the design of simulation experiments. Rather, these users simulate a few scenarios and move on to recommendations
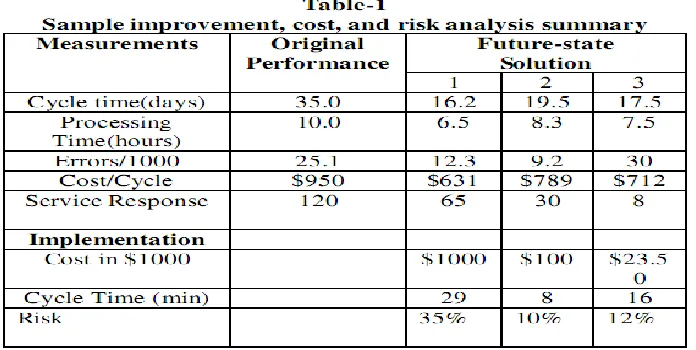
Selecting the Best-Value Future-State Solution:
As process simulation focuses on analysis and improvement of process efficiency measurements as well as some effectiveness and adaptability measures. To decide on which process is the correct one for the organization, an improvement, cost, and risk analysis of each alternative is needed. This analysis consists of two steps: i. Performance estimates of each future-state alternative, ii. Implementation estimates, including cost, time, probability of success, and major implementation problems
Table 1 shows a sample improvement, cost, and risk analysis summary. This analysis shows that, although the performance estimates of the new process design alternative are most desirable, implementation estimates make the process redesign alternative the best future-state solution.
CONCLUSION
Available Online at www.ijpret.com 354
by simulation. Multiple replication and confidence interval analysis are two useful techniques for analyzing model output. Whether you obtain useful output from your simulation model depends on the design of the simulation runs. The design simulation runs involves two considerations: i. How long the model is simulated, ii. How many replications are run.
REFERENCES
1. Banks, Jerry, ed., Handbook of simulation (New York: John Wiley & Sons, (1998)
2. “Does ISO certification support financial outcomes? An empirical Investigation of Indian
SMES”, International Journal of Industrial Engineering: Theory Application and practical’s, (2012)
3. Centeno, A. Martha, “An Introduction to Simulation Modeling,” Proceeding of the 1996
Winter Simulation Conference, 15-22 (2012)
4. Harrell, Charles H., and Kerim Tumay, Simulation Made Easy: A Manager’s Guide (Norcross
GA: Industrial Engineering and Management Press, (1995)
5. Harrington, H. James, Business Process Improvement: The Breakthrough Strategy for Total
Quality, Productivity, and Competitiveness, (1991)
6. Kelton, W. David, “Statistical Issues in Simulation,” Proceedings of the Winter Simulation
Conference, eds. John M. Charnes, Douglas J. Morrice, Daniel T. Brunner, and James J. Swain, 47-54, (1996)
7. Mathew A.O., Nair G.K. and Rodrigues L. L. R Systems Approach to Determine the
Significance of the Critical Success Factors of a Knowledge Management System, Research Journal of Management Sciences, 1(1), 28-36, August (2012)
8. Gill Mandip, Syed Farhat Ali, Gupta Barkha, Dubey Godulika, and Lad Kamna “Emotional