DOI 10.1007/s00122-014-2377-9
ORIGINAL PAPER
QTL analysis in multiple sorghum populations facilitates
the dissection of the genetic and physiological control
of tillering
M. M. Alam · E. S. Mace · E. J. van Oosterom · A. Cruickshank · C. H. Hunt · G. L. Hammer · D. R. Jordan
Received: 3 March 2014 / Accepted: 2 August 2014 / Published online: 28 August 2014 © Her Majesty the Queen in Right of Australia as represented by The State of Queensland 2014
target environments. The aims of this study were to identify QTL for tillering and component traits associated with the S/D balance or PTT, to develop a framework model for the genetic control of tillering in sorghum. Four mapping popula-tions were grown in a number of experiments in south east Queensland, Australia. The QTL analysis suggested that the contribution of traits associated with either the S/D balance or PTT to the genotypic differences in tillering differed among populations. Thirty-four tillering QTL were identified across the populations, of which 15 were novel to this study. Addi-tionally, half of the tillering QTL co-located with QTL for component traits. A comparison of tillering QTL and candi-date gene locations identified numerous coincident QTL and gene locations across populations, including the identification of common non-synonymous SNPs in the parental genotypes of two mapping populations in a sorghum homologue of MAX1, a gene involved in the control of tiller bud outgrowth through the production of strigolactones. Combined with a framework for crop physiological processes that underpin genotypic differences in tillering, the co-location of QTL for tillering and component traits and candidate genes allowed the development of a framework QTL model for the genetic control of tillering in sorghum.
Introduction
Tillering is an important trait for crop adaptation to spe-cific environmental (E) and management (M) conditions, because fertile tillers affect leaf area development (Ham-mer et al. 1987; Lafarge and Loiseau 2002) and ultimately grain yield (Miller et al. 1991). Depending on plant density, fertile tillers may account for up to 60 % of total plant leaf area and contribute from 5 to 80 % of grain yield (Lafarge and Hammer 2002). However, a trade-off between main
Abstract
Key message A QTL model for the genetic control of
tillering in sorghum is proposed, presenting new oppor-tunities for sorghum breeders to select germplasm with tillering characteristics appropriate for their target environments.
Abstract Tillering in sorghum can be associated with either the carbon supply–demand (S/D) balance of the plant or an intrinsic propensity to tiller (PTT). Knowledge of the genetic control of tillering could assist breeders in selecting germplasm with tillering characteristics appropriate for their
Communicated by Hai-Chun Jing.
Electronic supplementary material The online version of this
article (doi:10.1007/s00122-014-2377-9) contains supplementary material, which is available to authorized users.
M. M. Alam · E. J. van Oosterom
School of Agriculture and Food Sciences, The University of Queensland, Brisbane, QLD 4072, Australia
M. M. Alam
NuSeed Pty Ltd, 7 Tait St, Toowoomba, QLD 4350, Australia E. S. Mace (*) · A. Cruickshank · C. H. Hunt · D. R. Jordan Department of Agriculture, Forestry and Fisheries, Hermitage Research Facility, 604 Yangan Road, Warwick, QLD 4370, Australia
e-mail: [email protected] E. J. van Oosterom · G. L. Hammer
Queensland Alliance for Agriculture and Food Innovation, The University of Queensland, Brisbane, QLD 4072, Australia D. R. Jordan
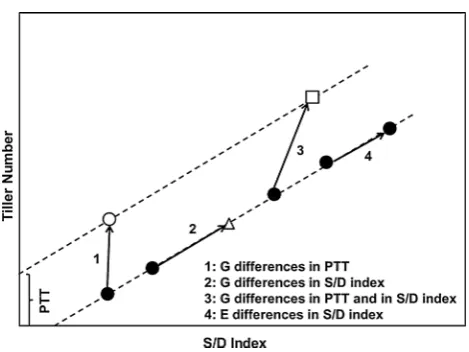
shoot and tillers can reduce grain yield in response to cer-tain E × M combinations (Lafarge and Hammer 2002), as fertile tiller number of sorghum depends on the E × M conditions in which the crop is grown (Hammer et al. 1993; Kouressy et al. 2008). In general, it is thought that high till-ering genotypes tend to be more suitable for environments with ample available water and high resource availability, because fertile tillers increase grain number per unit area, resulting in maximal conversion of available resources into grain. In contrast, in water limited environments, where grain yield is closely related to post-anthesis water avail-ability (Turner 2004), low tillering genotypes may be pre-ferred, as their smaller canopy size will reduce pre-anthe-sis water use (Hammer 2006; van Oosterom et al. 2011). Therefore, optimisation of tillering is critical to plant breed-ers aiming to match genotypes to their target environments. Tillering is a complex trait, controlled by multiple envi-ronmental and physiological factors, including hormonal regulation and competition for assimilates (McSteen 2009; McSteen and Leyser 2005). In sorghum, tillers appear when five to nine leaves have fully expanded (Lafarge and Hammer 2002), and genotypic differences in tillering are predominantly associated with differences in the fre-quency of lower-rank tillers (Kim et al. 2010a) that appear during the onset of tillering, when available resources are predominantly utilised for leaf biomass production and tillering. Therefore, traits that determine main shoot leaf area expansion are the main growth processes competing with tiller formation for assimilates (Kim et al. 2010a, b). Increased leaf length, leaf width, or leaf appearance rate each increases main shoot vigour and leaf area, which can reduce tillering (van Oosterom et al. 2011) via an effect on the carbon supply–demand (S/D) balance of the plant (Fig. 1). In addition, tiller formation can be determined by the propensity to tiller (PTT, Fig. 1) of a plant, which is the component of tillering that cannot be explained by the S/D balance of the crop (Kim et al. 2010a, b) and may represent the genetic control of tillering by hormonal regulation.
The dissection of tillering dynamics into underpinning physiological component traits can provide insights into the interactions of tillering with the E × M conditions experi-enced by the crop (Hammer et al. 2006). The observation that the phenotypic expression of component traits is gen-erally more robust across environments than the expression of the complex trait itself [reduced genotype (G) × E × M interactions] implies that component traits are likely to be under simpler genetic control. This could facilitate link-ing their phenotypic expression to the underpinnlink-ing QTL or genes. Previous studies revealed an association between tillering and traits related to S/D balance and PTT (Alam et al. 2014), but the genetic association between tiller-ing and its underpinntiller-ing component traits is still unclear. Although several candidate genes underlying the hormonal
regulation of tillering or branching in several crops have been identified (Beveridge and Kyozuka 2010; Doust
2007), the genetic regulation of tillering through resource competition is still unknown.
QTL analysis is a common approach for explaining the genetic basis of variation in complex traits (Barton and Keightley 2002; Symonds et al. 2005). The genetic architecture of a complex trait is likely to be controlled by multiple genes or alleles that vary with genetic back-ground (Lynch and Walsh 1998). A single mapping popu-lation study can therefore explain only a small part of the global genetic architecture of a complex trait. This limits the identification of potential genomic regions due to non-segregation of subsets of genes or alleles contributing to the genetic control of a complex trait such as tillering (Symonds et al. 2005). The comparison of QTL detected in multiple populations and multiple environments can help overcome the limitations of single population approaches. This permits investigation of the degree to which the under-lying genes contribute to variation in the phenotype under different genetic backgrounds and environmental condi-tions (Feltus et al. 2006).
The availability of the sorghum whole genome sequence (Paterson et al. 2009) and other genetic linkage map-based resources (Mace et al. 2009) provides opportuni-ties to compare linkage maps and QTL across populations and studies. To date, seven studies have identified tiller-ing QTL in sorghum (Feltus et al. 2006; Hart et al. 2001;
Fig. 1 Schematic representation of the effects of genotypic
Murray et al. 2008; Paterson et al. 1995; Shiringani et al.
2010; Takai et al. 2012; Upadhyaya et al. 2012). However, the co-location of tillering QTL with QTL for component traits has not yet been studied and such information could provide insights into the function of individual tillering QTL and their potential effects on tillering in the target environments.
The objectives of this study were to (1) identify QTL for tillering and component traits in individual mapping popu-lations, (2) project these QTL on to the sorghum consensus map to identify co-location of tillering and component trait QTL with previously reported tillering QTL from other studies, and (3) combine this information with knowledge of physiological control of tillering to construct a QTL model for the genetic control of tillering in sorghum.
Materials and methods
Mapping populations
The experiments included four mapping populations seg-regating for tillering, developed by the sorghum breeding program of the Department of Agriculture, Forestry and Fisheries (DAFF), formerly the Queensland Department of Primary Industries (Table 1). The populations consisted of three F2-based recombinant inbred lines (RILs) that had previously been genotyped (Mace et al. 2009). These popu-lations were coded following Mace et al. (2009). In addi-tion, a fourth population consisting of 214 BC1F1 derived RILs was produced by crossing R931945-2-2 (a parent of the S4 population) with S. bicolor subsp. verticilliflorum (a wild sorghum) to produce an F1 plant. The F1 plant was
then backcrossed to R931945-2-2 to produce individual BC1F1 plants that were subsequently advanced by single seed descent to produce the RILs. During this process, selection was practised to remove individuals with exces-sive height, delayed maturity, and seed shattering.
Experimental details
The four RIL mapping populations were grown in three experiments at Warwick, southeast Queensland, Aus-tralia (28°10′S, 152°02′E) on a Talgai shallow phase and
Ellinthorp clay soil (Shyamsunder et al. 1975). Experi-ments were sown on 10 December 2003 (WAR04; S7 only), 26 November 2004 (WAR05; S7 only), 9 Decem-ber 2008 (WAR08; S2, S4, and S5), 9 DecemDecem-ber 2009 (WAR09; S2 and S4), and 3 February 2010 (WAR10; S5 only). All the experiments consisted of single row plots of 4.75 m length with a row spacing of 0.75 m. Experiments were laid out in a partially replicated row × column design with the parental genotypes replicated four to six times. Experiments were fertilised and cultivated before planting and were fed. However, they received sufficient rain-fall prior to sowing to ensure that they were not subjected to levels of drought stress that would prevent emerged tillers from progressing to produce a panicle. Weeds and insects were controlled as required. Daily radiation, minimum and maximum temperature, and rainfall were obtained from a weather station located in close proximity to each of the experiments. Thermal time was calculated using 11, 30, and 42 °C for the base, optimum, and maximum ture and using linear interpolations between these tempera-tures (Hammer et al. 1993).
Phenotypic trait measurement
Fertile tiller number per plant was observed in all experi-ments, but leaf length, leaf width, and phyllochron were measured only in WAR09 (S2 and S4) and WAR10 (S5). The average number of fertile tillers per plant was meas-ured at the time of flowering from 1 m length of row of each plot by dividing number of heads by number of plants and subtracting one. Adjusted tiller number per plant was estimated using plant density as a covariate. Fully expanded leaf number (ligule visible above ligule of pre-vious leaf) on the main shoot was recorded once a week on one selected plant per plot. Phyllochron (Phyl) was calculated as the inverse of the slope of the regression of fully expanded leaf number on cumulative thermal time (°Cd leaf−1). The final area of main shoot leaves 5 and 9
was obtained for the same plants from their final length and maximum width, multiplied by a shape factor of 0.69 (Kim et al. 2010b). A generic measure of the increase in size of successive leaves between leaves 5 and 9 was obtained as the leaf length increase rate (LLIR5–9) and leaf width increase rate (LWIR5–9). These parameters represent the
Table 1 Details of the four mapping populations used in the current study
Pop code Pop pedigree Generation Pop size No of markers Predominant marker type
S2 ICSV745/R890562 RIL 119 488 RFLP
S4 IS8525/R931945-2-2 RIL 146 410 DArT
S5 B923296/SC170-6-8 RIL 141 337 DArT
slope of the relationships between final leaf length or maxi-mum leaf width and leaf number and represent demand for assimilates by the main shoot (Kim et al. 2010a).
The phenotypic data were used to calculate a plant-level carbohydrate supply–demand (S/D) index (Alam et al.
2014) that quantifies environmental and genotypic effects on the carbon balance and hence on tillering (Fig. 1):
where RADLED5 is the average incident global radiation per unit thermal time (MJ m−2 °Cd−1) during expansion
of main shoot leaf 5 (LED5 °Cd) and LA5 is the fully expanded area of leaf 5. Genotypic differences in tillering not associated with the carbon S/D index represent the pro-pensity to tiller (PTT), which was calculated as the tiller number when S/D index is zero in the regression of tiller number on S/D index (Fig. 1). As the S/D index could only be calculated for individual plots in the single environ-ment for each population in which phyllochron, LLIR, and LWIR were measured (WAR09 and WAR10), PTT was cal-culated as the intercept with the y-axis of the regression of tiller number on S/D index, using a common slope (0.0083) for the regression, obtained in a previous study on a large number of genotypes (Alam et al. 2014). Therefore, the PTT of the nth plot was calculated as:
Statistical analysis of phenotypic data
Statistical analyses were conducted in ASREML-R (Butler et al. 2007) using the REML mixed model approach allow-ing for spatial variation across each experiment (Gilmour et al. 1997) to predict genotypic values for each location. Genotype was included as a fixed effect and Best Linear Unbiased Estimates (BLUEs) were predicted for each gen-otype in each experiment. These BLUEs, along with their respective standard errors, were estimated for each trait of interest (LLIR, LWIR, phyllochron, PTT and fertile tiller number per plant, TN) for each of the three RIL populations.
Linkage map construction
For each RIL mapping population, a linkage map was developed using markers that had previously been geno-typed. For the S2 population, a total of 488 markers (234 DArTs, 10 SSRs and 244 RFLPs) were used to construct the genetic linkage map. After excluding the redundant loci, 305 framework markers were mapped to 12 LGs with a total length of 1,487.96 cM. For S4, a total of 410 markers (357 DArTs, 51 SSRs and two morphological) were used to construct the linkage map. After excluding 114 redundant markers, the remaining 296 markers were mapped to 13 (1)
S/D index=RADLED5×LA5×Phy(Ligule to ligule)
LLIR5−9×LWIR5−9
(2)
PTTn= TNn−0.0083 × SDn
LGs with a total length of 1,390.20 cM. For the S5 popu-lation, the genetic linkage map was constructed using 248 unique DArT markers, out of a total of 337 markers, cov-ering 2,264.45 cM across 17 LGs. Linkage maps for these three RIL populations were constructed using MultiPoint (Mace et al. 2009). The S7 population was genotyped with 467 DArT markers. However, due to the backcross nature of this population and the selection applied for maturity, the standard genetic linkage mapping approaches typi-cally applied to bi-parental crosses were not appropriate and hence the sorghum consensus map (Mace et al. 2009) marker locations were used.
QTL analysis
QTL analyses of LLIR, LWIR, phyllochron, PTT and fertile tiller number per plant (TN) were conducted for the three RIL mapping populations × experiment combinations for which data were available. Single marker analysis (SMA) and com-posite interval mapping (CIM) were conducted using QTL Cartographer for Windows v2.5 (Wang et al. 2011) on each of the five traits. Association between individual markers and each trait was initially evaluated using SMA, prior to analy-sis using CIM. Background markers for inclusion in the CIM model were selected by forward stepwise regression for each trait. The five most significant background markers were then used for analysis (default). The ‘walking speed’ was set at 2 cM and the ‘window size’ at 10 cM for CIM. A conserva-tive permutation threshold at the 0.01 significance threshold was obtained for each trait using 1,000 permutations. 1-LOD and 2-LOD support intervals were determined as described by Lander and Botstein (1989). The additive effects and per-centage of variation explained (R2) for all significant QTL
were determined at their peak LOD values. The significance level of each trait in each of the three RIL mapping popula-tions was obtained by permutation analyses using Map Man-ager QTX software (Manly et al. 2001) (ESM Table S1). QTLNetwork v2.0 (Yang et al. 2008) was used with default settings to search for epistatic effects among markers. The graphical representation of the map and identified QTL was created using MapChart software (Voorrips 2002).
Verbyla et al. (2007) and Smith et al. (2011), which include all markers in the model simultaneously as random effects together with a random genotype term to account for vari-ation not explained by the markers. The random marker effects are assumed independent and follow a normal distri-bution with zero mean and a common variance; this normal-ity allows for statistical testing for significant effects due to markers. Missing values in the marker data were imputed using the R package impute (Hastie et al. 2012).
QTL projection on consensus map
To compare the location of the QTL identified in the four separate mapping populations with tillering QTL identified in previous studies, the identified QTL for all traits included in this study, plus tillering QTL identified previously in seven different studies (Table 2), were projected onto the sorghum consensus map developed by Mace et al. (2009), following the strategy detailed by Mace and Jordan (2011).
Results
Environmental effects on tillering
Cumulative incident radiation for the first 45 days after emergence, when most tillers appear, was 1,020 MJ m−2 in
WAR04, 1,060 MJ m−2 in WAR05, 1,150 MJ m−2 in WAR08,
1,000 MJ m−2 in WAR09, but only 800 MJ m−2 in WAR10.
In contrast, cumulative thermal time during the same period ranged from 550 °Cd in WAR09 and 530 °Cd in WAR04 to 475 °Cd in WAR05 and 450 °Cd in WAR08 and WAR10. Consequently, radiation per unit thermal time, which deter-mines the S/D index, was generally above 2.0 MJ m−2 °Cd−1
during tiller emergence at WAR05 and WAR08, but below 2.0 MJ m−2 °Cd−1 at WAR04, WAR09, and WAR10.
Con-sistent with this, fertile tiller number was generally greater at WAR08 than at WAR09 and WAR10 (Table 3).
Phenotypic variability of tillering and relevant component traits
The predicted means, ranges, and standard deviations for the traits measured for the RILs and parents of three map-ping populations are detailed in Table 3. For the parents of population S2, R890562 had greater tiller numbers than ICSV745 in both experiments and this was associated with lower LLIR and LWIR and greater S/D index. As differ-ences in PTT and phyllochron were minor, parental dif-ferences in tillering were predominantly associated with differences in organ size. The RILs showed transgressive segregation for all traits. For S4, parent IS8525 produced more tillers than R931945-2-2 in both experiments. IS8525 also had slightly lower LWIR, but greater LLIR and slightly lower S/D index than R931945-2-2. However, its PTT was greater, suggesting that PTT played a larger role in deter-mining parental differences in tillering than in the S2 popu-lation. Similar to S2, the RILs showed transgressive segre-gation for all traits in both directions. In the S5 population, SC170-6-8 produced more tillers than B923296 in all three experiments. Increased tillering was predominantly asso-ciated with greater PTT, as parental differences for size related component traits were negligible. These small dif-ferences resulted in transgressive segregation for all traits in the RIL population. The S.bicolor subsp.
verticilliflo-rum parent could not be grown in field trials because of its weedy nature, but visual observations of pot grown plants used for producing the cross indicated that it had very high tillering compared with R931945-2-2. In summary, paren-tal differences in tillering appeared to have contrasting physiological causes across the mapping populations.
QTL analysis
The results of the QTL analysis for each trait in each pop-ulation are shown in Tables 4, 5, 6, and 7 (ESM Figures S1–S4).
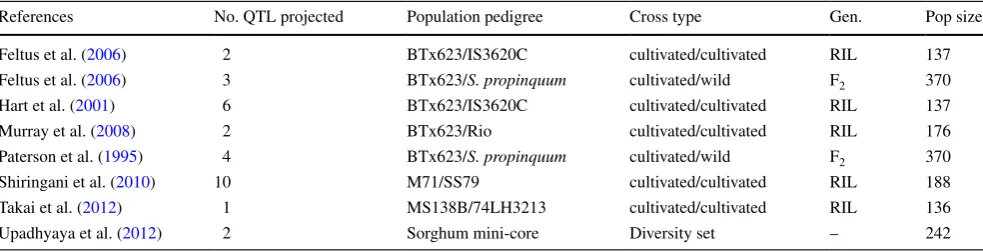
Table 2 Details of QTL for tiller number, previously identified from seven published studies, that were projected onto the consensus sorghum
map
Details include the population pedigree, cross type, generation, and population size
References No. QTL projected Population pedigree Cross type Gen. Pop size
Feltus et al. (2006) 2 BTx623/IS3620C cultivated/cultivated RIL 137
Feltus et al. (2006) 3 BTx623/S. propinquum cultivated/wild F2 370
Hart et al. (2001) 6 BTx623/IS3620C cultivated/cultivated RIL 137
Murray et al. (2008) 2 BTx623/Rio cultivated/cultivated RIL 176
Paterson et al. (1995) 4 BTx623/S. propinquum cultivated/wild F2 370
Shiringani et al. (2010) 10 M71/SS79 cultivated/cultivated RIL 188
Takai et al. (2012) 1 MS138B/74LH3213 cultivated/cultivated RIL 136
Fertile tiller number
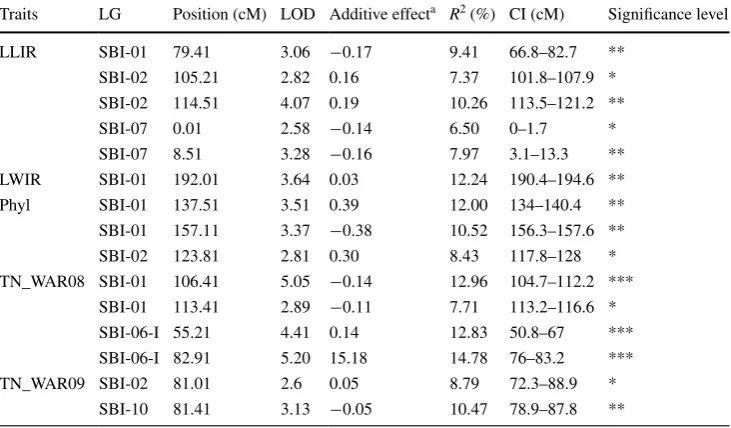
In population S2, CIM identified three highly significant tillering QTL in WAR08, one on 01 and two on SBI-06-I (Table 4, ESM Figure S1). In addition, a significant QTL was detected on SBI-10 in WAR10 and two sugges-tive QTL were detected on SBI-01 (WAR08) and SBI-02
(WAR10). As the peaks of the two tillering QTL on SBI-01 were only 7 cM apart, these may represent the same QTL. Individual QTL explained 7.7–14.8 % of pheno-typic variation in tillering. The allele increasing the num-ber of fertile tillers came from R890562 for the QTL on SBI-06-I, and from ICSV745 for the QTL on SBI-01 and SBI-10.
Table 3 Predicted mean (X¯)
values for the three RIL populations (S2, S4, and S5) and the two parents, plus the standard deviation (σ) and range (minimum and maximum) for each RIL population for leaf length increase rate from leaf 5–9 (LLIR), leaf width increase rate from leaf 5–9 (LWIR), phyllochron (Phyl), carbon supply–demand index (SD), propensity to tiller (PTT) and fertile tiller number per plant (TN), sown at Warwick in 2008 (WAR08), 2009 (WAR09), and 2010 (WAR10)
Statistics LLIR LWIR Phyl SD PTT ID TN
WAR08 WAR09 WAR10
ICSV745 × R890562 (S2)
¯
XRIL 7.13 0.92 30.43 170.37 −0.46 19.27 1.17 0.96 –
¯
XICSV745 7.62 1.06 30.47 119.66 −0.12 27.05 0.98 0.87 –
¯
XR890562 6.76 0.82 29.86 157.72 −0.24 19.94 1.20 1.07 –
σRIL 0.55 0.08 1.01 28.55 0.33 1.44 0.40 0.15 –
MinRIL 5.10 0.65 28.09 88.27 −1.88 15.67 0.17 0.39 –
MaxRIL 8.33 1.18 33.42 342.36 0.29 23.44 2.00 1.33 –
IS8525 × R931945-2-2 (S4)
¯
XRIL 7.61 1.16 30.5 147.57 −0.31 18.52 1.20 0.92 –
¯
XIS8525 9.44 1.15 30.63 119.14 0.14 16.93 1.36 1.13 –
¯
XR931945-2-2 8.02 1.24 30.54 140.24 −0.59 22.79 1.13 0.57 –
σRIL 0.73 0.09 0.77 22.65 0.35 1.67 0.24 0.33 –
MinRIL 4.68 0.88 29.03 99.88 −1.23 14.45 0.54 0.03 –
MaxRIL 9.62 1.42 33.65 245.98 0.68 22.53 1.79 1.88 –
B923296 × SC170-6-8 (S5)
¯
XRIL 6.69 1.14 29.37 237.56 −0.91 18.53 1.53 – 1.07
¯
XB923296 6.81 1.13 28.73 237.92 −1.01 18.06 1.20 – 0.97
¯
XSc170-6-8 6.45 1.10 28.68 211.00 −0.23 18.07 2.34 – 1.52
σRIL 0.17 0.06 0.59 33.22 0.39 0.24 0.24 – 0.27
MinRIL 6.21 0.93 27.77 174.23 −2.14 17.82 1.01 – 0.30
MaxRIL 7.09 1.26 30.63 422.51 0.21 19.00 2.36 – 1.94
Table 4 Summary of QTL
analyses for fertile tiller number (TN) and three component traits (LLIR: leaf length increase rate from leaf 5 to 9; LWIR: leaf width increase rate from leaf 5 to 9; Phyl: phyllochron) identified in the S2 population, detailing the QTL location [LG, position (cM), and CI], peak LOD score, additive effect, phenotypic variance explained (R2) and significance level
* Suggestive; ** Significant; *** Highly significant a The allelic effects are calculated as the effect of substitution of AA (ICSV745) allele by BB (R890562) allele
Traits LG Position (cM) LOD Additive effecta R2 (%) CI (cM) Significance level
LLIR SBI-01 79.41 3.06 −0.17 9.41 66.8–82.7 **
SBI-02 105.21 2.82 0.16 7.37 101.8–107.9 *
SBI-02 114.51 4.07 0.19 10.26 113.5–121.2 **
SBI-07 0.01 2.58 −0.14 6.50 0–1.7 *
SBI-07 8.51 3.28 −0.16 7.97 3.1–13.3 **
LWIR SBI-01 192.01 3.64 0.03 12.24 190.4–194.6 **
Phyl SBI-01 137.51 3.51 0.39 12.00 134–140.4 **
SBI-01 157.11 3.37 −0.38 10.52 156.3–157.6 **
SBI-02 123.81 2.81 0.30 8.43 117.8–128 *
TN_WAR08 SBI-01 106.41 5.05 −0.14 12.96 104.7–112.2 ***
SBI-01 113.41 2.89 −0.11 7.71 113.2–116.6 *
SBI-06-I 55.21 4.41 0.14 12.83 50.8–67 ***
SBI-06-I 82.91 5.20 15.18 14.78 76–83.2 ***
TN_WAR09 SBI-02 81.01 2.6 0.05 8.79 72.3–88.9 *
In population S4, three significant QTL were identified by CIM analysis on SBI-05 (WAR09), SBI-07 (WAR09), and SBI-08-II (WAR08) (Table 5, ESM Figure S2). The QTL on SBI-08-II co-located with a suggestive QTL iden-tified in WAR09. Additional suggestive QTL were identi-fied on SBI-06 (WAR08) and SBI-08-I (WAR09). Indi-vidual QTL explained 6.6–11.4 % of phenotypic variation for tillering. All QTL, except those on SBI-08-II, showed negative additive effects (Table 5), indicating that parent
R931945-2-2 QTL alleles predominately contributed to a decrease in fertile tiller number.
In population S5, CIM analysis identified two highly significant QTL on SBI-04 that were identified in WAR08 (Table 6, ESM Figure S3). In addition, four significant QTL were located on SBI-06-III, SBI-08-II (two QTL), and SBI-10. One suggestive QTL on SBI-10 was also identified in WAR10. All significant QTL, except the one on SBI-10, had positive additive effects, indicating that
Table 5 Summary of QTL
analyses for fertile tiller number (TN), four component traits (LLIR: leaf length increase rate from leaf 5 to 9; LWIR: leaf width increase rate from leaf 5 to 9; Phyl: phyllochron; PTT: propensity to tiller) identified in the S4 population, detailing the QTL location [LG, position (cM), and CI], peak LOD score, additive effect, phenotypic variance explained (R2) and significance level
* Suggestive; ** Significant; *** Highly significant a The allelic effects are calculated as the effect of substitution of AA (IS8525) allele by BB (R931945-2-2) allele
Traits LG Position (cM) LOD Additive effecta R2 (%) CI (cM) Significance level
LLIR SBI-07 0.01 2.93 −0.26 8.02 0–1.6 *
SBI-08-I 1.01 2.83 −0.24 9.97 0–2.9 *
LWIR SBI-02 79.61 2.62 −0.03 8.23 76.1–82.4 *
SBI-07 103.01 3.31 0.03 9.21 99.9–104.4 **
SBI-10 45.01 2.66 −0.03 7.58 43.4–46.6 *
Phyl SBI-03 53.01 3.03 −0.24 8.66 43–59.5 **
SBI-05 101.31 2.55 −0.24 6.65 100.8–106.1 *
PTT SBI-04 32.41 2.90 −0.10 7.73 25.8–34 **
SBI-07 112.61 2.35 −0.09 6.46 100.6–122.6 *
SBI-08-II 0.01 2.69 0.10 7.16 0–4.3 *
TN_WAR08 SBI-06 71.01 2.64 −0.07 7.67 69.9–78.1 *
SBI-08-II 0.01 4.13 0.08 11.44 0–4.3 **
TN_WAR09 SBI-05 31.91 3 −0.1 9.27 20.9–42.1 **
SBI-07 110.41 3.75 −0.11 11.29 102.9–121.7 **
SBI-08-I 4.61 2.76 −0.11 7.59 4–5.9 *
SBI-08-II 0.01 2.55 0.09 6.61 0–10.5 *
Table 6 Summary of QTL analyses for fertile tiller number (TN)
and three component traits (LWIR: leaf width increase rate from leaf 5–9; Phyl: phyllochron; PTT: propensity to tiller) identified in the S5
population, detailing the QTL location [LG, position (cM), and CI], peak LOD score, additive effect, phenotypic variance explained (R2) and significance level
* Suggestive; ** Significant; *** Highly significant
a The allelic effects are calculated as the effect of substitution of AA (B923296) allele by BB (SC170-6-8) allele
Traits LG Position (cM) LOD Additive effecta R2 (%) CI (cM) Significance level
LWIR SBI-04 161.61 4.83 −0.03 19.31 155–164.6 **
SBI-04 167.91 4.36 −0.03 19.23 165.2–170.9 **
SBI-08-II 29.91 2.56 0.02 8.18 1.4–33 *
Phyl SBI-05-IB 59.91 2.67 −0.40 8.94 57.8–63.3 *
PTT SBI-04 34.61 5.93 0.16 15.08 28.6–37.9 ***
SBI-04 47.61 5.68 0.16 14.97 44.6–47.9 ***
SBI-10 162.91 2.55 −0.10 6.12 159.1–166.9 *
TN_WAR08 SBI-04 35.01 7.53 0.11 18.18 34.6–38 ***
SBI-04 50.11 7.65 0.12 21.71 45.4–59.1 ***
SBI-06-III 2.01 3.08 0.07 7.85 0–5.5 **
SBI-08-II 132.11 3.27 0.07 8.45 125.1–139.9 **
TN_WAR10 SBI-08-II 117.11 3.64 0.09 11.09 107.9–123.5 **
SBI-10 137.11 2.59 −0.08 8.26 136.3–142.8 *
parent SC170-6-8 QTL alleles predominately contributed to increased fertile tiller number. Individual QTL explained 7.8–21.7 % of phenotypic variation in tillering (Table 6).
In population S7, the mixed model marker analysis identified three QTL for tiller number at p < 0.001 (0.1 % false discovery level) at WAR04 (SBI-03 and two QTL on SBI-09) and an additional six QTL at p < 0.01 on SBI-01, SBI-02, SBI-03, SBI-04, SBI-06, SBI-09 (Table 7, ESM Figure S4). At WAR05, two QTL for tiller number were detected at p < 0.001 (SBI-04, SBI-09), both of which were also identified in WAR04. An additional four QTL for tiller number were detected at the p < 0.01 level (01, SBI-02, SBI-03, SBI-06), only one of which (SBI-03) was also identified in WAR04. Of the 15 QTL identified across both experiments, only one had a negative allelic effect, indicat-ing that the S. bicolor subsp. verticilliflorum QTL alleles predominantly contributed to an increase in fertile tiller number.
Leaf length increase rate (LLIR)
In population S2, CIM identified three significant QTL for LLIR on SBI-01, SBI-02, and SBI-07 (Table 4, ESM Fig-ure S1). In addition, two suggestive QTL were detected on SBI-02 and SBI-07, but as the peaks of both of these QTL were only 9 cM away from the peak of a significant QTL, these suggestive QTL may be the same as the significant QTL. Individual significant QTL explained 8.0–10.3 % of
phenotypic variation for LLIR. The allele increasing LLIR came from R890562 for the QTL on SBI-02, and from ICSV745 for the QTL on SBI-01 and SBI-07. CIM analysis in population S4 only identified two suggestive QTLs on SBI-07 and SBI-08-I (Table 5, ESM Figure S2). Both had negative additive effects, indicating that parent R931945-2-2 QTL alleles predominantly contributed to a decrease in LLIR. No QTL for LLIR were identified in population S5.
Leaf width increase rate (LWIR)
In population S2, CIM identified one significant QTL for LWIR on SBI-01 that explained 12.2 % of the phenotypic variation (Table 4, ESM Figure S1). It had a positive addi-tive effect, indicating that the R890562 allele increased LWIR. In population S4, CIM identified one signifi-cant QTL on SBI-07 and two suggestive QTL on SBI-02 and SBI-10 (Table 5, ESM Figure S2). Individual QTL explained 7.6–9.2 % of the phenotypic variation. The allele increasing LWIR came from R931945-2-2 for the signifi-cant QTL on SBI-07 and from IS8525 for the suggestive QTL. In population S5 (Table 6, ESM Figure S3) two significant QTL were identified on SBI-04 and one sug-gestive QTL on SBI-08-II. The two significant QTL each explained over 19 % of phenotypic variation, but were only 6 cM apart and therefore may represent the same QTL. Their negative additive effect indicated that the SC170-6-8 allele decreased LWIR.
Phyllochron (Phyl)
In S2, CIM identified two significant QTL for Phyl on SBI-01 and a suggestive QTL on SBI-02 (Table 4, ESM Fig-ure S1). Although the two QTL on SBI-01 were in close proximity, their opposite additive effects indicated that the parent ICSV745 had alleles contributing to both increased and decreased Phyl. Another significant QTL was identified on SBI-03 in S4 (Table 5, ESM Figure S2). It explained 8.7 % of variation in Phyl and had a negative additive effect. An additional suggestive QTL was identified on SBI-05 (Table 5, ESM Figure S2). No significant QTL for Phyl were identified in S5, with only a suggestive QTL observed on SBI-05-IB (Table 6, ESM Figure S3). This QTL explained 8.9 % of variation in Phyl and the allele increasing Phyl came from B923296.
Propensity to tiller (PTT)
For PTT, two highly significant QTL were detected in S5 (Table 6) and one significant QTL in S4 (Table 5), all on 04. Additional suggestive QTL were detected on SBI-07 and SBI-08-II in S4 and on SBI-10 in S5. Individual QTL explained 6.5–7.7 % of phenotypic variation for PTT
Table 7 Summary of QTL analyses for fertile tiller number (TN)
identified in the S7 population, detailing the QTL location [LG, and Peak (cM)], peak –log10P score, allele effect and significance level
** Significant; *** Highly significant
a The allelic effects are calculated as the effect of substitution of AA (R931945-2-2) allele by BB (S. bicolor subsp. verticilliflorum) allele
Trait LG Peak
(cM) −
log10P Allele
effecta Significance level
TN_WAR04 SBI-01 9.6 2.99 0.25 **
TN_WAR04 SBI-02 54 2.26 0.25 **
TN_WAR04 SBI-03 4.2 2.46 −0.26 **
TN_WAR04 SBI-03 128.2 3.75 0.34 ***
TN_WAR04 SBI-04 117.4 2.23 0.25 **
TN_WAR04 SBI-06 164.1 2.26 0.25 **
TN_WAR04 SBI-09 16.1 3.63 0.34 ***
TN_WAR04 SBI-09 60.2 4.65 0.38 ***
TN_WAR04 SBI-09 107.9 2.71 0.28 **
TN_WAR05 SBI-01 139.7 2.09 0.17 **
TN_WAR05 SBI-02 142.2 2.39 0.19 **
TN_WAR05 SBI-03 133.7 2.19 0.18 **
TN_WAR05 SBI-04 108.6 3.69 0.24 ***
TN_WAR05 SBI-06 109.6 2.62 0.19 **
in population S4. In population S5, the QTL explained 6.1– 15.1 % of the phenotypic variation in PTT individually. The PTT QTL in S4 and S5 had both positive and negative effects, indicating that the parents of both populations had alleles contributing to both increasing and decreasing PPT. No QTL for PTT were identified in population S2.
QTL projection on consensus map
All the QTL identified in each of the four populations were projected on the consensus map (Fig. 2) and compared to 30 tillering QTL identified previously (Table 2). Across the four populations in this study, 34 QTL for fertile tiller number, representing 21 unique genomic locations, were identified and projected onto the consensus map. Of these 34 QTL, 19 co-located with the previously identified tiller-ing QTL and 15 QTL were novel and represented eleven unique genomic regions. For the component traits (LLIR, LWIR, Phyl, PTT), 26 QTL that represented 15 unique genomic regions were projected onto the consensus map. Of these 26 QTL, 17 co-located with QTL for tillering identified in the current study and/or previous studies. Of the nine component trait QTL that did not co-locate with any tillering QTL, seven were QTL for leaf size increase rate (LLIR or LWIR) and two for phyllochron. All six PTT QTL co-located with tillering QTL identified in the current study and in previous studies (Shiringani et al. 2010; Upad-hyaya et al. 2012).
We further evaluated the correspondence of the QTL for tillering with 63 candidate genes for tillering identi-fied previously (ESM Table 2). In total, over two-thirds of the QTL for tillering co-located within 10 cM of a candi-date gene for tillering. Furthermore, a candicandi-date gene for tillering co-located within the confidence interval (CI) of 42 % of all the QTL for tiller number or component traits identified from both the current and previous studies (ESM Figure S5). Candidate genes underlying co-locating QTL across multiple populations were further analysed, using a sorghum resequencing data set (Mace et al. 2013), to identify common non-synonymous SNPs across popula-tions. In silico analysis for missense mutations revealed polymorphisms leading to amino-acid changes that depart from the peptide arising from the predicted gene mod-els (www.phytozome.com) in a number of coincident gene/QTL comparisons across populations. For example, the predicted gene model Sb04g007880, a sorghum homo-logue of MAX1 (more axillary growth1), which controls tiller bud outgrowth through the production of strigolac-tones, is located within the CI of a QTL for PTT identi-fied in S4 and S5. Three common non-synonymous SNPs (A8V, A14V, G140S) were identified in both R931945-2-2 and B923296, the lower tillering parent of S4 and S5 respectively (ESM Figure S6A). In addition, a common
synonymous SNP was identified in both R931945-2-2 and B923296 at residue 7 (TTA > TTG). The common hap-lotype of both parents was associated with a reduction in PTT. We additionally looked at Sb04g007880 sequence variations across a broader set of genotypes and identified distinct haplotypes, characterised by 11 SNPs differenti-ating each haplotype, associated with high and low PTT (ESM Figure S6B & Table S3) using tillering data from Alam et al. (2014). However, further functional evidence would be required to verify this association.
Discussion
This study reports on the use of four different bi-parental populations to identify QTL for tillering and assign physi-ological function to these QTL based on their co-location with QTL associated with traits linked either to leaf area development (and thus competition for assimilates dur-ing tiller development), or to inherent propensity to tiller, which is independent of competition for assimilates. Previ-ous studies identified 30 QTL associated with tiller number in sorghum and circa 75 % of these were identified in the present study. In addition, eleven novel genomic regions associated with tiller number and seven novel genomic regions associated with component traits were identified. Co-location of QTL for tillering and component traits ena-bled the development of a framework for the genetic con-trol of tillering through QTL effects on the underpinning component traits. This study is the first to propose such a QTL model for the genetic control of tillering in sorghum.
Eleven novel tillering QTL regions were identified
populations (Fig. 2), illustrates the importance of including multiple populations in QTL studies on complex traits in order to increase the number of QTL that can be detected.
Of the 34 QTL for tiller number identified across the four populations in the current study, 15 were novel, repre-senting eleven unique genomic regions across seven chro-mosomes (01, 02, 03, 05, 07, SBI-08 and SBI-09). Linkage group SBI-SBI-08 was most enriched for novel QTL, containing over 40 % (5 from 12) of the total. Among populations, S4 was most enriched for novel QTL, as over 80 % of the QTL for tillering identified did not co-locate with any previously identified QTL. In com-parison, the S2 and S5 populations contributed fewer novel QTL (16 and 28 % of the total, respectively), with the S7 population being intermediate (45 % of QTL identified were novel). The observation that each population con-tributed novel QTL for tiller number further supports the importance of using multiple populations for QTL studies that involve complex traits.
Different physiological mechanisms underpinned the genotypic differences in tillering across populations
A comparison of the location of QTL for tiller number and component traits provided insight into the contrasting phys-iological mechanisms that underpinned genotypic differ-ences in tillering in three of the populations. Among the 34 QTL for tiller number identified across the populations, 17 co-located with QTL for component traits (Fig. 2). Differ-ences in tillering in the S2 population were predominantly associated with the carbon S/D balance, rather than PTT, as the tillering QTL on SBI-01 and SBI-02 both co-located with LLIR on the consensus map, and the QTL on SBI-10 co-located with a QTL for LWIR identified in S4 (Fig. 2). In contrast, no QTL for PTT were observed in S2 (Table 4). These results were consistent with the phenotypic observa-tions (Table 3) that the parental lines differed substantially in leaf size (LLIR and LWIR) but not in PTT. In S4, in con-trast, differences in tillering were associated with both the carbon S/D balance and PTT, as tillering QTL on both SBI-07 and SBI-08 co-located with PTT, whereas the QTL on SBI-07 co-located with LWIR (Table 5; Fig. 2). Similarly, in S5, tillering QTL on both SBI-04 and SBI-10 co-located with QTL for PTT on the consensus map. In addition, the tillering QTL on SBI-08 was only in close proximity to a
QTL for LWIR, whereas the QTL on SBI-10 co-located with a LWIR QTL observed in S4 (Fig. 2). Hence, tillering in S4 and S5 appeared to be more strongly controlled by PTT than in S2. This was consistent with the phenotypic results that showed that parental differences in PTT were greater in S4 and S5 than in S2. Moreover, parental differ-ences in LLIR and LWIR were small in S5 and had opposite effects in S4, resulting in minor net effects in their product and hence the demand term of the S/D index (Eq. 1). These differences in co-location among populations indicate that different physiological mechanisms may have under-pinned the genotypic differences in tillering across popula-tions. This would explain the limited overlap of the unique genomic regions contributed by each population.
Mechanisms underpinning genotypic effects on tillering can be explained from co-location study of component traits
The co-location of tillering QTL with QTL of component traits (LLIR, LWIR, PHYL, and PTT) provides an oppor-tunity to identify genetic controls of tillering. The two component traits that determine leaf size, leaf length and width, were both closely linked to tillering. Four of seven QTL for LLIR and five of seven QTL for LWIR co-located with a tillering QTL identified in the current study (Fig. 2). Leaf width can depend on the number of cell rows in a leaf and hence on meristem size (Fiorani et al. 2000) and can be negatively associated with tillering, as larger leaf size increases main shoot vigour and reduces assimilate avail-ability for tillering (Bos and Neuteboom 1998; Kim et al.
2010a, b). The co-location of QTL for leaf size and tiller number is thus consistent with the crop physiological effect of leaf size on tillering.
Reduced phyllochron, or increased leaf appearance rate, can accelerate the rate of leaf area expansion on the main shoot. This reduces the carbon S/D index of the plant and consequently tillering (Kim et al. 2010a; van Oosterom et al. 2011). Only one of the six QTL for phyllochron iden-tified in this study co-located with tillering QTL in any of the four populations. This lack of congruence may have been a consequence of the generally small difference in phyllochron within each pair of parents (Table 1). Four of the six phyllochron QTL, however, co-located with tillering QTL identified in previous studies. Two phyllochron QTL on SBI-01 (both from the S2 population) co-located with tiller number QTL identified in Hart et al. (2001) and Takai et al. (2012), whereas two phyllochron QTL on SBI-05 (one from S4 and one from S5) co-located with tiller num-ber QTL identified in Feltus et al. (2006), Paterson et al. (1995), and Shiringani et al. (2010). In addition, the phyl-lochron QTL on SBI-02 that was identified in S2 co-located
Fig. 2 Projected QTL from the current study onto the sorghum
con-sensus map and comparison with tillering QTL identified in previous studies. QTL colour-coded as follows: QTL for tiller number from current study blue; QTL for component traits impacting S/D index (LLIR, LWIR, Phyl) green; QTL for PTT red; QTL for tillering pre-viously identified in the literature black (QTL IDs from Mace and Jordan 2011)
with a QTL for LLIR. These co-locations highlight the role of phyllochron in the determination of tillering.
The PTT is generally highly correlated with tillering (Alam et al. 2014). Consistent with this, all six QTL for PTT co-located with QTL for tiller number. It is thought that PTT, which represents the genotypic effects on till-ering that cannot be explained by the carbon S/D index, represents the hormonal control of tillering. This hypoth-esis was supported by the identification of common non-synonymous SNPs in MAX1 (Sb04g007880), which co-locate with PTT and tiller number QTL in S5 and with PTT QTL in S4, and which are involved with hormonal control of tiller bud outgrowth through the biosynthesis of strigolactones (Wang and Li 2011; Gomez-Roldan et al. 2008; Beveridge and Kyozuka 2010). The impor-tance of PTT suggests that the carbon S/D balance pro-vides only a partial explanation for genotypic differences in tillering.
A proposed framework for the genetic control of tillering
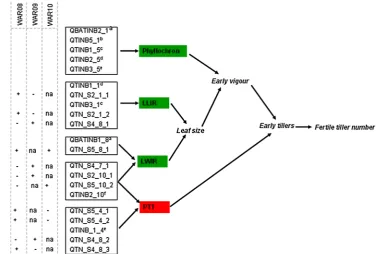
The co-location of 17 of the 34 QTL for tillering with QTL for component traits (Fig. 2) allowed the develop-ment of a framework for the control of tillering through QTL effects on the underpinning component traits (Fig. 3), based on a framework for crop physiological control of tillering (van Oosterom et al. 2011; Alam et al.
2014) and a QTL model for tillering (Kim 2008). Both increased leaf size and reduced phyllochron (increased leaf appearance rate) can increase the rate of leaf area expansion and hence early vigour of the main shoot. This
increased carbon demand by the main shoot reduces the carbon S/D balance and thus fertile tiller number (Kim et al. 2010a; van Oosterom et al. 2011). Because geno-typic differences in tiller number are generally associ-ated with differences in the frequency of appearance of early tillers (Kim et al. 2010a), PTT potentially operates through early tillers as well (Fig. 3). The physiologi-cal dissection of tillering into the underlying component traits (Fig. 3) provides insight into the function of indi-vidual tillering QTL through their co-location with QTL for component traits.
Knowledge of the function of individual tillering QTL can provide important insights into the potential role of individual QTL in the phenotypic expression of tiller-ing across environments. The carbon S/D index of a crop depends on both the genotype and environment, whereas PTT is independent of environmental conditions (Fig. 1). As a consequence, tillering QTL associated with leaf area expansion are likely to have the greatest impact in environ-ment × management situations that are conducive to tiller-ing. These include conditions that increase the S/D index, such as those with high radiation and low temperature, and those with low plant density and hence high radiation inter-ception per plant (Eq. 1). This is because in environments with low S/D index, even crops with low early vigour of the main shoot could have an S/D index that is too low to support any tillering (Fig. 1). Insights about the function of tillering QTL based on the QTL framework of Fig. 3 thus provide a tool to facilitate molecular breeding for tillering by matching the underpinning function of tillering QTL to the target environments.
Fig. 3 Possible QTL
frame-work model explaining tiller dynamics in sorghum. QTL designated by QTN are identi-fied in the present study. Other QTL were identified in previous studies (a Hart et al. 2001; b Takai et al. 2012; c Feltus et al. 2006; d Paterson et al.
Conclusions
This study has made a significant contribution to the under-standing of the genetic and physiological control of tiller-ing by identifytiller-ing QTL for tiller number and assign func-tion to many of these QTL through co-localisafunc-tion with QTL for component traits that underpin expression of till-ering. As these component traits determine tillering through two independent physiological processes that are associated either with plant size or hormonal activity, it is likely that the growing conditions where impact on tillering will be greatest will differ for the two processes. Therefore, knowl-edge about the underpinning function of individual tiller-ing QTL may improve the selection efficiency of molecular breeding programs by selecting for tillering QTL that best match the target environments.
Author contributions MMA collected the phenotypic
data and undertook the analysis; MMA and ESM wrote the manuscript; ESM contributed to the QTL analysis; AC con-tributed to experimental design and phenotypic data col-lection; CHH contributed to the statistical analysis of the phenotypic data; EvO, GLH and DRJ contributed to experi-mental design, data interpretation and analysis.
Acknowledgments The authors would like to acknowledge the
Queensland Government and the Grains Research and Development Corporation (GRDC) for providing funding for this research.
Conflict of interest The authors declare that they have no conflict
of interest.
References
Alam MM, Hammer GL, van Oosterom EJ, Cruickshank AW, Hunt CH, Jordan DR (2014) A physiological framework to explain genetic and environmental regulation of tillering in sorghum. New Phytol 203:155–167
Barton NH, Keightley PD (2002) Understanding quantitative genetic variation. Nat Rev Genet 3:11–21
Beveridge CA, Kyozuka J (2010) New genes in the strigolactone-related shoot branching pathway. Curr Opin Plant Biol 13:34–39 Bos HJ, Neuteboom JH (1998) Morphological analysis of leaf
and tiller number dynamics of wheat (Triticum aestivum L.): responses to temperature and light intensity. Ann Bot 81:131–139 Butler DG, Cullis BR, Gilmour AR, Gogel BJ (2007) ASReml-R
reference manual. Release 2.0. Technical Report, Queensland Department of Primary Industries
Development Core Team R (2012) R: a language and environment for statistical computing. R Foundation for Statistical Computing, Vienna. ISBN 3-900051-07-0
Doust AN (2007) Grass architecture: genetic and environmental con-trol of branching. Curr Opin Plant Biol 10:21–25
Feltus FA, Hart GE, Schertz KF, Casa AM, Kresovich S, Abraham S, Klein PE, Brown PJ, Paterson AH (2006) Alignment of genetic maps and QTLs between inter- and intra-specific sorghum popu-lations. Theor Appl Genet 112:1295–1305
Fiorani F, Beemster GTS, Bultynck L, Lambers H (2000) Can mer-istematic activity determine variation in leaf size and elongation rate among four Poa species? A kinematic study. Plant Physiol 124:845–855
Gilmour AR, Cullis BR, Verbyla AP (1997) Accounting for natural and extraneous variation in the analysis of field experiments. J Agric Biol Environ Stat 2:269–273
Gomez-Roldan V, Fermas S, Brewer PB, Puech-Pages V, Dun EA, Pillot JP, Letisse F, Matusova R, Danoun S, Portais JC, Bouw-meester H, Becard G, Beveridge CA, Rameau C, Rochange SF (2008) Strigolactone inhibition of shoot branching. Nature 455:189–194
Hammer GL (2006) Pathways to prosperity—breaking the yield bar-rier in sorghum. Agric Sci 19:16–22 J Aust Inst Agric Sci Technol Hammer GL, Hill K, Schrodter GN (1987) Leaf-area production and
senescence of diverse grain-sorghum hybrids. Field Crop Res 17:305–317
Hammer GL, Carberry PS, Muchow RC (1993) Modeling genotypic and environmental-control of leaf-area dynamics in grain-sor-ghum. 1. Whole plant-level. Field Crop Res 33:293–310
Hammer G, Cooper M, Tardieu F, Welch S, Walsh B, van Eeuwijk F, Chapman S, Podlich D (2006) Models for navigating biological complexity in breeding improved crop plants. Trends Plant Sci 11:587–593
Hart GE, Schertz KF, Peng Y, Syed NH (2001) Genetic mapping of Sorghum bicolor (L.) Moench QTLs that control variation in tillering and other morphological characters. Theor Appl Genet 103:1232–1242
Hastie T, Tibshirani R, Narasimhan B, Chu G (2012) impute: Imputa-tion for Microarray Data, R package version 1.32.0
Kim HK (2008) Modelling genetic and environmental control of till-ering in sorghum, PhD thesis, University of Queensland, Aus-tralia, p 188
Kim HK, Luquet D, van Oosterom E, Dingkuhn M, Hammer G (2010a) Regulation of tillering in sorghum: genotypic effects. Ann Bot 106:69–78
Kim HK, van Oosterom E, Dingkuhn M, Luquet D, Hammer G (2010b) Regulation of tillering in sorghum: environmental effects. Ann Bot 106:57–67
Kouressy M, Dingkuhn M, Vaksmann M, Heinemann AB (2008) Adaptation to diverse semi-arid environments of sorghum geno-types having different plant type and sensitivity to photoperiod. Agric For Meteorol 148:357–371
Lafarge TA, Hammer GL (2002) Tillering in grain sorghum over a wide range of population densities: modelling dynamics of tiller fertility. Ann Bot 90:99–110
Lafarge M, Loiseau P (2002) Tiller density and stand structure of tall fescue swards differing in age and nitrogen level. Eur J Agron 17:209–219
Lander E, Botstein D (1989) Mapping Mendelian factors underly-ing quantitative traits by usunderly-ing RFLP linkage maps. Genetics 136:185–199
Lynch M, Walsh B (1998) Genetics and analysis of quantitative traits. Sinauer Associates Inc Sunderland, Sunderland
Mace ES, Jordan DR (2011) Integrating sorghum whole genome sequence information with a compendium of sorghum QTL stud-ies reveals uneven distribution of QTL and of gene-rich regions with significant implications for crop improvement. Theor Appl Genet 123:169–191
Mace ES, Rami JF, Bouchet S, Klein PE, Klein RR, Kilian A, Wenzl P, Xia L, Halloran K, Jordan DR (2009) A consensus genetic map of sorghum that integrates multiple component maps and high-throughput Diversity Array Technology (DArT) markers. BMC Plant Biol 9:13
H, Hunt CH, Wang X, Shatte T, Wang M, Su Z, Li J, Lin X, God-win ID, Jordan DR, Wang Jl (2013) Whole genome sequencing reveals untapped genetic potential in Africa’s indigenous cereal crop sorghum. Nat Commun 4:2320
Manly KF, Cudmore JRH, Meer JM (2001) Map Manager QTX, cross-platform software for genetic mapping. Mamm Genome 12:930–932
McSteen P (2009) Hormonal regulation of branching in grasses. Plant Physiol 149:46–55
McSteen P, Leyser O (2005) Shoot branching. Annu Rev Plant Biol 56:353–374
Miller BC, Hill JE, Roberts SR (1991) Plant-population effects on growth and yield in water-seeded rice. Agron J 83:291–297 Murray SC, Sharma A, Rooney WL, Klein PE, Mullet JE, Mitchell
SE, Kresovich S (2008) Genetic improvement of sorghum as a biofuel feedstock: I. QTL for stem sugar and grain nonstructural carbohydrates. Crop Sci 48:2165–2179
Paterson AH, Schertz KF, Lin YR, Liu SC, Chang YL (1995) The weediness of wild plants - molecular analysis of genes influenc-ing dispersal and persistence of johnsongrass, Sorghum halepense (L.) Pers. Proc Nati Acad Sci USA 92:6127–6131
Paterson AH et al (2009) The Sorghum bicolor genome and the diver-sification of grasses. Nature 457:551–556
Shiringani AL, Frisch M, Friedt W (2010) Genetic mapping of QTLs for sugar-related traits in a RIL population of Sorghum bicolor L. Moench. Theor Appl Genet 121:323–336
Shyamsunder J, Parameshwarappa R, Nagaraja HK, Kajjari NB (1975) A new genotype in sorghum resistant to midge (Contar-inia sorghicola). Sorghum Newsletter 18:33
Smith A, Cullis B, Nelson M (2011) Detecting QTL for photoperiod sensitivity in a Brassica napus doubled haploid population using a linear mixed model with correlated marker effects, Centre for
Statistical and Survey Methodology, University of Wollongong, Working paper 03–11
Symonds VV, Godoy AV, Alconada T, Botto JF, Juenger TE, Casal JJ, Lloyd AM (2005) Mapping quantitative trait loci in multiple pop-ulations of Arabidopsis thaliana identifies natural allelic variation for trichome density. Genetics 169:1649–1658
Takai T, Yonemaru J, Kaidai H, Kasuga S (2012) Quantitative trait locus analysis for days-to-heading and morphological traits in an RIL population derived from an extremely late flowering F1 hybrid of sorghum. Euphytica 187:411–420
Turner NC (2004) Agronomic options for improving rainfall-use efficiency of crops in dryland farming systems. J Exp Bot 55:2413–2425
Upadhyaya HD, Wang YH, Sharma S, Singh S, Hasenstein KH (2012) SSR markers linked to kernel weight and tiller number in sor-ghum identified by association mapping. Euphytica 187:401–410 van Oosterom EJ, Borrell AK, Deifel KS, Hammer GL (2011) Does
increased leaf appearance rate enhance adaptation to postanthesis drought stress in sorghum? Crop Sci 51:2728–2740
Verbyla AP, Cullis BR, Thompson R (2007) The analysis of QTLs by simultaneous use of the full linkage map. Theor Appl Genet 116:95–111
Voorrips RE (2002) MapChart: Software for the graphical presenta-tion of linkage maps and QTLs. J Hered 93:77–78
Wang Y, Li J (2011) Branching in rice. Curr Opin Plant Biol 14:94–99 Wang S, Basten CJ, Zeng ZB (2011) Windows QTL Cartographer
2.5, Department of Statistics, North Carolina State University, Raleigh

![Table 5 Summary of QTL analyses for fertile tiller number (TN), four component traits (LLIR: leaf length increase rate from leaf 5 to 9; LWIR: leaf width increase rate from leaf 5 to 9; Phyl: phyllochron; PTT: propensity to tiller) identified in the S4 population, detailing the QTL location [LG, position (cM), and CI], peak LOD score, additive effect, phenotypic variance explained (R2) and significance level](https://thumb-us.123doks.com/thumbv2/123dok_us/1042034.1604467/7.595.53.545.341.542/component-phyllochron-propensity-identified-population-phenotypic-explained-significance.webp)
![Table 7 Summary of QTL analyses for fertile tiller number (TN) identified in the S7 population, detailing the QTL location [LG, and Peak (cM)], peak –log10P score, allele effect and significance level](https://thumb-us.123doks.com/thumbv2/123dok_us/1042034.1604467/8.595.50.290.91.314/summary-analyses-fertile-identified-population-detailing-location-significance.webp)