APPLICATION OF MULTILINEAR REGRESSION ANALYSIS IN MODELING OF
SOIL PROPERTIES FOR GEOTECHNICAL CIVIL ENGINEERING WORKS
IN CALABAR SOUTH
J. G. Egbe
1, D. E. Ewa
2, S. E. Ubi
3, G. B. Ikwa
4and O. O. Tumenayo
51,2,3,4,
D
EPT.
OFC
IVILE
NGINEERING,
C
ROSSR
IVERU
NIV.
OFT
ECHNOLOGY,
C
ALABAR,
C
ROSSR
IVERS
TATE.
NIGERIA
5,D
EPT.
OFC
OMPUTERS
CIENCE,
C
ROSSR
IVERU
NIV.
OFT
ECHNOLOGY,
C
ALABAR,
C
ROSSR
IVERS
TATE.
NIGERIA
E-mail addresses:
1[email protected],
2[email protected],
3[email protected],
4
[email protected],
5[email protected]
ABSTRACT
The application of Multi-Linear Regression Analysis (MLRA) model for predicting soil properties in Calabar South offers a technical guide and solution in foundation designs problems in the area. Forty-five soil samples were collected from fifteen different boreholes at a different depth and 270 tests were carried out for CBR, MC, SG, LL, PL test and GS with mechanical sieve analysis of sizes, 2.36 mm, 1.18 mm, 600 μ, 425 μ, 300μ, 212μ, 150μ, and 75μ. This study uses Multi Linear Regression Analysis to formulate a model that relates CBR to other soil parameters. The Multi Linear Regression Analysis was done using the Data Analysis tool of Microsoft Excel, which gave a good coefficient of correlation R2, 0.9454 implying that the model can be used to predict CBR at 50.9 % and with ±3.4% error. This
conclusion is drawn since the value of R2 increases with increase in numbers of variables.
Keywords: Calabar, CBR, Model, Regression, Soil properties, Soil Samples
1. INTRODUCTION
The pattern and manner at which structural buildings are collapsing in Nigeria, pose a serious threat to structural engineers, building industry, government, estate developers, building consultants and other relevant stakeholders in the building industry, as well as landlords and tenants. There have been frequent media reports of the collapse of buildings in major cities in Nigeria as a result of poor geotechnical soil investigation and analysis. In many cities in Nigeria have high rising structures which generally, require a factor of safety with respect to different building materials, due to the unpredictability in the analysis of soil and its cost implication.
Many technique for carrying out regression analysis have been developed. Several scholars have reviewed many kinds of literature on the methods of linear regression, ordinary least square regression as parametric, in order hand nonparametric regression is a techniques that permits the regression function to position in a unified set of functions.
Accordingly [1, 3] in their work, they applied linear regression models with more than one independent variable as multiple linear regression and similarly, [1, - 3] in their research they pointed out that MLRA is a well-known method that depicts the relationship that
exists between a set of dependent and independent variables using statistical approaches. Soil forms the basis of support for all engineering structures such as buildings, roadways, dams, importantly many scholars have classified soil properties into three (3) – physical properties (example, colour, porosity, structure, texture); chemical properties (example PH, salinity, cation exchange capacity (CEC), organic matter, C: N ratio (carbon, nitrogen ratio) and mechanical properties such as bearing capacity, permeability, seepage, shear strength, lateral earth pressure etc. Indebt efforts and techniques have been employed in the studies of soil properties, one of such is the use of models [5, 6, 7].
2. LITERATURE REVIEW
Also, according to [1, 2, 7], multiple linear regression is one of the modeling technique to investigate the relationship between a dependent variable and several independent variables. It is a generalisation of the simple linear regression model. They stated further that in multiple linear regression models, an error term is assumed to be normally distributed with mean and variance (which is a constant). In the same way, [9 – 12], discussed the risk in Civil engineering, the soil mechanics, and foundation engineering, to identify the
Vol. 36, No. 4, October 2017, pp.
1059 – 1065
Copyright© Faculty of Engineering, University of Nigeria, Nsukka,Print ISSN: 0331-8443, Electronic ISSN: 2467-8821
www.nijotech.com
soil properties adsorption with statistical analysis and regression step-by-step using Microsoft Excel. The comparison of artificial neural network with multiple linear regression in prediction soil pore size distribution was examined by [13, 14] they also mentioned multiple-linear regression models for estimating microbial load in a drinking water source. Multiple-linear regression is a predictive analysis approach of representing data and relationship that exists between one dependent and two or more independent variables that use statistic solutions. Similarly, [8, 7, 6], discussed extensively, the generic format of regression models as an error. The model creates a relationship in the form of a straight line (linear) that best approximates all the individual data points. However, multiple linear regression analysis (MLRA) is a statistical technique that uses several explanatory variables to predict the outcome of a response variable. The goal of multiple linear regression (MLR) is to model the relationship between the explanatory and response variables.
2.1 Application of MLRA in Modelling Soil Properties Furthermore, [3, 13] ‘introduced’ Multiple Regression (MR) analysis and MATLAB programming to estimate the required subsoil properties from the measured properties. They developed a model which allows the decision maker to utilise the available data to achieve possible values of soil properties of non-visited locations. Accordingly, [13] compared MRLA and Artificial Neural Network (ANN) while developing a pedotransfer function for predicting soil parameters. In the work of [5,4,13], they illustrated that, irrespective of the fact that ANN method has some difficulties including various components test of the network structure such as the rule of learning, transfer functions used in the hidden and output layers, number of hidden layers and number of neurons in the hidden layer in trial and error method. [7], discussed the use of multiple linear regression analysis as one of the modeling techniques to depict relationships between microbial raw water quality and physicochemical properties by fitting a linear equation to the observed data set. He published that in order to use the proposed multiple regression analysis, it is necessary to test and verify that the proposed equation satisfies the assumptions.
2.2 Limitations of MLRA
Correspondingly, [12] pointed out in his work that the major conceptual constraints of all regression approaches are that only relationships can be achieved,
achieved with optimism. Comparably, [12] maintained that MRLA cannot explicitly interpret the multi-collinearity between controlled variables. However, in order to check this, they adopted bivariate correlation analysis and path analysis before setting up a stepwise multi -linear regression. They expressly stated that the problem of multi-collinearity among soil properties in the linear model has been generally recognised in many studies. In the case, of multiple linear regression, this problem can be dealt with by calculating confidence intervals for each partial regression coefficient in the model. However, a more dangerous problem that arises in multiple linear regression is the collinearity or multi-collinearity.
3. MATERIALS AND METHODS 3.1 Soil Sample Collection
The soil samples (disturbed) for this research were collected from a different location in Calabar South, of Cross River State. It has an area of 264 km² and a population of 191,630 based on 2006 Census. Calabar South is located at Latitude: 4° 51' 50.9" (4.8641°) North, Longitude: 8° 20' 10.9" (8.3364°) East and the average elevation of 1 metre. Forty -five (45) soil samples were collected from fifteen (15) different boreholes at a different depth. In each borehole, three sets of representative samples were collected at the depth of 0.5 m, 1 m and 1.5 m respectively. Representative samples were collected using a spade, hand auger, trowel and wrapped in cellophane paper to prevent loss of moisture. The details of the sampling locations are presented in Table 1.
3.2 Laboratory Analysis
Wide varieties of laboratory tests were performed on the soils to measure the variation in soil properties. Six different tests were performed on each of the 45 samples. Therefore, in total, 270 laboratory tests were carried out for CBR, Moisture content, Specific gravity, Liquid limit, Plastic limit test and Grain size with mechanical sieve analysis of sizes, 2.36mm, 1.18mm, 600µ, 425µ, 300µ, 212µ, 150µ, 75µ respectively.
3.3 Regression Analysis Using Microsoft Excel
Data were arranged in columns in the inbuilt Microsoft excel environment using Excel Data Analysis program the regression data and output were specified.
3.4 Formulation of Multi Linear Regression Analysis (MLRA)
The model for MLRA is:
Table 1: Details of sampling locations
Description of sampling locations Reference number /Coordinates CRUTECH Quarters BH1, BH2, BH3 4057’8’’ N; 8020’0’’ E Mount Zion Region BH4, BH5, BH6 4055’ 2’’N; 8021’2’’E Goldie/ Bateba Region BH7, BH8, BH9 4054’4’’N; 8022’8’’E Mbukpa Axis BH10,BH11,BH12 4058’3’’N; 8022’4’’E Hawkins/ Garden Region BH13,BH14,BH15 4056’10’’N;8024’ 8’’E
Where, Y :( CBR %), b1, b2, b3… bn:Constants, X1, X2, X3 … Xn:Represent the soil properties. To develop the model of multi-linear regression analysis, CBR value is considered as independent variable and soil properties such as natural optimum moisture content (OMC), liquid limit (LL), plastic limit, (PL), maximum dry density (MDD), coarse sand (CS), medium sand (MS), and fine sand (FS) are considered as the dependent variables. For this work, MLRA is carried out using the data analysis toolbar of Microsoft Excel in other to derive the relationship statistically, see Table 2 and 3 and the regression model of the soil properties in Table 4.
Table 2: Descriptive Statistics for the Soil Properties
Variables N Mean Median Mean Tr StDev Mean SE CBR (%) 15 6.967 7.800 7.192 2.510 0.648 OMC (%) 15 14.86 14.06 14.63 4.73 1.22 LL (%) 15 44.30 45.50 44.65 7.76 2.00 PL (%) 15 39.25 39.13 39.19 4.49 1.16 MDD (%) 15 4.795 4.330 4.315 2.927 0.756 CS (%) 15 13.03 6.10 11.091 14.37 3.71 MS (%) 15 18.95 11.50 17.68 15.61 4.03 FS (%) 15 12.69 6.30 10.37 15.88 4.10
Table 3: Minimum, Maximum and coefficient of the soil properties
Variables Min Max Q1 Q2
CBR 1.1OO 9.900 6.900 8.400
OMC 7.48 25.14 11.79 17.86
LL 28.00 56.00 40.00 50.00
PL 31.27 48.00 36.80 41.17
MDD 1.500 14.330 3.500 4.830
CS 0.50 50.70 2.00 21.00
MS 1.90 52.50 6.50 30.00
FS 0.48 55.10 1.50 28.00
Table 4: Predictor coefficient
Predictor Coefficient StDev T P Constant 20.774 7.913 2.63 0.034
OMC -0.1018 0.1920 -0.53 0.612
LL -0.1616 0.2028 -0.80 0.452
PL -0.1204 0.2381 -0.51 0.628
MDD 0.1446 0.3262 0.44 o.671
CS -0.0350 0.06562 -0.05 0.959
MS 0.02464 0.05468 0.45 0.666
FS -0.12004 0.08733 -1.37 0.212
Table 5: Regression equations of CBR for different soil parameters
Description Regression Model
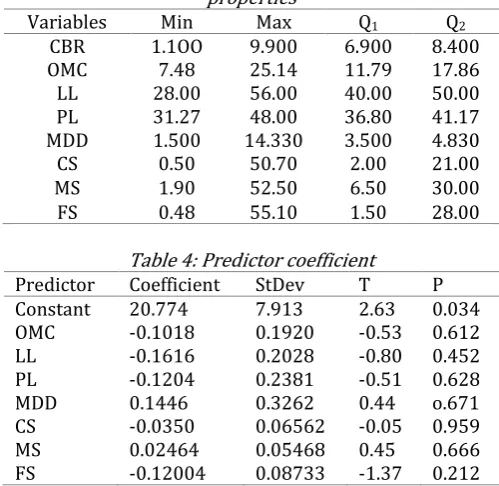
CBR VS MC 6.69 +0.018 MC
CBR VS LL 8.33 -0.0307LL
CBR VS PL 17.6 -0.272PL
CBR VS MDD 6.08 +0.198 MDD
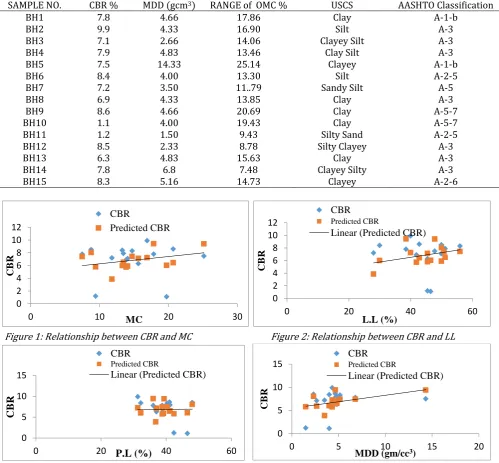
CBR VS CS 6.08 +0.0682 CS
CBR VS MS 6.53 +0.0232 MS
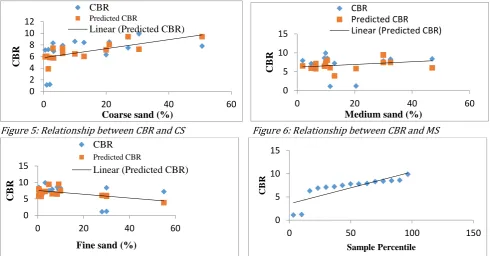
CBR VS FS 7.79 -0.0647 FS
CBR = 20.8 - 0.102MC- 0.162 LL-0.120 PL + 0.145 MDD -0.0035CS + 0.0246MS – 0.120FS (2) Therefore, equation (2) represent the multi-linear equation that relates CBR to other soil properties in Calabar South the value of CBR as coefficient was derived from Table 3.
4. RESULTS AND DISCUSSION
The raw results obtained from the laboratory experiments are shown in Table 6 and Figures 1 to 8. The analyses of soil, compaction characteristics and CBR (%) of different soil samples, the results showed that MDD has values of 4.66, 4.33, 2.66, 4.83, 14.33, 4.0, 3.5, 4.33,4.66, 4.0, 1.5, 2.33, 6.8 and 5.16 for A-1-b, A-3, A-5, A-5-7 and A-2-6 based on AASHTO classification system, see Table 6.
Similarly, the optimum moisture content (OMC) the values were, 17.86,16.9, 14.06, 13.46, 25.14, 13.3,11.79, 13.85,20.69,19.73,9.43, 8.78,15.63,7.48 and 14.73 for A-1-b, A-3, A-5, A-5-7 and A-2-6 respectively. The AASHTO system classifies soils into seven primary groups, namely A-1 through A-7, based on their relative expected quality for road embankments, subgrades, sub-bases, and bases. Some of the groups are further divided into subgroups, such as A-1-a and A-1-b as shown in Table 6. Basically, there are two soil classification systems often use for engineering purposes.
clay silt soil for A-3, BH5 and BH15 are clayey soil for A-2-6, A-1-b, BH7 is sandy silt for A-5 and BH11 is silty sand for A-2-5 respectively.
Clays are compressible, for instance, if a moist mass of clay is subjected to compression, moisture and air may be expelled, resulting in a reduction in volume which is not immediately recovered when the compression load is withdrawn. The reduction in volume per unit increase of pressure is defined as the compressibility of soil, and a measure of the rate at which consolidation proceeds is given by the ‘co-efficient of consolidation’ of the soil.
Silts are the nonplastic fines, they are inherently unstable in the presence of water and have a tendency to become "quick" when saturated that is, they assume
the character of a viscous fluid and can flow. Silts are fairly impervious, difficult to compact, and highly susceptible to frost heaving.
4.2 Correlation between CBR (%) and different soil types
There was a strong significant positive correlation between CBR and OMC and this indicates that as OMC increases CBR value decreases (R2 = 0.1).The correlation between CBR and different soil types are presented in Table 6. The correlation between LL, PL, and CBR depict that as the values of LL, PL increases the value of CBR decreases indicating that there was a weak positive non-significant correlation.
Table 6: Soil classification of the location
SAMPLE NO. CBR % MDD (gcm3) RANGE of OMC % USCS AASHTO Classification
BH1 7.8 4.66 17.86 Clay A-1-b
BH2 9.9 4.33 16.90 Silt A-3
BH3 7.1 2.66 14.06 Clayey Silt A-3
BH4 7.9 4.83 13.46 Clay Silt A-3
BH5 7.5 14.33 25.14 Clayey A-1-b
BH6 8.4 4.00 13.30 Silt A-2-5
BH7 7.2 3.50 11..79 Sandy Silt A-5
BH8 6.9 4.33 13.85 Clay A-3
BH9 8.6 4.66 20.69 Clay A-5-7
BH10 1.1 4.00 19.43 Clay A-5-7
BH11 1.2 1.50 9.43 Silty Sand A-2-5
BH12 8.5 2.33 8.78 Silty Clayey A-3
BH13 6.3 4.83 15.63 Clay A-3
BH14 7.8 6.8 7.48 Clayey Silty A-3
BH15 8.3 5.16 14.73 Clayey A-2-6
Figure 1: Relationship between CBR and MC Figure 2: Relationship between CBR and LL
Figure 3: Relationship between CBR and PL Figure 4: Relationship between CBR and MDD
0 2 4 6 8 10 12
0 10 20 30
CB
R
MC
CBR
Predicted CBR
0 2 4 6 8 10 12
0 20 40 60
CB
R
L.L (%)
CBR
Predicted CBR
Linear (Predicted CBR)
0 5 10 15
0 20 40 60
C
B
R
P.L (%) CBR
Predicted CBR
Linear (Predicted CBR)
0 5 10 15
0 5 10 15 20
CB
R
MDD (gm/cc3) CBR
Predicted CBR
Figure 5: Relationship between CBR and CS Figure 6: Relationship between CBR and MS
Figure 7: Relationship between CBR and FS Figure 8: Relationship between CBR and 7 other
parameters soil properties
These results confirmed partly with [15], and [16], who reported that plastic limit had a strong correlation with CBR. Closely, liquid limit (LL) and plastic limit (PL) are two important states of consistency. Liquid limit is the percentage moisture content at which a soil changes with decreasing wetness from the liquid to the plastic stability or with increasing wetness from the plastic to the liquid consistency, whereas the plastic limit is the percentage moisture content at which a soil changes with decreasing wetness from the plastic to the semi-solid consistency or from the semi-semi-solid to the plastic consistency. The compaction characteristics and correlation between CBR and MDD in Tables 6 and 8, show that as the values of CBR increases the MDD values decreases showing positive correlation value (R2= 5.3%). Similarly, the correlations between CBR, MS and CS indicates that as the values of CBR decreases there is a corresponding increase in MS and CS values showing a positive correlation value respectively. See Table 8.
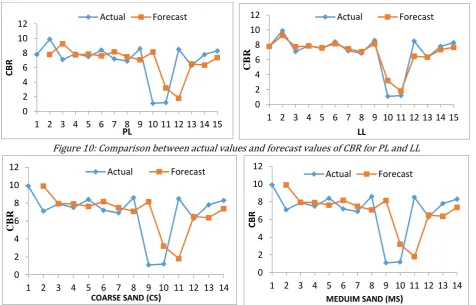
This implies that the model in the equation 1, can predict CBR from the considered parameters at 50.9% with plus or minus 3.4% error. The adjusted R-square, a measure of explanatory power, is 0.6891. The multiple correlation coefficients (multiple R) is 0.9454. These indicate that the correlation among the independent and dependent variables are positive. Figures 9-12 clearly, show the comparison between actual values, forecast values and exponential smoothing of CBR against others parameters respectively.
5. CONCLUSION
From the above findings, it can be concluded that the application of Multi-Linear Regression Analysis (MLRA) model for predicting soil properties in Calabar South offers a technical guide and solution in foundation designs problems in the area.
Table 7: Correlation between CBR (%) and different soil properties
CBR
MC
LL
PL
MDD
CS
MS
MC
0.035
LL
-0.095
- 0.034
PL
-0.486
- 0.105
0.577
MDD
0.231
0.605
0.175
- 0.130
CS
0.391
0.369
-0.189
- 0.352
0.298
MS
0.144
0.006
-0.034
- 0.258
0.290
0.136
FS
-0.409
- 0.120
-0.651
- 0.068
- 0.262
- 0.316
0.167
0 2 4 6 8 10 12
0 20 40 60
CB
R
Coarse sand (%)
CBR
Predicted CBR
Linear (Predicted CBR)
0 5 10 15
0 20 40 60
CB
R
Medium sand (%)
CBR
Predicted CBR Linear (Predicted CBR)
0 5 10 15
0 20 40 60
CB
R
Fine sand (%)
CBR
Predicted CBR
Linear (Predicted CBR)
0 5 10 15
0 50 100 150
CB
R
Figure 9: Comparison between actual values and forecast values of CBR for MC and MDD
Figure 10: Comparison between actual values and forecast values of CBR for PL and LL
Figures 11: Comparison between Actual values and forecast values CBR CS and MS
Figure 12: Comparison between actual value and forecast value of CBR for FS
It is clearly, established that maximum dry density (MDD) and optimum moisture content (OMC) affects directly the CBR value for different soil types. This
shows that the CBR value prediction model based on the MLRA are close to experimental actual values for different soil types and it can predict or forecast the value of CBR in the study area as shown in Figures 9-12. Accurate analyses of soil are important in ensuring that these structures remain stable and safe. The CBR value is an essential soil property for designing of flexible pavement and runaway of airfields and can be used for determining the reaction of the soil subgrade. Considering the constraints of laboratory work in determining the California Bearing Ratio (CBR), the MLRA model is proposed for correlating CBR value with some soil parameters. The result gave a good coefficient of correlation, R2 as 0.9, implying that the derived MLRA model can be used to predict CBR at 50.9% with ±3.4% error. Further studies to extend this 0
2 4 6 8 10 12
1 2 3 4 5 6 7 8 9 10 11 12 13 14 15
CB
R
MC
Actual Forecast
0 2 4 6 8 10 12
1 2 3 4 5 6 7 8 9 10 11 12 13 14 15
CB
R
MDD
Actual Forecast
0 2 4 6 8 10 12
1 2 3 4 5 6 7 8 9 10 11 12 13 14 15
CB
R
PL
Actual Forecast
0 2 4 6 8 10 12
1 2 3 4 5 6 7 8 9 10 11 12 13 14 15
CB
R
LL
Actual Forecast
0 2 4 6 8 10 12
1 2 3 4 5 6 7 8 9 10 11 12 13 14
CB
R
COARSE SAND (CS)
Actual Forecast
0 2 4 6 8 10 12
1 2 3 4 5 6 7 8 9 10 11 12 13 14
CB
R
MEDUIM SAND (MS)
Actual Forecast
0 2 4 6 8 10 12
1 2 3 4 5 6 7 8 9 10 11 12 13 14
CB
R
FINE SAND (FS)
research will involve number of samples across the Calabar Metropolis will be developed to study the correlation of CBR with different types of soils to give adequate and accurate recommendation.
6. REFERENCES
[1] Saufie, A.Z., Yahya A.S,and Ramli N.A. ‘’Improving multiple linear regression model using principal component analysis for predicting PM10 concentration in Seberang,Prai, Pulaupinang”,
International Journal of Environmental Sciences,
Vol. 2, Number 2, 2011, pp 415-422.
[2] Alan O. Sykes. “An introduction to Regression Analysis, Coarse-Sandor Institute for Law and Economics Working Paper No. 20, Chicago 1993”.
www.chicagounbound.uchicago/law_and_economi cs, Accessed on July, 24 2017.
[3] Arulkumaran, S. and Sukumar S. “Regression Model to Predict Subsurface Properties”, International Journal of Earth Sciences Engineering, Vol. 8, Number 2, 2015, pp. 233-239.
[4] Azizsoltani,E. and Naser H. “Comparison of Artificial Neural Network with Multiple Linear Regression in Predicting Soil Pore Size Distributions”, International Journal of Agriculture and Crop Sciences, Vol. 5, Number 4, 2013, pp. 2947-2951. [5] Bashar, T. “Predicting standard penetration test
N-value from cone penetration test data using artificial neutral networks”, Geoscience Frontiers,
Vol.8, Issue 1, 2017, pp199-204.
[6] SarmadianF, and R. Taghizadeh. “Modeling of Some Soil Properties Using Artificial Neural Network and Multivariate Regression in Gorgan Province North of Iran”, Global Journal of Environmental Research
Vol.2, Issue 8, pp 30-35.
[7] Fasil, E. E. “Multiple Linear Regression Models for Estimating Microbial Load in a Drinking Water Source Case from the Glomma River, Norway”,www.core.ac.uk/download/pdf/3088960 3, Accessed on July 24, 2017.
[8] Juma R., Pőcze T., Kunics G., and Sisák I.Application of Digital Soil Mapping Techniques to Refine Soil
Map of Baringo District, Rift Valley Province, Kenya. Springer, Singapore, 2016.
[9] Pamela, P.D.”Regression Step-by-Step using Microsoft Excel, James Madison University”,
www.scribed.com/document/21954073/Regressi onexcel, Accessed on July 24, 20 2017.
[10] Pierre, D. “Risk in Civil Engineeringfrom natural to man-made hazards”, Conference on Risk issues in Contemporary Science and Engineering, France – Stanford April 4-6 2003, pp1-14.
[11] Fletcher, G. A. “Standard penetration Test’’: Its uses and Abuses, Journal of the Soil Mechanics and Foundation Division, Vol. 91, Number 4, 1965, pp 67 -75.
[12] Yiging, G., Jianhui, W,Danong, Z, Mingjuan, .Z and Liru. Z. “To Identify the Important of Soil Properties affecting Dinoseb adsorption with Statistical Analysis,” The Scientific World Journal, Vol. 3, Number 13, pp1-7.
[13] Farzaneh, M., AlirezaJ.andGholamabbas. S “Estimation of Soil Compression Coefficient Using Artificial Neural Network and Multiple Regressions’’, International Research Journal of Applied and Basic Sciences, Vol. 4, Number 10, 2013, pp 3232-3236.
[14] Colin A. C. “Excel 2007 Multi Regression, Department of Economics, University of Calif, 2009’’,www.cameron.econ.ucdavis.edu/excel/ex6
1 multiple regression.htm, Accessed on July 24
2017.
[15] Korde, M. and Yadav, R .K. “A study of correlation between CBR value and physical properties of some soils”, International Journal of Emerging Technology and Advanced Engineering Journal,
Vol. 5, issue 7, 2015, pp237-239.