www.ijper.org
A Novel QbD Based SPE-HPLC Bio-analytical Method
for Edaravone in Rat Plasma, A Pharmacokinetic
Study
Suraj Fanse1, Madhuri Baghel1, Prachi Bhamre1, Sadhana Rajput1*
1Quality Assurance Laboratory, Centre of Relevance and Excellence in Novel Drug Delivery System, Pharmacy Department, G. H. Patel Building, Donor’s Plaza, The Maharaja Sayajirao University of Baroda, Fatehgunj, Vadodara, Gujarat, INDIA.
ABSTRACT
A simple, sensitive and feasible Quality by design based RP-HPLC bioanalytical method was developed and validated for Edaravone. Plackett burman design and 3¥3 full factorial designs were utilized for factor screening and optimization respectively, to achieve well resolved asymmetric peaks of both internal standard and drug with good theoretical plates. The optimized chromatographic peak was obtained with mobile phase composition of 10 mM ammonium acetate buffer (pH 6) and acetonitrile (60:40, v/v) at a flow rate of 1.0 ml/m and detection wavelength of 243 nm using Kromasil C18 (250 mm × 4.6 mm; 5 μm) column. Non normality, skewness or outliers did not exist as demonstrated by residual plot. To eliminate the possible interferences in the biological matrices, a new solid-phase extraction method using STRATA X C18 Phenomenex cartridges was developed and evaluated. The method was validated as per USFDA guideline. The developed method was efficiently applied to pharmacokinetic study in rat plasma. Keywords: QbD, SPE, Bioanalytical method, Edaravone, Carbamazepine.
DOI: 10.5530/ijper.50.4.8
Correspondence:
Sadhana Rajput, Professor, Quality Assurance laboratory, Centre of Relevance and Excellence in Novel Drug Delivery Systems, Pharmacy Department, G.H. Patel Building, The Maharaja Sayajirao University of Baroda, Fatehgunj, Vadodara, Gujarat, INDIA.
E-mail: [email protected] Phone no:
INTRODUCTION
Edaravone (EDA) is a neurotrophic drug used in treatment of acute ischemic stroke and myocardial infarction. It acts as a free radical scavenger, lowers lipid-peroxidation induced neuronal death and subsequent oxidative stress of endothelial cells of brain, thereby reducing cerebral edema and cerebral infarction.1 Chemically, EDA is 5-methyl-2-phenyl-2, 4-dihydro-3H-pyrazol-3-one.
It is not official in any of the pharmaco -poeias. Carbamazepine (CAR), which is 5H-dibenzo [b, f] azepine-5-carboxamide, is used as internal standard in the present study.
Literature review revealed that some methods have been reported for Edaravone indivi-dually and in combination. Fluorescent assay,3 derivative UV spectrophotometric RPHPLC method for combination of Edaravone and
Citicoline,4,5 HPLC method for determination of phenyl hydrazine residues in EDA6 have been reported. HPTLC method for estimation of Edaravone in human plasma2 has been described. Liquid liquid extraction (LLE) was used to isolate edaravone from biological matrix followed by spotting of the extracts onto a Pre coated RP-18 F254 aluminum sheet. Rf value of EDA was found to be 0.81 ± 0.01. The LOD and LOQ were 25 ng/spot and 150 ng/spot respectively. Also LC-MS/MS method for estimation of Edaravone and Taurine in rat plasma7 has been stated. In this method 3-methyl-1-
p-tolyl-5-pyrazolone and sulfanilic acid were used as internal standards (IS) for simul-taneous or independent determination of taurine and edaravone in rat plasma. Chromato graphic separations were achieved
Submission Date : 07-04-2016
Revision Date : 09-06-2016
on an Agilent Zorbax SB-Aq (100 ¥ 2.1 mm, 3.5 µm) column using mobile phase Gradient 0.03% formic acid–methanol, isocratic 0.1% formic acid–methanol (90:10) and 0.02% formic acid–methanol (40:60). On
thorough literature search no report has been found relating to SPE- HPLC bioanalytical method using systematic QBD approach. Hence, the present work aims to develop a simple RP-HPLC bioanalytical method for estimation of EDA in human plasma employing a novel QBD approach that could be successfully employed for analysis of rat plasma samples following intravenous administration.
EXPERIMENTAL
Instrumentation and software
Chromatography was performed on Shimadzu (Shimadzu Corporation, Kyoto, Japan) chromatographic system equipped with Shimadzu LC-20AT pump and Shimadzu SPD-20AV absorbance detector. Samples were injected
through a Rheodyne 7725 injector valve with fixed loop at 20 μl. Data acquisition and integration was performed
using Spinchrome software (Spinco biotech, Vadodara). Ezypress HT48 (OROCHEM) solid phase extractor and STRATA X C18 cartridges (PHENOMENEX) were used for solid phase extraction. Minitab 17 software was used for Plackett Burman design (PBD), and Statease Design expert v.9.0 was employed for optimization stage in QBD. Thermo Kinetica PK/PD analysis software
(version 5.0 Thermo Fisher Scientific) was used for
pharmacokinetic modeling.
Reagents and Chemicals
Drug samples of EDA (99.7% purity) and CAR (99.9% purity) were obtained as gift samples from BDR Pharma-ceutical International Pvt. Ltd. Vadodara and Sun Pharmaceuticals, Vadodara respectively. Methanol and acetonitrile (ACN) (HPLC grade, Spectrochem), glacial acetic acid (HPLC grade, Merck), ammonium acetate (HPLC grade, Rankem) and double distilled water were used for the analysis. All the aqueous solutions for analysis
were filtered through 0.2 μm nylon membrane filter
paper (Pall Lifesciences, Mumbai, India).
Chromatographic condition
Separation and quantitation were performed on Kromasil C18 column (250 mm × 4.6 mm; 5 µm). The mobile phase comprised of ammonium acetate buffer, pH 6 adjusted with glacial acetic acid: ACN in ratio of 60:40
at a flow rate of 1.0 ml/min at ambient temperature.
Detection was carried out at wavelength of 243 nm.
Preparation of Standard Solutions
A standard solution (1 mg/ml) of EDA was prepared in ACN. This solution was used for preparing the plasma samples by withdrawing appropriate aliquots. A standard solution (1 mg/ml) of internal standard, CAR was prepared in ACN. From this, the working internal standard (IS) spiking solution (400 µg/ml), was prepared by appropriate dilution in ACN.
Preparation of calibration standards and quality control (QC) samples
Spiking solutions of EDA were prepared in ACN using appropriate volumes of above standard solution to make calibration curve standards in the range of 500 to 20,000 ng/ml. QC samples were independently prepared by spiking drug-free plasma with appropriate amounts of EDA to give concentrations corresponding to 500 ng/ml (LLOQ QC), 800 ng/ml (LQC), 7500 ng/ml (MQC) and 15,000 ng/ml (HQC) levels of the calibration curve.
Plasma Sample preparations
EDA and CAR (IS) were extracted from plasma using solid phase extraction (SPE) method. To each aliquot (1.8 ml) of plasma (calibration standards, QC samples or rat samples), 0.1 ml of spiking solutions of EDA and 0.1 ml, 400 µg/ml of IS solution was added. STRATA X C18 Phenomenex cartridges were used for SPE. Sam-ple pre-treatment was carried out by taking 0.5 ml of plasma sample and adding 0.5 ml water to it (sample dilution 1:2). The cartridges were conditioned with 0.5 ml methanol and equilibrated with 0.5 ml water. Then 0.5 ml of pre-treated sample were loaded onto the car-tridges. The cartridges were rinsed with 0.5 ml water to wash the interferents and elution of analytes was carried out with 0.5 ml mixture of ACN: ammonium acetate buffer pH 6 in the ratio of 80:20. The eluent was further dried with nitrogen purging for 1-2 m and thereafter the volume of dried residue was reconstituted with ACN and injected into HPLC (20 µl injection volume).
Bioanalytical Method validation
Method validation was carried out according to the USA Food and Drug Administration (USFDA) Bioanalytical method validation guidelines.8
Selectivity: Selectivity of the assay method was assessed
times of EDA or IS. The selectivity of the method has been shown in Figure 4 which consists of the chromatogram of blank human plasma, zero standard and extracted sample.
Limit of detection (LOD) and lower limit of
quan-tification (LLOQ): In order to estimate the LOD and
LLOQ, drug-free plasma sample was extracted and six replicates were injected and analysed according to the optimized chromatographic conditions. Similarly plasma samples spiked with drug were injected.
Linearity of calibration curves: The linearity of the
method was determined over calibration range of 500- 20,000 ng/ml. To a plasma sample aliquot (1.8 ml) of each calibration standard, 0.1 ml (400 µg/ml) IS was added. The calibration standards were prepared by spiking known concentration of EDA working standard solutions. A linearity curve containing seven non-zero concentra-tions was analysed. Concentraconcentra-tions of each level were plotted against the area ratio of drug to IS. Back calcu-lated concentration of each calibration standard, slope,
y-intercept and correlation coefficient of the curve were
calculated by suitable linear regression analysis.
Precision and accuracy: Precision and Accuracy of
the method were determined by replicate analysis of
five determinations at four concentration levels which
covers the calibration range: LLOQ, LQC, MQC, and HQC. These QC samples were analyzed against the calibration curve and obtained concentrations compared with the nominal value. Precision is expressed as the %
coefficient of variation (% CV). The accuracy and preci -sion were evaluated as within batch (intraday, replicate analysis on same day) and between-batch (interday, replicate analysis for three consecutive days).
Extraction recovery: The extraction recovery of EDA
and CAR in plasma was evaluated by comparing the
mean peak responses of five replicate injections of each
LQC, MQC and HQC sample (prepared in plasma), to the mean peak responses of aqueous unextracted samples (without plasma). Also, the recovery of the IS was simultaneously evaluated. Percentage recovery was found as:
% Recovery = [(peak area of EDA concentration extracted from spiked plasma/ peak area of EDA con-centration without plasma) × 100].
Matrix Factor: Matrix factor is investigated to check
the effect of plasma matrix from different sources or population on the response of drug and IS. Matrix factor was calculated using 3 different lots of plasma samples. For each analyte and the IS, the matrix factor (MF) should be calculated for each lot of matrix, by calculating the ratio of the peak area in the presence of matrix
(measured by analyzing blank matrix spiked after extrac-tion with analyte), to the peak area in absence of matrix (pure solution of the analyte). The IS normalized MF was also calculated by dividing the MF of the analyte by the MF of the IS. This determination was carried out at LQC and HQC.
Dilution Integrity: Dilution integrity was evaluated
at dilution range of 1:2 and 1:4 respectively. A dilution integrity standard of 40 µg/ml (a concentration twice that of ULOQ) was prepared and frozen for a period of at least 24 hours. On the day of evaluation, the dilution integrity standard could be diluted for 3 replicates each by a factor of 2 times and 4 times using the prescreened blank plasma. Dilution integrity samples were processed and analyzed against a freshly prepared calibration curve.
Stability: According to the guidelines, stability studies
of samples were performed at LQC and HQC levels. For bench top stability, three replicates of LQC and HQC samples in plasma were kept at room temperature for 24 hrs (referred to as stability samples). After 24 hrs, fresh samples were prepared in three replicates (referred to as fresh or comparison samples) with respect to which the stability QC samples were analyzed.The freeze thaw (FT) stability of analyte was determined after three FT cycles. 3 sets of LQC and HQC are stored at -5°C to -20°C + 5°C for 24 hrs. These were thawed unassisted at room temperature. Likewise, two more such FT cycles were repeated. All the stability samples were ana-lyzed and compared with freshly prepared QC samples and back-calculated against freshly prepared calibration curve.
The room temperature (short term) stock solution stability of EDA and CAR was determined at room temperature for 24 hrs. Room temperature stock solution stability was performed by analyzing three replicates of aqueous solutions prepared from freshly prepared stock solution against three replicates of aqueous solution prepared from aliquots of analyte and IS stored at room temperature for 24 hrs (stability samples). The refriger-ated (long term) stock solution stability of EDA and CAR were determined at 2-8ºC after 7 days. Refriger-ated stock solution stability was performed by analyzing three replicates of aqueous solution prepared from freshly prepared stock solution against three replicates of aqueous solution prepared from aliquots of analyte and IS stored at 2-8oC after 7 days (1 week).
Application of the proposed method: The validated
study. The animals were fasted overnight (~14 h) and had free access to water throughout the experimental period. EDA was administered by intravenous route via tail vein at a dose of 1 mg/kg, as an aqueous solution. Blood samples (0.3 ml) were collected from the retro-orbital plexus sinus at designated time points (5, 10, 15, 20, 30 and 40 m) into micro centrifuge tubes each containing 50 µl of EDTA. Plasma was harvested by centrifuging the blood using cold centrifuge at 4000 rpm for 10 m. Plasma (200 µl) samples were spiked with IS and processed same as standards as described above.
RESULTS AND DISCUSSIONS
QbD approach to bioanalytical method development and optimization9,10:
Preliminary investigations: The Ishikawa cause and
effect diagram (Figure 1) depicting various factors i. e.
CPP’s (Critical Process Parameters) and their influences
on the CQA’s (Critical Quality Attributes) were studied.
Effects like pH, temperature, flow rate, Buffer ratio and
strength of buffer, volume of sample injected, etc had been studied.
Selection of stationary phase: Various
chromato-graphic trials were performed on different columns like Kromasil C18 (250 ¥ 4.6 mm), Oyster C8 (250 ¥ 4.6 mm) and Hypersil C4 column (100 ¥ 4.6 mm). Best results were obtained using Kromasil C18 column.
PBD for screening of critical variables: 7 factors
namely pH, Flow rate, Buffer ratio, Buffer strength, Temperature, Detection wavelength and volume of
sample injected which influence the method parameters were investigated for their significance on the analytical
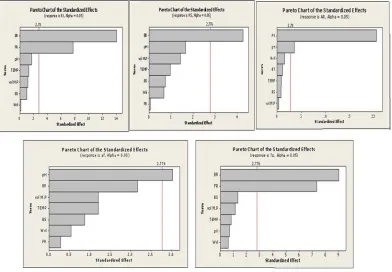
method employing a PBD. Five responses were studied, namely Retention time of EDA, Resolution, Symmetry factor, Theoretical plates and Area of EDA. Table 2 summarizes the Factorial fit for the model developed.
Pareto charts as shown in Figure 2 explain the degree of effect of each CPP’s on CQA’s in the form of bars. This
begins with the most significant response followed by
other responses in decreasing order of their contribution to the corresponding factor.
The difference between observed response and fitted
response value is said to be its residual. Standardized residuals generally have a variance of 1. Standardized residuals with absolute value >2 are considered very large and treated as unusual observations. Histogram of the residuals shows distribution of residuals for all
the observations. The graph of residual vs. fits should
be randomly scattered about zero. One of the assump-tions of regression and ANOVA is that the variance of
error term is constant. In residual vs. fitted plots; these
errors will have a constant variance when the residuals are scattered randomly about zero. Residual vs. order of data indicates whether there are systematic effects in data due to time or data collection order. Residual plots
for the five critical responses are shown in Figure 3.
Thus, from the above PBD, it was concluded that pH,
Flow rate and Buffer ratio were the 3 most significant
variables affecting all the critical responses, which were further used as critical factors for the next stage of opti-mization in QBD.
Selection of internal standard (IS): For internal
standardization the compound selected as IS is added to the sample prior to sample pretreatment and ratio of response of analyte to that of ‘IS’ is plotted against concentration of the analyte. Different compounds (Aceclofenac Rt 10.1; Amoxicillin Rt 2.01; Brimoni-dine, Rt 2.67; Flucloxacillin Rt 4.08; sulfamethoxazole Rt 2.1; Oxcarbazepine Rt -5.7; Hydrochlorthiazide Rt 2.23 and Carbamazepine Rt 8.2 ) were tried based on their pKa and log P value.Carbamazepine was selected as IS as it showed symmetric and resolved peak from analyte (Figure 4).
Full Factorial Design (FFD) for Optimization of
chromatographic Method: Based on PBD three
signi-ficantly influencing factors i.e. pH, % Buffer ratio and flow rate were used to get an optimized method which
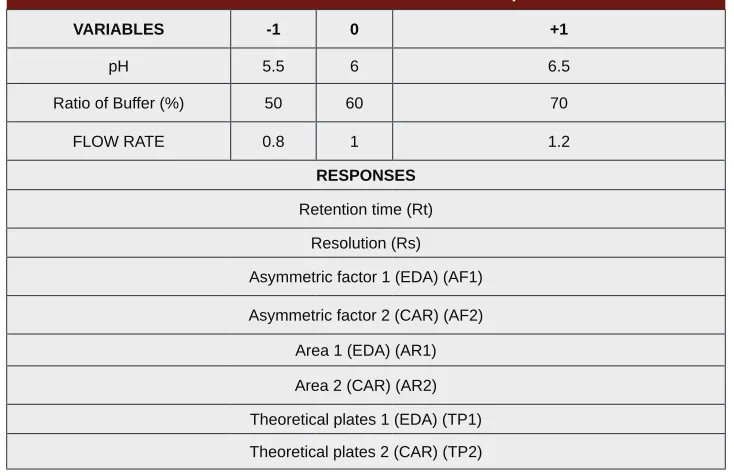
lead to generation of Design space in which the method is robust. Optimum ranges in which these factors were
varied were confirmed from the Preliminary investigation
studies (shown in Table 1). A 33 full factorial design requiring 27 runs was employed to generate an opti-mized bioanalytical method. Summary of ANOVA and Fit of model are described in Table 2. Equations for all the critical responses studied are shown below:
Retention time = +5.24-0.16 * A +1.64 * B -0.96 *
C -0.24 * A * B +0.074*A*C -0.14 * B * C +0.44 * B2 +0.11 * C2
Resolution = +5.76 +0.17 * A +3.83 * B +0.088 *
C -0.20 * A * B +0.29 * A * C +0.34* B * C-0.25* A2+1.15 * B2-0.30 * C2
Asymmetry factor 1 =+1.20+0.076* A-0.049 *
B+0.015* C+0.04 * A * B-0.024 * A * C+0.032 * B * C+0.031* A2-0.046 * B2 -0.020* C2
Asymmetry factor 2 =+0.85 -0.25 * B +0.090 *
C-0.027 * B * C -0.010 * C2 +0.037* B * C2
Area 1 = +1350.73 +39.22 * A- 270.64 * C
Figure 1: Ishikawa Fish bone Diagram.
Figure 3: Residual plots for critical responses (Rt =retention time, RS=resolution, AR= peak area, Af= Asymmetry, Tp= theoretical plates).
Figure 5: Mean plasma concentration vs time profile of EDA after IV administration of drug.
Table 1: Factors with their levels and selected responses for FFD
VARIABLES -1 0 +1
pH 5.5 6 6.5
Ratio of Buffer (%) 50 60 70
FLOW RATE 0.8 1 1.2
RESPONSES
Retention time (Rt)
Resolution (Rs)
Asymmetric factor 1 (EDA) (AF1)
Asymmetric factor 2 (CAR) (AF2)
Area 1 (EDA) (AR1)
Area 2 (CAR) (AR2)
Theoretical plates 1 (EDA) (TP1)
Table 2: ANOVA and summary of fit for full factorial model
Response Stddev Sum of
squares F-value
P-value (Prob.>F-value)
R2 Predicted
r2
Adjusted r2 AP
1 PRESS2
Retention
time 0.15 67.47 376.71 <0.0001 0.9941 0.9848 0.9914 67.287 1.063
Resolution 0.61 276.37 83.17 <0.0001 0.9778 0.9300 0.9600 25.016 19.80
Asymmetry
factor 1 0.035 0.21 19.67 <0.0001 0.9124 0.7566 0.8660 18.028 0.057
Asymmetry
factor 2 0.11 1.05 16.23 <0.0001 0.7944 0.7195 0.7455 11.185 0.4
Area 1 70.97 1.346E+006 133.64 <0.0001 0.918 0.8980 0.9107 26.196 497200
Area 2 47.12 7.338E+005 110.18 <0.0001 0.9349 0.9126 0.9265 25.270 68602.6
Theoretical
plates 1 1833.80 6.119E+008 20.22 <0.0001 0.9146 0.7712 0.8693 25.270 1.531E+008
Theoretical
plates 2 3475.37 1.892E+009 17.41 <0.0001 0.9021 0.7931 0.8503 25.270 6.435E+008
1. AP= Adequate Precision
2. PRESS= prediction error sum of squares
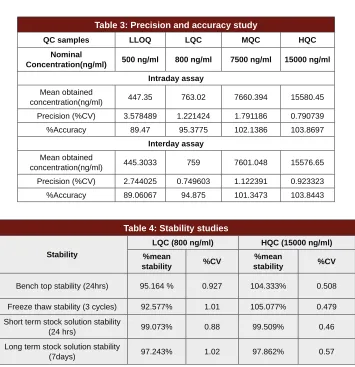
Table 3: Precision and accuracy study
QC samples LLOQ LQC MQC HQC
Nominal
Concentration(ng/ml) 500 ng/ml 800 ng/ml 7500 ng/ml 15000 ng/ml
Intraday assay
Mean obtained
concentration(ng/ml) 447.35 763.02 7660.394 15580.45
Precision (%CV) 3.578489 1.221424 1.791186 0.790739
%Accuracy 89.47 95.3775 102.1386 103.8697
Interday assay
Mean obtained
concentration(ng/ml) 445.3033 759 7601.048 15576.65
Precision (%CV) 2.744025 0.749603 1.122391 0.923323
%Accuracy 89.06067 94.875 101.3473 103.8443
Table 4: Stability studies
Stability
LQC (800 ng/ml) HQC (15000 ng/ml)
%mean
stability %CV
%mean
stability %CV
Bench top stability (24hrs) 95.164 % 0.927 104.333% 0.508
Freeze thaw stability (3 cycles) 92.577% 1.01 105.077% 0.479
Short term stock solution stability
(24 hrs) 99.073% 0.88 99.509% 0.46
Long term stock solution stability
Table 5: System suitability parameters
Parameters Edaravone Carbamazepine
Retention Time 5.25 ± 0.08 min 8.2± 0.17 min
Asymmetry 1.32 ± 0.16 1.04 ± 0.19
Theoretical plate (USP) 3464 9155
Theoretical plate/m. 14,681 81,144
Resolution [-] - 5.3
Capacity factor 1.76 3.32
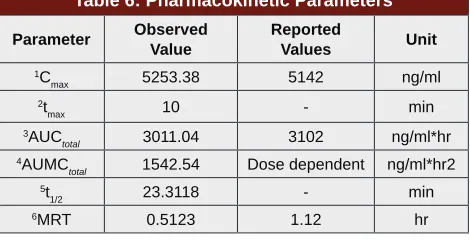
Table 6: Pharmacokinetic Parameters
Parameter Observed Value
Reported
Values Unit
1C
max 5253.38 5142 ng/ml
2t
max 10 - min
3AUC
total 3011.04 3102 ng/ml*hr
4AUMC
total 1542.54 Dose dependent ng/ml*hr2
5t
1/2 23.3118 - min
6MRT 0.5123 1.12 hr
3C
max:maximum (peak) concentration 4t
max:time after drug administration at which peak plasma concentration occurs 5AUC
total: area under the plasma drug concentration-time curve 6AUMC
total: area under the first moment curve 7t
1/2half-life: elimination half-life 8MRT: mean residence time
Theoretical Plates 1 = +16169.81 +564.94 * A -4891.33 *
B -2334.56* C +603.08* A * B -239.33 * A * C +625.58 * B * C -2733.28 * A2 +1668.89 * B2 +1006.56 * C2
Theoretical Plates 2 = +81982.48 +2166.28 * A
-4576.72 * B -4491.06* C +1680.92* A * B +794.42* A * C -4080.58 * B * C +4233.39 * A2 +10936.72* B2 + 400.39* C2
Optimization Criteria, Point verification and working
point selection: The desired target or range specified
for method optimization were Retention time (5.5-6.5), Resolution (2-8), Asymmetric factor 1 and 2 (0.9-13), Area 1 and 2 (in range), Theoretical plates 1 and 2 (>2500). Based on desired input goals for the responses, optimized solutions were generated by the software. Out of that 6 were selected for checkpoint analysis. All these six predictions were tested by experimental trials
and the responses observed lie within 95% confidence
interval of their predicted values. One of these solutions
was also selected as the final optimized working point
for the proposed Bioanalytical method i.e. Ammonium Acetate buffer pH 6: Acetonitrile in ratio of 60:40 that gives well resolved symmetric chromatogram (Figure 4) of EDA and CAR.
Plasma Sample Preparation: Various extraction
techniques were tried for sample preparation. Protein
precipitation technique using methanol yielded good recovery (70-72%), acetone yielded low recovery (about 55-57%) and acetonitrile led to sample recovery of 78-80 %. But plasma interference was relatively higher in the protein precipitation techniques. Liquid-Liquid extraction technique was tried with various extracting solvents like methyl tertiary butyl ether and diethyl ether, both yielding very low recovery (15-18%) and ethyl acetate yielding good recovery of 68-70%. Finally, solid phase extraction (SPE) technique was carried out by using various solvents like methanol, acetone, acetonitrile and various combinations of acetonitrile with acetate buffer for sample pretreatment and different brands of SPE cartridges. The best recovery (88-91%) along with low plasma interference was obtained using mixture of aceto-nitrile and ammonium acetate buffer (pH 6) in a ratio of 80:20 on STRATA X Phenomenex SPE cartridges.
Validation of developed bioanalytical method
Assay selectivity: There was no chromatographic
inter-ference from endogenous compounds at the retention times of EDA and CAR. The chromatographic peaks were well resolved to baseline.
Limit of detection (LOD) and lower limit of
quan-tification (LLOQ): The drug was detectable in plasma
samples upto 100 ng/ml while 500 ng/ml concentration was selected as the LLOQ.
Linearity of calibration curves: The linearity of the
calibration curve for EDA spiked in plasma over the concentration range of 500-20,000 ng/ml was evaluated. Calibration curves consisting of seven concentration values (500, 800, 1000, 5000, 10000, 15000 and 20,000 ng/ml) of EDA spiked in human plasma with respect to the area ratio of drug to internal standard were con-structed. The mean linear regression equation of the calibration curves (n = 5) was: y = 0.1075x + 0.0679; where y represents the peak area ratio (EDA/CAR), and x represents the plasma concentration of EDA in (ng/ml).
Precision and accuracy: The intraday assay %CV at LLOQ, LQC, MQC and HQC were 3.578%, 1.221%, 1.791% and 0.791% respectively. The interday assay %CV for the above concentrations were 2.744%, 0.749%, 1.122% and 0.923% (n = 5 in all cases) respec-tively. Intraday assay and interday assay accuracy ranged
from 89% to 104% which is within the limits specified.
The results indicate the precision, accuracy and repro-ducibility of the assay. These results are summarised in
Table 3.
Extraction recovery: Absolute recovery of EDA and
CAR was calculated which determine the extraction
efficiency of method. The mean percentage extraction
recoveries of EDA at the three QC concentrations (LQC, MQC and HQC) were 88.83%, 93.56% and 92.65% respectively. The overall %CV was found to be 1.646%. CAR (IS) showed relatively high extraction recovery about 94-96%.
Dilution Integrity: %CV for dilution integrity at 1:2
and 1:4 levels are 0.0509% and 0.962% respectively and the % mean accuracy was calculated to be 95.294% and 101.362% respectively.
Stability: EDA was stable in spiked plasma when stored
for 24 hrs at room temperature (bench top stability) and for three freeze thaw cycles at -70±5 °C (freeze thaw stability). The stock solution of EDA was stable for 24 hrs at room temperature (short term stock solution stability) and for 7 days at 2-8ºC (long term stock solu-tion stability). The %mean stability of these samples and their %CV are reported in Table 4.
System suitability tests: Parameters such as theoretical
plates, asymmetry factor, capacity factor and resolution were calculated for EDA and CAR in the plasma sample solutions along with their standard deviation to determine the system suitability of HPLC method by taking six replicates of the samples. The system suitability param-eters showed satisfactory results and the lower standard deviation obtained indicates the repeatability of the method. The results are shown in Table 5.
Pharmacokinetic Analysis
The proposed bioanalytical method could be applied for study of pharmacokinetics of EDA and detection of any metabolites. When the processed plasma samples collected from rats as described in section 2.8 were injected into HPLC, peak of EDA could be clearly seen at retention time of about 5.2 m. Apart from this, two other distinguished sharp peaks could also be observed at retention times of 3.4 m and 9.9 m suggesting at least two major metabolites of EDA in plasma. Literature review revealed that these two major metabolites of EDA could possibly be Edaravone gluco-uronate and
Edaravone sulphate. Figure 4 depicts the overlay chro-matograms which shows the changes in drug concen-trations and metabolites of EDA at various designated time points (5, 10, 15, 20, 30, 40 m).
The pharmacokinetic parameters were calculated with a Non-Compartmental model using Thermo Kinetica PK/PD analysis software (version 5.0 Thermo Fisher
Scientific). The peak plasma concentration (Cmax) and
the corresponding time (Tmax) were directly obtained from the raw data. The other pharmacokinetic param-eters obtained using non compartment model is shown in Table 6. AUCTOTAL was calculated using mixed log linear
model. Concentration-time profile of EDA in rats after
intravenous administration is shown in Figure 5.
CONCLUSION
QBD was not utilized in earlier reported HPTLC and LC-MS/MS methods. By adopting a QBD approach for present method, a successful model highlighting
an allowed designed space for a defined response is obtained. PBD lead to filtering the highly significant
critical material attributes among all the different variables affecting the process. These deduced factors when subjected to FFD generated a design space within which the method was robust. Thus, a well resolved chromatogram for Edaravone and internal standard Carbamazepine could be obtained which was then employed as a bioanalytical method. The developed
assay was specific, accurate, precise and reproducible for
the analysis of EDA in plasma. The use of this method can also enable the characterization of EDA pharmaco-kinetics after single intravenous dose without any inter-ference of the metabolite. Compared to LC-MS, it is a simple and inexpensive method that can be easily and successfully extended to quantitate EDA in plasma for routine monitoring of levels of EDA in laboratories. However the proposed method is less sensitive as com-pared to reported HPTLC method.
ACKNOWLEDGEMENTS
The authors express their sincere thanks to BDR Phar-maceuticals International Pvt. Ltd., Baroda and Sun Pharmaceuticals, Vadodara for providing gift samples of Edaravone and Carbamazepine required for the study.
REFERENCES
1. Kikuchi K, Miura N, Morimoto Y, Ito T, Tancharoen S, Miyata K, et al. Beneficial effects of the free radical scavenger edaravone (radicut) in neurologic diseases. J Neurol Neurophysiol. 2011;1:1-5.
2. Gandhimathi M, Kumar MS, Baghla R and Ravi TK. RP-HPTLC Method for the In Vitro Estimation of Edaravone in Human Plasma. Indian J Pharma Sci. 2010;72(2):276-82.
3. Ping L, Zheng-Yu Y, Zhi-Ji X and Xiao S. A novel fluorescent assay for edaravone with aqueous functional CdSe quantum dots. Spectrochemica
Acta Part A: Mol. and Biomol. Spectro. 2009;72(5):75.
4. Patel B, Raj H and Jain V. Simultaneous estimation of edaravone and citicoline sodium by ratio derivative spectroscopic method in synthetic mixture. Pharma Science Monitor 2014; 5(2):118-28.
5. Patel B, Raj H, Jain V, Sutariya V, Bhatt M, et al. Method development and validation of RP-HPLC for simultaneous estimation of edaravone and citicoline sodium in synthetic mixture. Invent rapid J Pharm analysis and
Quality assurance. 2014;4:3.
6. Li jin-lin. Determination of Phenyl hydrazine Residues in Edaravone by HPLC. J China Pharmacy. 2008;31:2454-5.
7. Dao-quan Tang. LC-MS/MS methods for the determination of Edaravone
and/or taurine in rat plasma and its application to a pharmacokinetic study.
Biomed. Chromatogr. 2014;28(9):1173-82. http://dx.doi.org/10.1002/
bmc.3139 ; PMid:24706508.
8. F.D.A., 2003. Guidance for Industry: Bioanalytical method validation, U.S.
Department of Health and Human Services, Food and Drug Administration,
Center for Drug Evaluation and Research (CDER) and Center for Veterinary
Medicine.
9. ICH Q8 (R2) 2009. International Conference on Harmonization (ICH) of
Technical Requirements for Registration of Pharmaceuticals for Human Use,
Topic Q8 (R2): Pharmaceutical development.
10. ICH Q9 2009. International Conference on Harmonization (ICH) of Technical
Requirements for Registration of Pharmaceuticals for Human Use, Quality
Risk Management.
SUMMARY
• SPE-HPLC bioanalytical method of Edaravone, a neuroleptic drug indicated in treatment of acute ischemic stroke, has been developed and utilized for pharmacokinetic study and determination of it’s metabolites in rat plasma. The method was developed by utilizing principles of quality by design. Placket burman design with seven variables was used for screening, and full factorial design with three variables was used for opti-mization of chromatographic condition. Carbamazepine was used as internal standard and the method was validated as per USFDA guideline. The mobile phase of optimized method comprised of ammonium acetate buffer (10 mmol, pH 6) and acetonitrile in the ratio of 60:40 v/v. The separation was carried out on Kromasil RP C-18 column (250 mm × 4.6 mm; 5 μm) at wavelength of 243 nmat flow rate of 1 ml/min. Solid phase extraction using STRATA X C18 Phenomenex cartridges was utilized for extraction of Edaravone and internal standard from biological matrix. The retention time of Edaravone and carmazepine were 5.2 and 8.2 min respectively, while two metabolites were observed at retention time of 3.4 and 9.9 min.
Sadhana Rajput: Quality Assurance Laboratory, Centre of Relevance and Excellence in Novel Drug Delivery System, Pharmacy Department, G. H. Patel Building, Donor’s Plaza, The Maharaja Sayajirao University of Baroda, Fatehgunj, Vadodara, Gujarat, INDIA.