w w w . i a j p s . c o m
Page 1382
CODEN (USA): IAJPBB ISSN: 2349-7750
I
I
N
N
D
D
O
O
A
A
M
M
E
E
R
R
I
I
C
C
A
A
N
N
J
J
O
O
U
U
R
R
N
N
A
A
L
L
O
O
F
F
P
P
H
H
A
A
R
R
M
M
A
A
C
C
E
E
U
U
T
T
I
I
C
C
A
A
L
L
S
S
C
C
I
I
E
E
N
N
C
C
E
E
S
S
Available online at:
http://www.iajps.com
Research Article
A RAPID STABILITY INDICATING RP-HPLC ASSAY
METHOD DEVELOPMENT AND VALIDATION FOR THE
QUANTITATIVE ESTIMATION OF DABIGATRAN
ETEXILATE MESYLATE IN CAPSULES
P. Manasa, P. Sowndarya, K. Mounika, A. Ashok Kumar*
Department of Pharmaceutical Analysis and Quality Assurance, Vijaya College of Pharmacy,
Munaganur (village), Hayathnagar (mandal), Ranga Reddy District, Telangana – 501511.
Abstract:The article aims at developing a rapid, sensitive, accurate, precise and linear stability indicating Reverse Phase High Performance Liquid Chromatographic (RP-HPLC) assay method and validate as per ICH guidelines for the estimation of Dabigatran etexilate mesylate in capsules. The optimized method employs a reverse phase column, Phenomenex Kinetex EVO C18 (250X4.6mm;5μ), a mobile phase of triethylammonium phosphate buffer (pH 2.0):methanol:acetonitrile in the proportion of 30:30:40 v/v, flow rate of 0.6ml/min and a detection wavelength of 254 nm using a UV detector. Optimized method separated all the forced degradant impurities from the drug peak. Dabigatran etexilate mesylate eluted at 3.73min and the linearity of the method was 10-30μg/ml. The precision was exemplified by relative standard deviation of 1.25%. Percentage mean recovery was found to be in the range of 90‐110, during accuracy studies. The limit of detection (LOD) and limit of quantitiation (LOQ) was found to be 1.09ng/ml and 3.32ng/ml respectively.
Keywords:Dabigatran etexilate mesylate, stability indicating HPLC assay method development, validation.
*Corresponding author:
A. Ashok Kumar,
Professor and HOD,
Department of Pharmaceutical Analysis and Quality Assurance,
Vijaya College of Pharmacy, Munaganur (village),
Hayathnagar (Mandal), Hyderabad – 501511, India.
Email: [email protected]
Please cite this article in press as Ashok Kumar et al , A Rapid Stability Indicating RP-HPLC Assay Method Development and Validation for the Quantitative Estimation of Dabigatran Etexilate Mesylate in
Capsules, Indo Am. J. Pharm. Sci, 2015;2(10).
w w w . i a j p s . c o m
Page 1383
INTRODUCTION
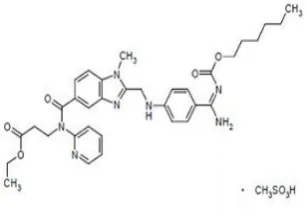
Dabigatran etexilate (DE) is the oral prodrug of the active moiety dabigatran. The dabigatran etexilate pro-drug was developed due to the limited oral availability of dabigatran, and it is converted into dabigatran (DAB) invivo via esterases enzyme. The drug substance is the mesylate salt form of the prodrug, called dabigatran etexilate mesylate (DEM) (Figure 1). The chemical name (IUPAC) of dabigatran etexilate mesylate is ethyl-N-{[2-({[4-((E)-amino {[(hexyloxy)carbonyl] imino} methyl) phenyl]amino}methyl)-1-methyl-1H-benz imidazol -5-yl]carbonyl}-N-pyridin-2-yl-β-alaninate
methane sulfonate [1] corresponding to the molecular formula C35H45N7O8S. Dabigatran is an oral anticoagulant drug that acts as a direct thrombin (factor IIa) inhibitor. It was developed by the pharmaceutical company Boehringer Ingelheim. It is an anticoagulant medicine used for the prevention of clots and emboli after orthopedic surgery (hip or knee replacement) and to prevent stroke and other systemic emboli in people with non-valvular atrial fibrillation (AF), a commonly occurring abnormal heart rhythm [2]. Few analytical methods are reported for the determination of Dabigatran etexilate by UV [3], LC/ MS [4] and UPLC MS/MS [5] in bulk and/or plasma. While few stability indicating assay methods are cited in the literature using isocratic and gradient RPHPLC using various buffers and at various pH’s having higher run times from 10miutes to 20minutes [1,6]. Hence, we here report a totally new and rapid validated stability indicating isocratic RP-HPLC assay method using phosphate buffer at pH 2.0, validation being performed as per ICH guidelines.
Fig. 1: Structure of Dabigatran etexilate Mesylate
MATERIALS AND METHODS Chemicals and Reagents
Analytically pure sample of Dabigatran etexilate mesylate with purity 95% was obtained as gift sample from Chandra labs, Hyderabad, India and
capsule formulation [PRADAXA] was procured from Apollo Pharmacy, Hyderabad, India with labelled amount of 110mg of Dabigatran etexilate mesylate. Acetonitrile (HPLC grade), Methanol (HPLC grade), Water (HPLC grade), Triethylamine (AR Grade) and Orthophosphoric acid (AR Grade) were obtained from SD Fine chemicals (Hyderabad, India), 0.45 μm and 0.22μm Nylon membrane filters were obtained from Spincotech Private Limited, Hyderabad, India.
Instrument
HPLC analysis was performed on Shimadzu LC-20AD Prominence Liquid Chromatograph comprising a LC-20AD pump, Shimadzu SPD-20A Prominence UV-VISIBLE detector and a reverse phase C18 column, Phenomenex Kinetex EVO (250X4.6mm;5μ). A manually operating Rheodyne injector with 20 μl sample loop was equipped with the HPLC system. The HPLC system was controlled with “Lab solutions lite” software. An electronic analytical weighing balance (0.1mg sensitivity, Shimadzu AY 220), digital pH meter (DELUX model 101) and sonicator (sonica, model 2200 MH) were also used for this study.
Selection of Wavelength
Forced degradation samples, standard and blanks along with controls were injected into HPLC at various wavelengths viz. 220nm, 254nm, 290nm and 325nm. Significant impurities and majority of impurities along with the drug were detected at 254nm and hence was chosen as suitable wavelength.
Chromatographic Conditions
The optimized method employs a reverse phase column, Phenomenex Kinetex EVO C18 (250X4.6mm;5μ), a mobile phase of triethylammonium phosphate buffer (pH 2.0):methanol:acetonitrile in the proportion of 30:30:40 v/v, flow rate of 0.6ml/min and a detection wavelength of 254 nm using a UV detector.
Buffer Preparation
The buffer solution was prepared by adding 5 ml of triethylamine to 1000 ml of HPLC grade water and later pH was adjusted to 2.0 using 30% v/v of ortho phosphoric acid in water. The buffer was then filtered through 0.45 μm nylon membrane filter.
Mobile phase Preparation
The mobile phase was prepared by mixing buffer, methanol and acetonitrile in the ratio of 30:30:40 v/v and later it was sonicated for 10 minutes for the removal of air bubbles.
Preparation of Stock and Working Standard Solution
w w w . i a j p s . c o m
Page 1384
minutes to dissolve. Later the solution was made up to the mark using the mobile phase. This is considered as stock standard solution (100µg/ml). From the stock solution, 2ml was pipetted out and made upto 10ml using the mobile phase to get a concentration of 20µg/ml, treated as 100% target concentration.
Preparation of Stock and Working Sample Solution
Not less than 10 capsules were taken, emptied and test stock solution of Dabigatran etexilate mesylate (200μg/ml) was prepared by transferring weight equivalent to 10mg of Dabigatran etexilate mesylate to 40ml of mobile phase which is sonicated for 5min and later made up to 50ml with mobile phase. This solution was filtered using 0.22micron syringe filter. From the above stock solution 1ml was pipetted out and made up to 10ml to get working sample solution equivalent to a concentration of 20µg/ml for Dabigatran etexilate mesylate, concentration equal to 100% target concentration.
RESULTS AND DISCUSSION Method Development
RP-HPLC isocratic stability indicating assay method was developed keeping in mind the system suitability parameters i.e. tailing factor (T), number of theoretical plates (N), runtime, separation of drug peak from the forced degradants, detection of drug peak along with significant impurities and majority of impurities. The optimized method
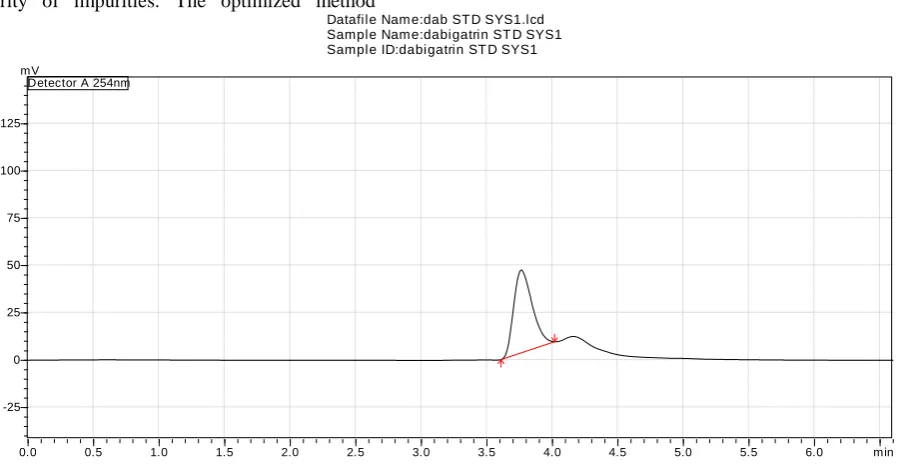
developed resulted in the elution of Dabigatran etexilate mesylate at 3.73min. Figures 2&3 represent control chromatograms of standard and sample. A table 1&2 summarizes system suitability parameters for the standard and the sample.
Table 1: System Suitability Studies Results for Standard.
Parameters Dabigatran etexilate
mesylate
Retention time (min) 3.763
Number Of Theoretical plates (N)
3054
Tailing factor (T) 1.367
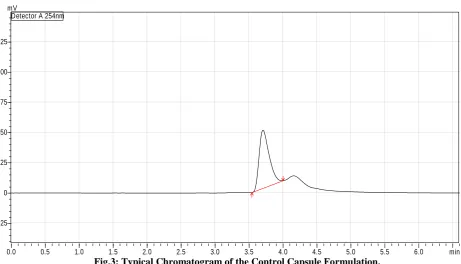
Table 2: System Suitability Studies Results for Sample.
Parameters Dabigatran etexilate
mesylate
Retention time (min) 3.739
Number Of Theoretical plates (N)
2989
Tailing factor (T) 1.327
Datafile Name:dab ST D SYS1.lcd Sample Name:dabigatrin ST D SYS1 Sample ID:dabigatrin ST D SYS1
0.0 0.5 1.0 1.5 2.0 2.5 3.0 3.5 4.0 4.5 5.0 5.5 6.0 min -25
0 25 50 75 100 125
mV
Detector A 254nm
w w w . i a j p s . c o m
Page 1385
Datafile Name:dabi for2.lcdSample Name:dabigatrin for2 Sample ID:dabigatrin for2
0.0 0.5 1.0 1.5 2.0 2.5 3.0 3.5 4.0 4.5 5.0 5.5 6.0 min
-25 0 25 50 75 100 125
mV
Detector A 254nm
Fig.3: Typical Chromatogram of the Control Capsule Formulation.
In order to test the applicability of the developed method to a commercial formulation, PRADAXA was chromatographed at working concentration (20µg/ml) and it is shown in Figure 3. The sample peak was identified by comparing the retention time with the standard drug Figure 2. System suitability parameters were within the acceptance limits, ideal for the chromatographed sample. Integration of separated peak area was done and drug concentration was determined by using the peak area concentration relationship obtained in the standardization step. The protocol affords reproducible assay of the drug in the sample ranging between 90 and 110%, which is the standard level in any pharmaceutical quality control.
Method Validation
Validation of the analytical method is the process that establishes by laboratory studies in which the performance characteristics of the method meet the requirements for the intended analytical application. RP-HPLC method developed was validated according to International Conference on Harmonization (ICH) guidelines [9] for validation of analytical procedures. The method was validated for the parameters like system suitability, specificity, linearity, accuracy, precision, and sensitivity.
Specificity
Blank, standard drug solution and sample chromatogram revealed that the peaks obtained in the standard solution and sample solution at working concentrations are only because of the drug as blank had no peak at the retention time of Dabigatran etexilate mesylate. Accordingly it can be concluded that, the method developed is said to be specific.
Precision System Precision
Six replicate injections of the standard solution at working concentration showed % RSD (Relative Standard Deviation) less than 2 concerning peak area for the drug, which indicates the acceptable reproducibility and thereby the precision of the system. System precision results are tabulated in Table 3.
Method Precision
Method precision was determined by performing assay of sample under the tests of repeatability at working concentration.
Repeatability (Intra day precision)
w w w . i a j p s . c o m
Page 1386
the method gives consistently reproducible results (Table 4).
Table 3: System Precision Results of Dabigatran etexilate Mesylate.
Injection no. (n) Peak area
1 433787
2 430135
3 429575
4 427906
5 433759
6 431065
Average 431037.8333
STDEV 2354.857653
%RSD 0.546322729
Table 4: Intraday Precision Results of Dabigatran Etexilate Mesylate.
n Sample area % Assay
1 487353 107.4117663
2 492549 108.5569558
3 498821 109.9392938
4 497178 109.5771794
5 488400 107.6425233
6 482826 106.4140232
Average 491187.8333 108.2569569
STDEV 6138.376379 1.352887637
%RSD 1.249700412 1.249700412
Linearity
Standard solutions of Dabigatran etexilate mesylate at different concentrations level (50%, 75%, 100%, 125% and 150%) were prepared. Calibration curve was constructed by plotting the concentration level of drug versus corresponding peak area. The results show an excellent linear correlation between peak
area and concentration level of drug within the concentration range (10-30µg/ml) for the drug and the results are given in Table 5 and Figure 4. The correlation coefficient of Dabigatran etexilate mesylate is 0.9958 and hence the method is said to be linear in the range of 10-30 µg/ml.
Table 5: Calibration Data of Dabigatran etexilate Mesylate.
n % Level Concentration (g/ml) Peak Area
1 50 10 245554
2 75 15 374059
3 100 20 503700
4 125 25 624649
5 150 30 715690
Regression coefficient 0.9958
w w w . i a j p s . c o m
Page 1387
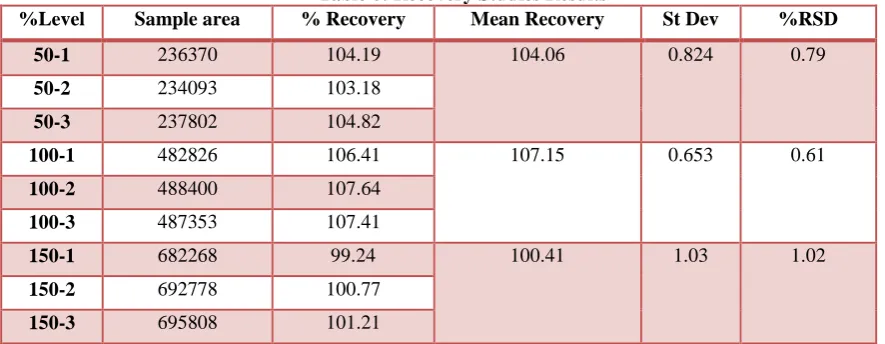
Fig4: Calibration Curve of Dabigatran etexilate Mesylate Table 6: Recovery Studies Results
%Level Sample area % Recovery Mean Recovery St Dev %RSD
50-1 236370 104.19 104.06 0.824 0.79
50-2 234093 103.18
50-3 237802 104.82
100-1 482826 106.41 107.15 0.653 0.61
100-2 488400 107.64
100-3 487353 107.41
150-1 682268 99.24 100.41 1.03 1.02
150-2 692778 100.77
150-3 695808 101.21
Accuracy
Accuracy was determined by means of recovery experiments, by the determination of % mean recovery of sample at three different levels (50-150%). At each level, three determinations were performed. Percent mean recovery was calculated as shown in Table 6. The accepted limits of recovery are 90%-110% for the process of determining recovery of the standard from the formulation at three different levels of 50%, 100% and 150%. All observed data are within the required range which indicates good recovery values and hence the accuracy of the method developed.
Sensitivity
The sensitivity of measurement of Dabigatran etexilate mesylate by use of the proposed method was estimated in terms of the limit of quantitation (LOQ) and the limit of detection (LOD). LOQ and LOD were calculated by the use of the equations
LOD = 3.3/S and LOQ = 10/S where is the standard deviation of response of calibration plot and S is the slope of the corresponding calibration plot. The limit of detection (LOD) and limit of quantitiation (LOQ) was found to be 1.09ng/ml and 3.32ng/ml respectively.
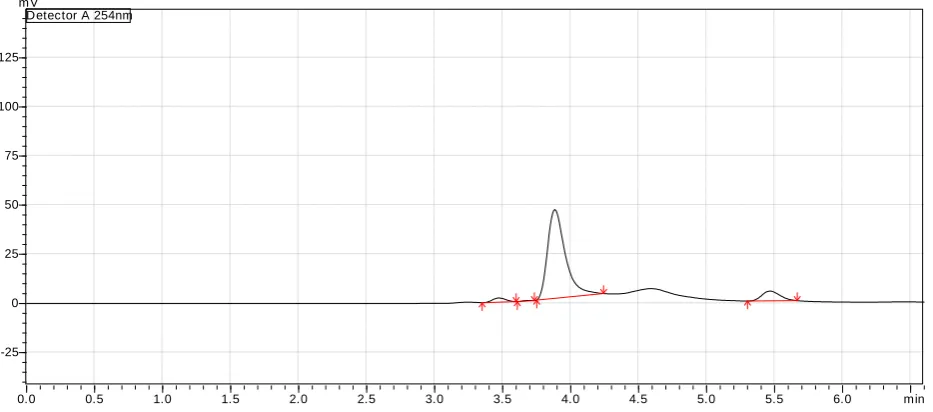
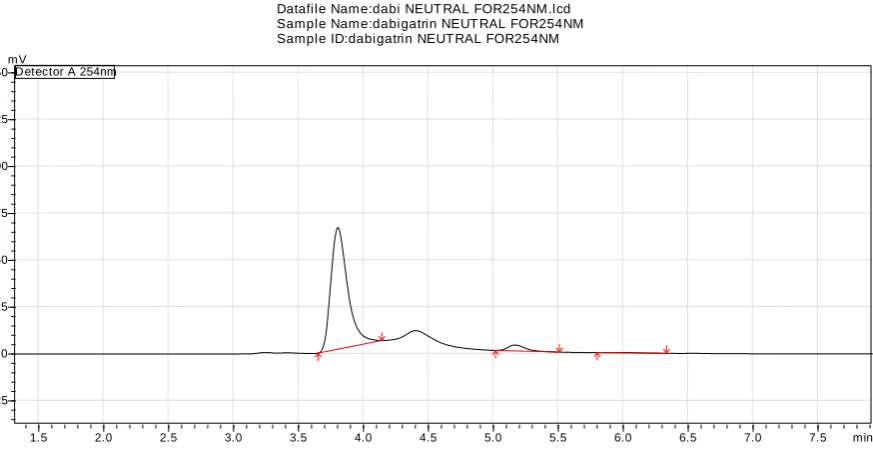
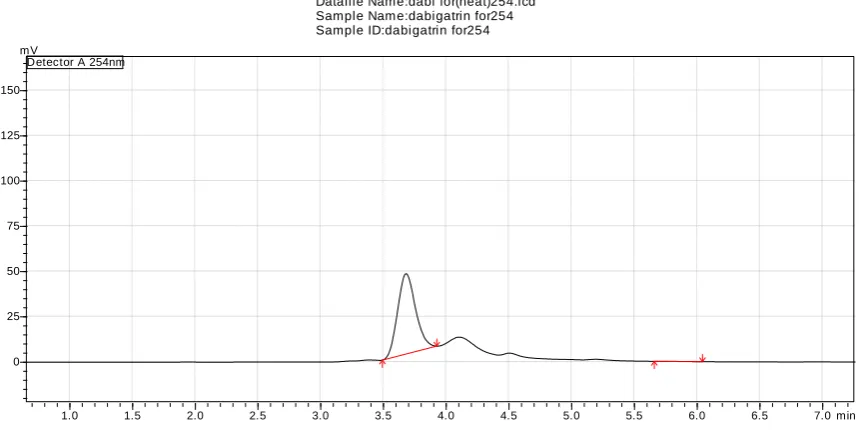
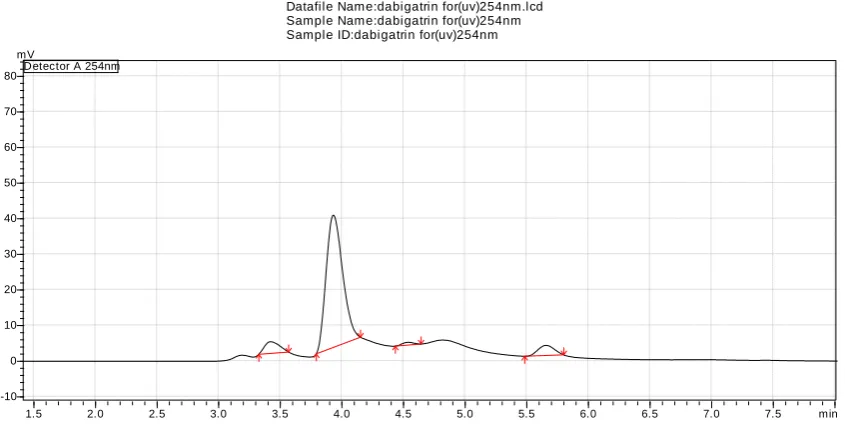
Forced Degradation Studies
Controls and forced degradation of blank, standard and sample were injected into HPLC system. Each and every forced degradation condition was optimized by changing the strength and volume of the reagent, temperature and time of exposure till there exist degradation significantly. Figures 5 to 11 represent chromatograms of forced degradation samples under optimized conditions of acidic, basic, neutral, oxidation, uv, visible and dry heat.
Table 7 summarizes the optimized forced
w w w . i a j p s . c o m
Page 1388
Table 7: Forced Degradation Studies of the Sample:
Optimized Degradation conditions % Degradation RT of impurities –min and
(percentage) Acidic
(1ml of 1N HCl, 65-75ºC, 2 hours)
30.18 3.472 (3.065%)
3.692 (0.281%)
5.466 (9.811%)
7.090 (0.078%)
Basic
(1ml of 1N NaOH, 65-75ºC, 10min)
32.91 -
Neutral
(1ml water, 65-75ºC for 2 hours and later kept overnight for 48 hours at rt)
6.4 5.168(4.722%)
5.945(0.365%)
Oxidation
(2ml of 6%H2O2 kept overnight at rt)
16.13 7.071(0.211%)
UV
(Short for 7 days and later Long 7 days)
44.67 3.422(6.791%)
4.538(1.254%)
5.656(6.458%)
Light
(15 days under sunlight)
25.45 3.383(0.605%)
4.621(0.295%)
5.629(0.779%)
Dry Heat (75-85ºC,7 days)
24.85 5.663(0.079%)
Datafile Name:dabigat acidic for254nm.lcd Sample Name:dabigatrinaci dic for 254nm Sample ID:dabigatrin acidic for 254nm
0.0 0.5 1.0 1.5 2.0 2.5 3.0 3.5 4.0 4.5 5.0 5.5 6.0 min
-25 0 25 50 75 100 125
mV
Detector A 254nm
w w w . i a j p s . c o m
Page 1389
Sample Name:dabigatrin for10min 254nm Sample ID:dabigatrin for10min 254nm
0.0 0.5 1.0 1.5 2.0 2.5 3.0 3.5 4.0 4.5 5.0 5.5 6.0 min 0
10 20 30 40 50 60 70 80 90
mV
Detector A 254nm
Fig. 6: Chromatogram of the Sample under Basic Degradation
Datafile Name:dabi NEUT RAL FOR254NM.lcd Sample Name:dabigatrin NEUT RAL FOR254NM Sample ID:dabigatrin NEUTRAL FOR254NM
1.5 2.0 2.5 3.0 3.5 4.0 4.5 5.0 5.5 6.0 6.5 7.0 7.5 min -25
0 25 50 75 100 125 150
mV
Detector A 254nm
w w w . i a j p s . c o m
Page 1390
Datafile Name:dab oxd for2ml.lcd Sample Name:dabigatrin oxd for2ml Sample ID:dabigatrin oxd for2ml
1.5 2.0 2.5 3.0 3.5 4.0 4.5 5.0 5.5 6.0 6.5 7.0 7.5 min -10
0 10 20 30 40 50 60 70 80
mV
Detector A 254nm
Fig. 8: Chromatogram of the Sample under Oxidative Degradation
Datafile Name:dabi for(heat)254.lcd Sample Name:dabigatrin for254 Sample ID:dabigatrin for254
1.0 1.5 2.0 2.5 3.0 3.5 4.0 4.5 5.0 5.5 6.0 6.5 7.0 min 0
25 50 75 100 125 150
mV
Detector A 254nm
w w w . i a j p s . c o m
Page 1391
Sample Name:dabigatrin for(light)254nm Sample ID:dabigatrin for(li ght)254nm
0.0 0.5 1.0 1.5 2.0 2.5 3.0 3.5 4.0 4.5 5.0 5.5 6.0 min -10
0 10 20 30 40 50 60 70 80
mV
Detector A 254nm
Fig. 10: Chromatogram of the Sample under Sunlight Degradation
Datafile Name:dabigatrin for(uv)254nm.lcd Sample Name:dabigatrin for(uv)254nm Sample ID:dabigatrin for(uv)254nm
1.5 2.0 2.5 3.0 3.5 4.0 4.5 5.0 5.5 6.0 6.5 7.0 7.5 min -10
0 10 20 30 40 50 60 70 80
mV
Detector A 254nm
Fig. 11: Chromatogram of the Sample under UV Degradation
CONCLUSION
A reverse phase HPLC isocratic stability indicating assay method has been developed and validated as per ICH guidelines for the quantitative estimation of Dabigatran etexilate mesylate in capsules. Forced degradants were separated from the drug peak using the optimized method. The precision is exemplified by relative standard deviation of 1.25%. A good linear relationship was observed for the drug between concentration ranges of 10 and 30µg/ml. Accuracy studies revealed that mean recoveries were between 90 and 110%, an indicative of accurate method. The limit of detection (LOD) and limit of quantitiation (LOQ) was found to be 1.09ng/ml and 3.32ng/ml
respectively. Accordingly it can be concluded that the developed reverse phase isocratic HPLC stability indicating assay method is sensitive, accurate, precise and linear and therefore the method can be used for the routine analysis of Dabigatran etexilate mesylate in capsules.
ACKNOWLEDGEMENT
w w w . i a j p s . c o m
Page 1392
REFERENCES
1. Pradeep GS, Chandewar AV. Validated stability indicating high performance liquid chromatographic assay method for the determination of Dabigatran etexilate mesylate. Research Journal of Pharmaceutical, Biological and Chemical Sciences 2014;5(2):1637-1644.
2. Eerenberg ES, Kamphuisen PW, Sijpkens MK, Meijers JC, Buller HR, Levi M. Reversal of Rivaroxaban and Dabigatran by prothrombin Complex Concentrate: A Randomized, Placebo-Controlled, Crossover Study in Healthy Subjects. Circulation2011;124(14):1573- 1579.
3. Ankit P, Sharad K, Ashim KS, Aarti Z, Seth AK. Spectrophotometric method for estimation of Dabigatran etexilate in bulk and its pharmaceutical dosage form. Pharma Science Monitor 2014;5(2):31-39.
4. Zhe-Yi Hu, Robert BP, Vanessa LH, Casey L. Conventional iquid chromatography/triple quadrupole mass spectrometry based metabolite identification and semi-quantitative estimation approach in the investigation of invitro Dabigatran etexilate metabolism. Anal Bioanal Chem 2013;405(5):1695-1704.
5. Xavier D, Julie M, Laporte S, Patrick M, Thierry B. UPLC MS/MS assay for routine quantification of Dabigatran - a direct thrombin inhibitor in human plasma. J Pharm Biomed Anal 2012;25(58):152-156.
6. Mrinalini CD, Rupesh AB. Development and validation of stability-indicating RP-HPLC method for estimation of Dabigatran etexilate. J Adv Sci Res 2014;5(3):39-44.
7. Bernardi RM, Froehlich PE, Bergold AM. Development and validation of a stability indicating liquid chromatography method for the determination of Dabigatran etexilate in capsules. J AOAC Int 2013;96(1):37-41.
8. Sekhar reddy BRC, Vijaya bhaskar rao N. A stability indicating RP-HPLC method for estimation of Dabigatran in pure and pharmaceutical dosage forms. South pacific journal of pharma and bioscience 2014;2(1):80-92.