Hydrol. Earth Syst. Sci., 19, 1069–1091, 2015 www.hydrol-earth-syst-sci.net/19/1069/2015/ doi:10.5194/hess-19-1069-2015
© Author(s) 2015. CC Attribution 3.0 License.
Drought severity–duration–frequency curves:
a foundation for risk assessment and planning tool for
ecosystem establishment in post-mining landscapes
D. Halwatura1, A. M. Lechner2,3, and S. Arnold1
1Centre for Mined Land Rehabilitation, Sustainable Minerals Institute, the University of Queensland, Brisbane, Australia 2Centre for Social Responsibility in Mining, Sustainable Minerals Institute, the University of Queensland, Brisbane, Australia 3Centre for Environment, University of Tasmania, Hobart, Australia
Correspondence to: D. Halwatura ([email protected])
Received: 10 April 2014 – Published in Hydrol. Earth Syst. Sci. Discuss.: 13 May 2014 Revised: 28 January 2015 – Accepted: 30 January 2015 – Published: 26 February 2015
Abstract. Eastern Australia has considerable mineral and energy resources, with areas of high biodiversity value co-occurring over a broad range of agro-climatic environ-ments. Lack of water is the primary abiotic stressor for (agro)ecosystems in many parts of eastern Australia. In the context of mined land rehabilitation quantifying the severity– duration–frequency (SDF) of droughts is crucial for suc-cessful ecosystem rehabilitation to overcome challenges of early vegetation establishment and long-term ecosystem re-silience.
The objective of this study was to quantify the SDF of short-term and long-term drought events of 11 selected loca-tions across a broad range of agro-climatic environments in eastern Australia by using three drought indices at different timescales: the Standardized Precipitation Index (SPI), the Reconnaissance Drought Index (RDI), and the Standardized Precipitation-Evapotranspiration Index (SPEI). Based on the indices we derived bivariate distribution functions of drought severity and duration, and estimated the recurrence intervals of drought events at different timescales. The correlation be-tween the simple SPI and the more complex SPEI or RDI was stronger for the tropical and temperate locations than for the arid locations, indicating that SPEI or RDI can be replaced by SPI if evaporation plays a minor role for plant available water (tropics). Both short-term and long-term droughts were most severe and prolonged, and recurred most frequently in arid regions, but were relatively rare in tropical and temper-ate regions.
Our approach is similar to intensity–duration–frequency (IDF) analyses of rainfall, which are crucial for the design of hydraulic infrastructure. In this regard, we propose to ap-ply SDF analyses of droughts to design ecosystem compo-nents in post-mining landscapes. Together with design rain-falls, design droughts should be used to assess rehabilitation strategies and ecological management using drought recur-rence intervals, thereby minimising the risk of failure of ini-tial ecosystem establishment due to ignorance of fundamen-tal abiotic and site-specific environmenfundamen-tal barriers, such as flood and drought events.
1 Introduction
pre-Figure 1. (a) Selected locations of interest with boundaries of (b) agro-climatic classes (Hutchinson et al., 2005) and (c)
Aus-tralian agricultural environments (Woodhams et al., 2012).
venting production. For some of the agro-climatic regions in eastern Australia, the lack of water is the primary abiotic stressor for (agro)ecosystems throughout the year, whereas for others water availability is at least seasonally limited (Ta-ble 1). In the past century, regions across Australia have regu-larly experienced periods of water deficit (Murphy and Tim-bal, 2008). Approximately one-third of Australia is arid with rainfall of less than 250 mm per year, and another one-third is semi-arid (250–500 mm yr−1). There are few areas where rainfall exceeds evaporation on an annual basis (Bell, 2001). Drought events are distributed diversely with regard to their duration, severity, and frequency of occurrence over the con-tinent.
Droughts and associated limitations in plant available wa-ter dewa-termine plant distribution in response to climatic condi-tions in post-mining landscapes. Ecosystem attributes such as the distribution of native tropical species (Engelbrecht et al., 2007; Kuster et al., 2013), the structure and functioning of forests (Zhang and Jia, 2013; Vargas et al., 2013), biodiver-sity and ecosystem resilience (Brouwers et al., 2013; Lloret, 2012; Jongen et al., 2013), and primary productivity and res-piration of vegetation (Shi et al., 2014) are sensitive to the occurrence of drought events. In the context of mined land rehabilitation, droughts also play a critical role for the early establishment of plants (Nefzaoui and Ben Salem, 2002; Gardner and Bell, 2007) and long-term resilience of novel
(Doley et al., 2012; Doley and Audet, 2013) and/or native ecosystems on post-mining land (Bell, 2001). Across the life span of plants due to their under-developed root system, ju-venile vegetation such as seeds, seedlings, and pre-mature rather than climax vegetation is especially vulnerable to lack of water availability (Jahantab et al., 2013; Craven et al., 2013; Arnold et al., 2014a). For climax vegetation, however, medium to long-term drought (greater than 9 months) peri-ods rather than short-term droughts (3 months or less) may critically impact rehabilitation by altering plant communi-ties’ species composition (Mariotte et al., 2013; Ruffault et al., 2013).
Droughts are usually characterised through the use of in-dices, which vary in complexity and data needs. Meteorolog-ical or climatologMeteorolog-ical droughts are the simplest and are based on the characterisation of anomalies in rainfall conditions (Anderegg et al., 2013). For meteorological droughts, stan-dardised drought indices such as the Standardized Precipita-tion Index (SPI), Reconnaissance Drought Index (RDI) and Standardized Precipitation-Evapotranspiration Index (SPEI) provide the means to quantifying the duration and severity, and eventually the frequency or recurrence of drought events (McKee et al., 1993; Tsakiris and Vangelis, 2005; Vicente-Serrano et al., 2010). Although there are numerous compar-ative studies of drought indices in certain climatic regions such as the Mediterranean, (Paulo et al., 2012; Livada and Assimakopoulos, 2007), the Carpathian region (Spinoni et al., 2013), and other arid locations (Peel et al., 2007; Zarch et al., 2011), none of these indices apply universally to any climate region and it is best for land managers to use a range of drought indices at various temporal scales (Heim, 2002; Spinoni et al., 2013). In many parts of the world evapora-tion data are unavailable or incomplete and simple rainfall indices such as SPI are most commonly used. In this study, we compare SPI with RDI at the 3-month timescale and SPI and SPEI at the 12-month timescale to determine the differ-ence between using SPI with more complex indices that in-corporate evaporation in different climatic regions.
[image:2.612.48.286.60.340.2]frequency of occurrence of rainfall and drought events. The recurrence interval is defined as the average inter-occurrence time of any geophysical phenomena and is calculated with long-term time series data (Loaiciga and Mariño, 1991). Re-currence intervals of rainfall events greater than the aver-age are commonly used by engineers to derive intensity– duration–frequency (IDF) design estimates for building hy-draulic infrastructure such as roofs, culverts, stormwater drains, bridges or water dams (Chebbi et al., 2013; Kuo et al., 2013; Hailegeorgis et al., 2013). IDF design rain-falls are crucial for estimating the risk of hydraulic infras-tructure failure and for maximising infrasinfras-tructure efficien-cies (Smithers et al., 2002). Similar to the concept of IDF design rainfall, which aims to quantify the recurrence in-terval of rainfall events based on their intensity and dura-tion, we apply the same concept to quantify the recurrence intervals of droughts based on their severity and duration, and refer to this as severity–duration–frequency (SDF) de-sign drought. SDF curves have been used to derive drought variables (severity, duration, frequency of occurrence) in dif-ferent climatic regions (Shiau, 2006; Shiau et al., 2012; Lee and Kim, 2012; Todisco et al., 2013; Mirabbasi et al., 2012) but have rarely been used in ecology, and never been used in relation to rehabilitation and restoration. While IDF design rainfalls are a well-established tool in civil engineering and hydrology, we believe SDF design drought could be used in a similar way to assess the risk of ecosystem rehabilitation failure due to droughts.
This approach contrasts current climate classification methods (Table 1) such as the classification of the Australian agricultural environments (Woodhams et al., 2012) or the Australian agro-climatic classes (Hutchinson et al., 2005) that are used for the management of agricultural land (Au-det et al., 2013). These classifications are based on average climatic conditions and may not be adequate for the man-agement of early vegetation re-establishment in post-mining landscapes (Audet et al., 2012, 2013) because of the vulner-ability of vegetation to drought events. Although droughts play a critical role in post-mining land restoration in east-ern Australia, so far methods for quantifying the frequency of drought events have been rarely applied to assess the risk of failure of ecosystem rehabilitation. In the perspective of mined land rehabilitation, specific metrics of site climate or seasonality are surprisingly rare (Audet et al., 2013).
The objective of our study is to quantify the severity, du-ration, and frequency (SDF) of short-term and long-term drought events at selected locations across a broad range of agro-climatic environments in eastern Australia (Table 1, Fig. 1). Eastern Australia makes a very good case study for this kind of research as there are a wide range of climates in which data has been gathered using a consistent method by one agency. While other studies assessed the SDF character-istics at locations with the same climate in Iran (Shiau and Modarres, 2009; Shiau et al., 2012), no such investigations
are known for any climatic region in Australia, for the same climate or different climates.
We characterised droughts using the RDI and SPEI for 3-and 12-month timescales respectively, 3-and compared these indices with the SPI at the same timescales. We then linked the univariate distributions of severity and duration calcu-lated with the drought indices to form bivariate distribution functions and estimated the recurrence intervals of droughts. Please note that since the estimated recurrence intervals are based on historic rainfall and evaporation data, our results are descriptive rather than predictive. Nevertheless, our findings are crucial to discuss the potential of design droughts to be applied as a management tool to overcome the challenges of early vegetation establishment and long-term ecosystem re-silience in post-mining landscapes. This is because frequency patterns of drought events are ignored in any current rehabil-itation guidelines and industry plans, where long-term aver-age rainfall is the only parameter upon which manaver-agement decisions are based on (Audet et al.,2013).
2 Materials and methods
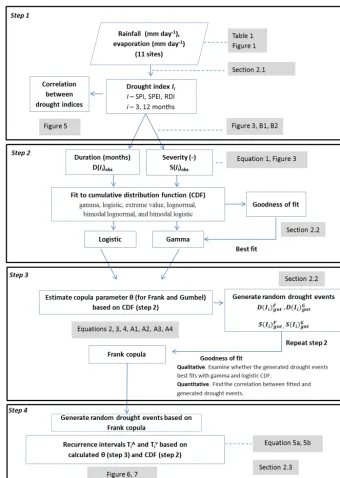
Estimating SDF curves involves uncertainties associated with the length of the observed rainfall data, the applied drought index, the probability distribution functions used to fit the observed severity and duration, and the estimated cop-ula parameter (Hu et al., 2014). To overcome these uncer-tainties we tested the applicability of drought indices for lo-cations in different climatic regions by calculating the corre-lation of three selected drought indices. Likewise, we used the best fitted probability distribution functions and copula for each site. A flow chart of the processing steps is depicted in a schematic diagram (Fig. 2).
We selected 11 sites, for which historical observations of monthly rainfall and evaporation (ranging from 30–60 years) (Table 1) were most comprehensive (more than 97 % cov-erage) (i.e. longest and most complete – more than 97 % coverage) across eastern Australia (Bureau of Meteorology, 2013). The selected locations covered a broad range of cli-mate classes and environments across eastern Australia (Ta-ble 1, Fig. 1).
D. Halwatura et al.: Drought severity–duration–frequency curves 1073
Figure 2. Schematic diagram of steps applied to estimate recurrence intervals of drought events. See Sect. 2 for further details. Step 1:
calculate drought index based on monthly rainfall (SPI) and evaporation (RDI, SPEI). Step 2: fit cumulative distribution function (CDF) to estimated drought duration and severity. Step 3: estimate copula parameter based on CDFs. Step 4: calculate recurrence intervals based on CDFs of univariate (severity, duration) distributions and bivariate joint distribution (copula).
The drought indices are calculated using monthly values of rainfall and/or potential evaporation. Amongst the two in-dices which incorporate potential evaporation, the RDI plays a strong role in detecting maximum drought severities at the medium timescale (3 to 6 months) (Banimahd and Khalili, 2013), while the SPEI plays a strong role in detecting an-nual drought events by identifying the hydrological summer
drought events (Egidijus et al., 2013). There is evidence that SPI overestimates small rainfall scarcity even if excessive rainfall occurs just before the period of interest (Kim et al., 2009). Also for humid climates, there is a good correspon-dence between the computed SPI3and RDI3(Khalili et al.,
in the Carpathian region SPI, SPEI, and RDI are highly com-parable over annual periods (Spinoni et al., 2013). In arid re-gions, the correlation of SPI and RDI is more considerable at the 3-, 6-, and 9-monthly timescale (Peel et al., 2007; Zarch et al., 2011).
2.1 Step 1: calculate drought indices
The SPI is derived by fitting a probability distribution to the rainfall record and then transforming that to a normal distri-bution, so that mean and standard deviation of the SPI are zero and one. Positive or negative values of the SPI represent rainfall conditions greater or smaller than average rainfall, respectively (McKee et al., 1993). RDI and SPEI are based on the SPI calculation procedure, except the two indices use the quotient or difference of precipitation and potential evap-oration, respectively (Tsakiris et al., 2007; Vicente-Serrano et al., 2010). Equations for the RDI and SPEI are presented in Appendix A. We applied two correlation coefficients to as-sess the correlations between SPI3and RDI3, and SPI12with
SPEI12 (step 1 in Fig. 2): Kendall’sτ to assess the number
of concordances and discordances in paired variables (RDI3
and SPI3, SPEI12and SPI12), and Pearson’srto measure
lin-ear correlation.
2.2 Step 2: bivariate distribution of drought severity and duration
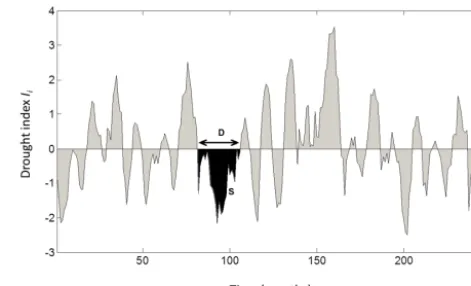
For each location, we used the estimated drought indices (SPI, RDI, SPEI), hereafter collectively referred to as I, to quantify duration D and severity S (McKee et al., 1993; Vicente-Serrano et al., 2010; Tsakiris and Vangelis, 2005). The duration of any drought was defined as the period of rain-fall deficit, i.e. the cumulative time of negativeI values pre-ceded and followed by positiveIvalues (Fig. 3). The severity of any drought period starting at the ith month was defined as
S= D X
i=1
|−Ii|. (1)
We fitted the time series ofDandSto a range of cumulative distribution functions (gamma, logistic, extreme value, log-normal, bimodal loglog-normal, and exponential) and used the function with the best fit for further investigations (step 2 in Fig. 2). The coefficient of determination and 95 % confidence levels were calculated for each distribution in order to select the best distribution.
2.3 Step 3: estimate copula parameter
[image:6.612.309.545.67.210.2]We used copulas to link the univariate probability distribu-tions ofDandSto construct a bivariate joint distribution of D andS (Shiau and Modarres, 2009; Sklar, 1959) (step 3 in Fig. 2). As the choice of copula can be very different from one climate region to another (Khedun et al., 2013) the
Figure 3. Concept of severitySand durationDof a drought event
quantified with drought indexIi, whereirefers to any timescale of interest.
present study focused on the Frank and Gumbel copulas (Ap-pendix B), as they perform best when analysing the bivariate drought dependence structure of drought variables such as severity and duration (Ganguli and Reddy, 2012; Reddy and Ganguli, 2012; Shiau, 2006; Lee et al., 2013; Wong et al., 2010; Zhang et al., 2011). The conditional cumulative dis-tribution functionFS|D(s|d) which relates to the joint
cumu-lative distribution function (JCDF) of drought severity and durationFS,D(s, d)and the cumulative distribution function
(CDF) of drought durationFD(d)is given by the following
relationship (Shiau and Modarres, 2009): FS|D(s|d)=
∂FS,D(s, d)
∂FD(d)
, (2)
whereFD(d)is the CDF of drought duration, andFS,D(s, d)
is the JCDF of drought severity and drought duration. The JCDF of drought severity and duration in terms of copulas is a function of univariate CDFs of duration and severity: FS,D(s, d)=C (FS(s), FD(d)) , (3)
whereFS(s)andFD(d)are CDFs for drought severity and
duration, respectively, andC is a copula function. The con-ditional distribution functionFS|D(s|d)(Eq. 2) can also be
expressed as a function of the copula (Shiau and Modarres, 2009):
FS|D(s|d)=
∂FS,D(s, d)
∂FD(d)
=∂C (FS(s), FD(d)) ∂FD(d)
=CFS|FD(FS(s)|FD(d)) . (4)
D. Halwatura et al.: Drought severity–duration–frequency curves 1075
Figure 4. Calculated SPEI12 (upper row panels) and RDI3(lower row panels) for Weipa, Sydney and Quilpie including major weather
events. The same indices are depicted for all other selected locations in Appendix B.
2.4 Step 4: derive recurrence intervals
We used the estimated copula parameters to generate ran-dom drought events. Severity and duration of the generated random droughts were then fitted to cumulative distribution functions in the same manner as in step 2 (Fig. 2, step 3) to test which estimated copula parameters result in a distri-bution that best fit the generated random drought variables. The estimated copula parameters were also assessed quan-titatively through calculating the correlation between gener-ated random drought events and the estimgener-ated gamma (S) and logistic (D) cumulative distribution functions.
The generated random numbers were then used to cal-culate the recurrence intervals. Recurrence intervals of bi-variate drought events is a standard metric for hydrologi-cal frequency analysis (Yoo et al., 2013; Hailegeorgis et al., 2013) and water resources management (Shiau and Modar-res, 2009; Mishra and Singh, 2010). For each location, we calculated the recurrence interval of drought events exceed-ing any severity or duration of interest, denoted by the logical operator “∨”:
TI∨= 1
P (S≥s∨D≥d)=
1
1−C[FS(s), FD(d)]
, (5a) whereI is one of the drought indices of interest, i.e. the 12-monthly SPEI12 or SPI12, or the 3-monthly RDI3 or SPI3.
Alternatively, the recurrence interval of drought events ex-ceeding any severity and duration of interest, denoted by the logical operator “∧”, was calculated as
TI∧= 1
P (S≥s∧D≥d)
= 1
1−FS(s)−FD(d)+C[FS(s), FD(d)]
. (5b)
For the sake of simplicity, we only present and discussTI∨, whereasTI∧is presented in Appendix D.
3 Results
For both indices, RDI and SPEI, and all selected sites, the gamma and logistic distributions fitted best to the observed drought severity and duration, respectively (R2>0.98 for both variables,p <0.05) (Appendix F). Likewise, the same distributions fitted best to the drought severity and duration of the generated drought events based on the Frank rather than the Gumbel copula (R2>0.90,p <0.05) (Appendix F). Based on the drought indices RDI3 and SPEI12 we
de-tected distinct drought patterns across the selected sites at short and long-term scales, respectively. As an example of differences between tropical, temperate and arid rainfall con-ditions, Fig. 4 depicts calculated time series of RDI3 and
SPEI12for Weipa, Sydney and Quilpie, respectively (see
Ap-pendix C for rest of the sites).
vari-Table 2. Mean severityµSand durationµDof selected locations across eastern Australia, and corresponding coefficient of variation CVS
and CVDfor short-term (RDI3) and long-term (SPEI12) droughts.
Location RDI3 SPEI12
µS CVS µD CVD µS CVS µD CVD
Weipa 5.2 0.2 5.8 0.1 8.4 1.1 10.4 0.8
Cairns 4.7 0.4 6.4 0.3 9.6 1.3 12.5 1.0
Brisbane 3.1 3.3 3.6 0.8 11.2 0.9 13.3 0.8
Sydney 3.4 0.9 4.4 0.6 6.5 1.7 8.9 0.9
Melbourne 4.5 0.7 5.8 0.5 14.5 1.9 18.6 1.6
Kingaroy 2.8 1.2 3.7 0.8 7.0 1.1 8.3 0.8
Brigalow Research Station 3.4 1.0 4.4 0.9 8.0 1.3 10.2 1.0
Wagga Wagga 5.2 0.8 6.2 0.6 8.6 1.8 13.8 1.1
Bourke 2.8 3.9 3.9 1.1 8.2 2.0 9.9 1.5
Quilpie 3.5 1.1 4.6 0.7 18.8 2.1 21.8 1.5
Mount Isa 3.8 0.7 4.9 0.5 11.1 1.2 14.4 0.9
ation in severity was detected in arid Bourke and temperate Brisbane (Table 1).
Long-term droughts were most severe and prolonged in arid Quilpie (Table 2) and rare in temperate Melbourne. Like-wise, severity and duration varied most at the two locations, together with arid Bourke. While severity and duration were moderately high in arid Mount Isa and temperate Brisbane, both parameters were low across the other selected temperate and tropical locations (Table 2).
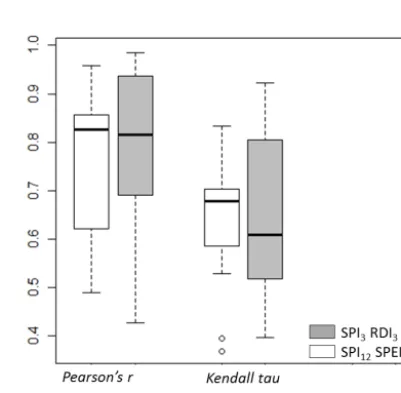
No significant differences were detected (p <0.05 at 95 % confidence level) between RDI3and SPI3, and SPEI12
and SPI12 (Fig. 5 and Appendix E). Correlation between
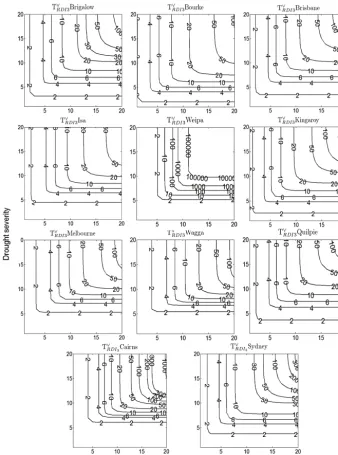
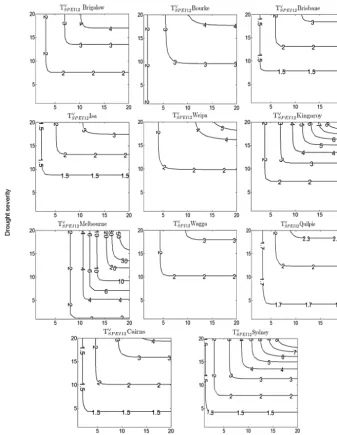
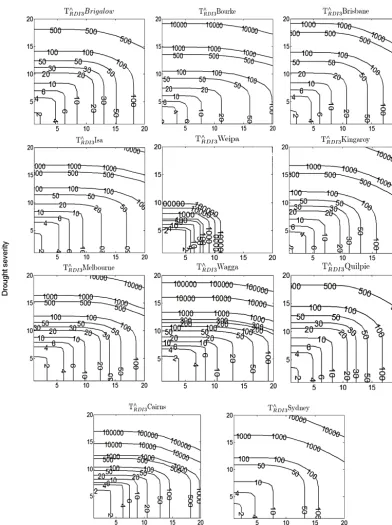
RDI/SPEI and SPI was greatest for tropical Cairns and Weipa, and lowest for arid Bourke and Quilpie (outliers in Fig. 5). Interestingly, although Mount Isa was the most arid location (R/PET=0.13, Table 1), the correlations between drought indices were relatively strong with values of 0.903 (Pearson’sr) and 0.759 (Kendall’sτ) for long-term droughts. For each location, the recurrence intervals of drought events exceeding any severity or duration of interest are de-picted in Fig. 6 for short-term droughts (based on RDI3)
and Fig. 7 for long-term droughts (based on SPEI12).
Short-term droughts recurred most frequently in arid Mount Isa and were relatively rare in tropical Weipa and Cairns, and tem-perate Sydney. For example, in Mount Isa a drought with severity of 14 or duration of 17 months1 recurred once in 50 years, whereas the same drought recurred only once in 100 000 years in Weipa, 300 years in Cairns, and 100 years in Sydney (Fig. 6). Long-term droughts recurred most fre-quently in arid Quilpie, where droughts with severity of 18 or duration of 10 months recurred once in 2 years. In Kingaroy and Sydney, the same drought recurred only once in 4 and 5 years, respectively (Fig. 7). Interestingly, although average long-term droughts were very severe and prolonged in
Mel-1Drought events are calculated by 3-month (short-term) and
[image:8.612.289.527.96.474.2]12-month (long-term) running precipitation totals (Guttman, 1999).
Figure 5. Correlation between SPI3 and RDI3, and SPI12 and
SPEI12 based on the correlation coefficient Pearson’s r and
Kendall’sτ. The outliers represent the very dry locations of Bourke and Quilpie.
bourne (Table 2), they only recurred once in 30 to 50 years. We found similar qualitative patterns in all locations for re-currence intervals of droughts exceeding any severity and du-ration of interest (Appendix D).
4 Discussion
[image:8.612.127.473.96.257.2] [image:8.612.325.526.274.471.2]D. Halwatura et al.: Drought severity–duration–frequency curves 1077
Figure 6. Recurrence intervalT∨(years) of drought events of any severity or duration of interest based on the RDI3(short-term) of historical
rainfall.
locations (e.g. Quilpie, Bourke, Wagga Wagga). Extending a former study on abiotic boundaries affecting ecological de-velopment of post-mining landscapes (Audet et al., 2013), our findings have critical implications for assessments of re-habilitation success.
4.1 Implications for ecosystem rehabilitation planning Across eastern Australia, current post-mining land rehabil-itation strategies often do not incorporate site-specific fall and drought metrics other than the average annual rain-fall depth (Audet et al., 2013). However, regionally extreme
Figure 7. Recurrence intervalT∨(years) of drought events of any severity or duration of interest based on SPEI12(long-term) of historical
rainfall.
for determining site sensitivity, while regular rainfall and rel-atively short periods of water deficit are common character-istics of favourable climate conditions. Based on their find-ings, Audet et al. (2013) revealed how broad scale rainfall patterns outline climate boundaries that drive rehabilitation sensitivity in arid to temperate locations across eastern Aus-tralia. For example, ecosystem rehabilitation in arid regions (Mount Isa, Quilpie, and Bourke) is sensitive to climate as they have highly variable climates (long spell of droughts and high intensity rainfall), which affect the success of re-habilitation.
Commonly, the characterisation of climatic conditions is based on long-term rainfall and does not consider short and
long-term drought conditions. Identifying drought and its variables are critical factors in ecosystem rehabilitation be-cause the distribution and health of plant species are vulner-able to droughts and plant availvulner-able water (Engelbrecht et al., 2007). In our study we presented two hydrological pa-rameters describing the average recurrence intervals of short-term and long-short-term droughts (Figs. 6 and 7 and Appendix D), which can be used instead of the oversimplified parameters of the median period without rain and standard deviation nor-mally used (Audet et al., 2013).
(Hailege-D. Halwatura et al.: Drought severity–duration–frequency curves 1079
Table 3. Management actions for addressing specific kinds of drought characteristics identified with SDF curves for the southern hemisphere.
Management Management actions Type of
domain drought
Plant species Drought tolerant species LS, LP, SP, SS
selection Quickly germinating species SS
Species with physical/chemical dormancy LS, LP Shade tolerant species on southern aspects LS, LP Light tolerant species on northern aspects LS, LP, SP, SS
Annual grasses SS, SP
Perennial grasses LS, LP, SP, SS
Trees LS, LP
Planting/seeding Trees require repeated establishment LS, LP regime Annual/perennial grasses are successful after rain events SS, SP
Soil characteristics Deep topsoil LS, LP, SP
Amendments of silt/clay LS, LP
Gentle slopes LS, LP
Mulching SS
Irrigation method Regular irrigation LS, LP
Seasonal irrigation SS, SP
Critical stage irrigation LS, LP, SP, SS
Drainage system LS, LP
SS – high recurrence of short term (3 months) severe droughts; SP – high recurrence of short term (3 months) prolonged droughts; LS – high recurrence of long term (12 months) severe droughts; LP – high recurrence of long term (12 months) prolonged droughts.
orgis et al., 2013; Chebbi et al., 2013). Our new term “de-sign droughts”, characterised by drought severity–duration– frequency (SDF), is based on the severity of droughts (cu-mulative negative values of a particular drought; see Fig. 3) as opposed to IDF, which is based on the intensity of the rainfall. Design droughts allow for drought severity, dura-tion and frequency to be considered in order to determine the risk of failure of current mining operations (Mason et al., 2013; Burton et al., 2012), and to design robust ecosys-tem components in the face of the local climate variability (Audet et al., 2013). Unlike degraded land (in the sense of gradual loss of ecosystem productivity) in post-mining land-scapes, most ecosystem components are impacted by min-ing activities; particularly landform, hydrology, and ecosys-tem structure (Arnold et al., 2014b). Therefore, successful rehabilitation of post-mining land requires the sensible se-lection of plant species, as well as planting/seeding regime, soil characteristics, irrigation method, and landform charac-teristics (Table 3). For example, same vegetation types can-not establish if a drought event exceeds values of specific duration or severity (Arnold et al., 2014a). The recurrence intervals can provide the probability of a drought occurring at this duration or severity, and thus the risk of establishment failure can be assessed. This is important for rehabilitation managers who can conduct a cost–benefit analysis to decide whether the costs of constructing mitigation methods (such as irrigation) are comparable with the costs of potential fail-ure of multiple revegetation attempts.
Together, design rainfalls (IDF) and droughts (SDF) should be the primary determinants of rehabilitation strate-gies and eventually help guide rehabilitation planning, where environmental conditions have an impact on current min-ing operations. In accordance with IDF parameters of sim-ilar locations across eastern Australia (Audet et al., 2013), temperate and tropical environmental conditions (Table 1) are favourable for rehabilitation, i.e. recurrence intervals of droughts are large (Figs. 6 and 7 and Appendix D). By contrast, re-establishment of ecosystems are prone to fail-ure in arid conditions, where droughts recur more frequently (i.e. low recurrence intervals).
At locations with distinct patterns of winter and summer rainfall, such as Weipa, Cairns, Mount Isa, or the Brigalow Belt, seasonality is the primary determinant of drought oc-currence (Table 1). The short-term drought index (RDI3)
de-tects most severe and prolonged droughts in tropical Weipa and Cairns (Table 2), where rainfall is low in winter and high in summer. Annually recurring seasonal patterns also explain the low variability of short-term drought severity and dura-tion. In contrast the long-term drought index (SPEI12)
de-tects most severe and prolonged droughts in arid Quilpie and Mount Isa, as well as temperate Melbourne (Table 2). Ma-jor weather events such as El Niño and La Niña from recent decades coincided with low and high drought indices, respec-tively (Fig. 4 and Appendix C).
or RDI (both based on rainfall and evaporation data). This might be of interest for many parts of the world, where evap-oration data are unavailable or incomplete and therefore sim-ple rainfall indices are most commonly used. Our analysis revealed that Pearson’s rand Kendall’sτ correlations were strong across selected locations (Fig. 5 and Appendix E), in-dicating the potential of the simple SPI to serve as a sur-rogate for the more complex RDI and SPEI. For temperate and tropical environments, such as Cairns, Weipa, or Bris-bane, the more complex RDI and SPEI can be replaced by the simple SPI if evaporation data is not available (Fig. 5 and Appendix E). By contrast, in arid Bourke, Quilpie, or Mount Isa, correlations between SPI and the more complex indices were weaker, because evaporation plays a critical role in arid climates rather than in tropics and temperate regions. In these arid and water-limited locations (Table 1) we recommend us-ing SPEI and RDI2and also to conduct intensive monitoring of ecosystem development in relation to empirical weather data to measure evaporation directly, e.g. pan evaporation (Lugato et al., 2013; Clark, 2013), or indirectly, e.g. based on radiative and aerodynamic variables (Allen et al., 1998). 4.2 SDF curves as an early risk assessment tool
Risk assessment based on the design rainfall concept is com-monly used as a standard tool by engineers to design infras-tructure such as storm water drains, flood mitigation levees, or retarding dams (Chebbi et al., 2013; Hailegeorgis et al., 2013). This research paper aims to demonstrate how these concepts can be used for ecosystem rehabilitation, provid-ing a quantitative estimate of ecosystem rehabilitation failure due to water deficit. Traditionally, ecologist and land man-agers often use the mean annual rainfall as a co-classifier of biogeographic regionalisation. However, annual rainfall alone cannot account for the vulnerability of a site to non-disruptive water supply, the frequency of water limitations, and seasonality (Audet et al., 2013). For example, although mean annual rainfall is lowest in Bourke, the SDF analysis reveals that severe and prolonged droughts occur most fre-quently in Mount Isa. This is because in Mount Isa on av-erage 23 out of 100 days are with no rainfall, as most of the rainfall occurs in summer as storm events greater than 100 mm (Table 1) (Bureau of Meteorology, 2013). Ecosys-tem rehabilitation may fail if management actions are based only on the annual rainfall without considering the nature of drought events (i.e. the rate of recurrence of prolonged and severe droughts) (Table 3).
Quantitatively, risk is the product of the probability of an event occurring and the consequences of an event on as-sets (Athearn, 1971). In the context of post-mining land re-habilitation, the recurrence intervals quantify the
probabil-2Note that the definition and quantification of drought are
nor-mative. In this regard, our results indicate under what climatic con-ditions SPEI and RDI can be replaced by SPI, rather than which index is the best one for each location.
ity of occurrence of drought events. If the consequences of drought events for ecosystems are known (Wilhite et al., 2007; Williamson et al., 2000) the risk of ecosystem rehabil-itation failure can be quantified. Consequences will typically have to be determined in relation to site specific attributes such as plant species, soil, irrigation, etc. (Table 3). Likewise, the consequences can also be related to the costs of rehabili-tation. For example, for frequently recurring droughts of high severity and duration, irrigation may be a cost-efficient al-ternative to repeatedly replanting at a rehabilitation site due to establishment failure. These consequences in relation to severity and duration may be identified from the literature, field trials or be derived from expert opinion. A key aspect of our study is that SDF curves provide the probability of occur-rence of drought events with a specific duration and severity. 4.3 Application of design droughts to rehabilitation
planning
One of the major outcomes of this study is to support land managers and/or rehabilitation practitioners to make funda-mental decisions on appropriate management actions in the context of drought frequency. For rehabilitation to be suc-cessful in the face of severe and prolonged droughts, there are a range of management domains and management ac-tions that need to be considered in response to recurrence intervals, drought severity, and drought duration (Table 3). These management actions can be categorised into four do-mains: plant species selection; planting/seeding regime; soil characteristics; and irrigation method.
Meteorological droughts indicate deviations of rainfall and/or evaporation relative to the long-term average. Native climax vegetation, which is well adapted to the local climate, is hardly sensitive to these anomalies. However, within the process of post-mining land rehabilitation, establishment of well-adapted climax vegetation is impossible. In fact, post-mining ecosystem rehabilitation is very sensitive to decisions made on the re-established topography and soil characteris-tics, as well as planting/seeding regimes and irrigation meth-ods (Table 3). In this regard, the frequency of meteorological droughts relative to long-term conditions is the critical driver of these management decisions. For example, seedling estab-lishment might fail under conditions of frequently occurring short-term droughts, even if the absolute rainfall in between droughts is high. Under these conditions, landform and soil need to be restored so that the periods of water limitation can be minimised.
D. Halwatura et al.: Drought severity–duration–frequency curves 1081 (iii) planting of perennial grasses (Eragrostis spp., Themeda
spp.; Bolger et al., 2005), which may not be affected by long-term water deficits. At locations with frequently recurring long-term (12-monthly timescale) droughts of high sever-ity and durations (LS, LP in Table 3), e.g. in Mount Isa and Quilpie, seeding of species with physical/chemical dor-mancy may increase the probability of germination during favourable periods (Hilhorst, 1995; Arnold et al., 2014b). Additionally, a southern aspect may require drought toler-ant species to increase survival of pltoler-ant communities (Stern-berg and Shoshany, 2001). However, these species need to be shade tolerant as southern aspects get less solar radiation in winter. At locations with frequently recurring short-term (3-monthly timescale) droughts of high severity but short dura-tion, with rainfall throughout the year (SS in Table 3), e.g. in Wagga Wagga, annual grasses and seeds with short germina-tion periods may be suitable.
Soil characteristics play a critical role for plant available water and a number of strategies may need to be employed to make soil more favourable to plant establishment. Except for mulching, all soil management actions can be applied to locations with high recurrence of long-term, severe, and prolonged droughts (LS, LP in Table 3), e.g. in Quilpie and Mount Isa. For locations with high recurrence of short-term, and prolonged droughts (SP in Table 3), such as Melbourne, increasing depth of topsoil can increase water holding capac-ity (Audet et al., 2013; Bot and Benites, 2005). Similarly, by mixing silt and clay soil in the topsoil and reducing slope gra-dients may facilitate infiltration and increase soil water reten-tion capacity (Audet et al., 2013). For tropical locareten-tions with high recurrence of short-term (3-monthly timescale), severe, and prolonged droughts (SS, SP in Table 3), e.g. in Cairns and Weipa, ground cover such as mulch and fast growing vegetation cover (e.g. Buffel grass) may reduce evaporation and maintain soil moisture to facilitate the establishment of drought sensitive and slow growing species (Blum, 1996).
Utilising irrigation methods for specific site characteristics is a cost-effective strategy for any rehabilitation plan. Regu-lar irrigation with proper drainage systems that distributes water is an effective strategy in locations with high recur-rence of long-term, severe, and prolonged droughts (LP, LS in Table 3). For locations with high recurrence of short-term, severe, and prolonged droughts (SS, SP in Table 3), with sea-sonal rainfall (e.g. Brisbane, Sydney, Kingaroy, Brigalow), seasonal irrigation and irrigation at critical stages of plant growth (Blum, 1996), such as during periods of germination, and root or pod development periods are efficient actions to ensure plant survival throughout drought spells.
4.4 Future research
The method outlined in this study provides a useful tool for land managers to address site-based climatic conditions. Future research needs to build on this tool, as well as ad-dress the limitations of our method based on
meteorologi-cal drought indices inferred from point observations. This research may assess: (i) the relationship between meteoro-logical and agricultural drought indices; (ii) regional scale mapping of drought indices; and (iii) the predictive power of design droughts.
While the applied drought indices are robust indicators of meteorological droughts (Mishra and Singh, 2010; Quiring, 2009), they are limited to detecting anomalies from historic rainfall patterns. Soil plays a critical role for any ecosystem development, particularly with regard to ecosystem rehabili-tation in post-mining land (Arnold et al., 2013), as soil prop-erties translate rainfall into plant available water (Zhang et al., 2001; Huang et al., 2013). Future drought analysis would benefit from integrating soil properties such as depth, texture, salinity, or organic matter content into drought indices to de-scribe agricultural droughts (Khare et al., 2013; Baldocchi et al., 2004; Woli et al., 2012). Soil texture and depth are critical factors in highly seasonal climates, where soil water storage overcomes periods of water deficit (Prentice et al., 1992; Bot and Benites, 2005). However, using simple and easily acces-sible meteorological data is a critical step forward to making it easier for mine rehabilitation managers to adopt the con-cept of using SDF curves as early risk assessment tools.
Although the selected locations can be considered repre-sentative of the agro-climatic environments across eastern Australia (Fig. 1), our analysis is strictly valid for the selected point data and therefore site-specific. Future work should not only integrate the above-mentioned soil component but also extend drought analyses across Australia using gridded weather data from the Bureau of Meteorology (2014). Fu-ture investigations could assess possible trends in temporal changes of recurrence intervals by dividing historic time se-ries of rainfall and evaporation into subsets and replicate the analysis for each subset (Li et al., 2014; Darshana et al., 2013; Jacobs et al., 2013; Halwatura et al., 2015).
5 Conclusions
Appendix A: RDI and SPEI A1 RDI
The standardised RDIstis given as
RDIst(k)=
yk−yk ˆ σk
, (A1)
with
yk=ln j=k
P
j=1
Pj
j=k P
j=1
PETj
(A2)
whereσˆ is the standard deviation,yk is monthkof yeary, yk is the arithmetic mean ofyk,σˆk is the standard deviation ofyk, andPj and PETjare precipitation and potential evap-otranspiration for thejth month of the hydrological year, re-spectively (Tsakiris and Vangelis, 2005).
A2 SPEI
The SPEI is calculated as
SPEI=W− C0+C1W+C2W 2
1+d1W+d2W2+d3W3
(A3) with
W =p−2 ln(P )forP ≤0.5, (A4)
whereP is the probability of exceeding a determined value of the difference between the precipitation and potential evapotranspiration (P=1−F (x)). If P >0.5, then P is replaced by 1−P and the sign of the resultant SPEI is reversed. The constants areC0=2.515517,C1=0.802853,
C2=0.010328, d1=1.432788, d2=0.189269, and
d3=0.001308 (Vicente-Serrano et al., 2010).
Appendix B: Mathematical description of Gumbel and Frank copula (Shiau, 2006)
B1 Gumbel copula
C(u, v)=exp
−(−lnu)θ+(−lnv)θ
1 θ
, θ≥1 (B1)
c(u, v)=C(u, v)
(−1 lnu)θ(−lnv)θ−1 uv
(−1 lnu)θ(−lnv)θ2θ−2
·
(θ−1)(−lnu)θ+(−lnv)θ− 1 θ +1
(B2) B2 Frank copula
C(u, v)= −1 θln
"
1+ e
−θ u−1
e−θ v−1 e−θ−1
#
, θ6=0 (B3)
c(u, v)= − θ e
−θ (u+v) e−θ−1
D. Halwatura et al.: Drought severity–duration–frequency curves 1083 Appendix C: Time series of drought indices and major
[image:15.612.71.523.113.336.2]weather event
Figure C1. Calculated SPEI12for selected locations across eastern Australia.
[image:15.612.71.527.388.623.2]Appendix D: Recurrence intervals of drought events with any severity and duration of interest
Figure D1. Recurrence intervalsT∧(years) of drought events with any severity and duration of interest based on RDI3(short-term) of
D. Halwatura et al.: Drought severity–duration–frequency curves 1085
Figure D2. Recurrence intervalsT∧(years) of drought events with any severity and duration of interest based on SPEI12 (long-term) of
Appendix E: Coefficient values of Pearson’srand Kendall’sτfor SPI3vs. RDI3, and SPI12vs. SPEI12
Table E1. Coefficient values of Pearson’sr and Kendall’sτ for SPI3vs. RDI3, and SPI12 vs. SPEI12. Correlations were lowest for arid
Bourke and Quilpie (bold values).
Location SPI3vs. RDI3 SPI12vs. SPEI12
Pearson’sr Kendall’sτ Pearson’sr Kendall’sτ
Weipa 0.98 0.92 0.83 0.68
Cairns 0.98 0.90 0.96 0.83
Brisbane 0.81 0.62 0.68 0.68
Sydney 0.82 0.61 0.90 0.71
Melbourne 0.98 0.90 0.82 0.70
Kingaroy 0.77 0.54 0.87 0.68
Brigalow 0.90 0.71 0.83 0.64
Wagga Wagga 0.69 0.68 0.84 0.71
Bourke 0.43 0.54 0.51 0.53
Quilpie 0.57 0.40 0.49 0.40
D. Halwatura et al.: Drought severity–duration–frequency curves 1087 Appendix F: R2andpvalues for fitted cumulative
[image:19.612.49.545.135.294.2]distribution functions and Copula parameters
Table F1.R2andpvalues for fitted cumulative distribution functions and Copula parameters for the studied sites.
Station Cumulative distribution functions Copula
Exponential Logistic Lognormal Bimodal Gamma Extreme value Gumbel Frank
lognormal
R2 p R2 p R2 p R2 p R2 p R2 p R2 p R2 p
Weipa 0.24 0.00 0.99 0.00 0.00 0.31 0.00 0.57 0.99 0.00 0.60 0.00 0.97 0.00 1.00 0.00
Cairns 0.00 0.20 1.00 0.00 0.00 0.52 0.00 0.68 1.00 0.00 0.53 0.00 0.98 0.00 0.99 0.00
Brisbane 0.00 0.30 1.00 0.00 0.00 0.61 0.00 0.61 0.98 0.00 0.57 0.00 0.96 0.00 0.98 0.00
Sydney 0.31 0.00 0.99 0.00 0.00 0.64 0.00 0.52 1.00 0.00 0.55 0.00 0.97 0.00 1.00 0.00
Melbourne 0.25 0.00 0.99 0.00 0.00 0.63 0.00 0.64 0.99 0.00 0.42 0.00 0.96 0.00 1.00 0.00
Kingaroy 0.00 0.08 1.00 0.00 0.00 0.42 0.00 0.43 0.99 0.00 0.68 0.00 0.98 0.00 0.99 0.00
Brigalow 0.00 0.06 0.96 0.00 0.00 0.64 0.00 0.26 0.99 0.00 0.62 0.00 0.96 0.00 1.00 0.00
Wagga Wagga 0.00 0.15 0.96 0.00 0.00 0.61 0.00 0.54 0.91 0.00 0.43 0.00 0.97 0.00 1.00 0.00
Bourke 0.00 0.21 0.94 0.00 0.00 0.31 0.00 0.34 0.98 0.00 0.62 0.00 0.95 0.00 1.00 0.00
Quilpie 0.12 0.00 0.98 0.00 0.00 0.15 0.00 0.29 0.99 0.00 0.53 0.00 0.96 0.00 0.99 0.00
Acknowledgements. This study was made possible by the Uni-versity of Queensland Post-doctoral Fellowship scheme and Early Career Research Grant awarded to S. Arnold, as well as the International Postgraduate Research Scholarship awarded to D. Halwatura. We thank Tanja Giebner for her dedicated work on deriving the RDI for selected locations. Further, we thank David Doley and Patrick Audet for critical discussions and seven anonymous reviewers for their constructive comments.
Edited by: N. Ursino
References
Allen, R. G., Pereira, L. S., Raes, D., and Smith, M.: Crop evapotranspiration-Guidelines for computing crop water requirements-FAO Irrigation and drainage paper 56, FAO, Rome, Italy, 300 pp., 1998.
Anderegg, L. D., Anderegg, W. R., and Berry, J. A.: Not all droughts are created equal: translating meteorological drought into woody plant mortality, Tree Physiol., 33, 672–683, 2013.
Arnold, S. , Audet, P. , Doley, D., and Baumgartl, T.: Hydropedol-ogy and EcohydrolHydropedol-ogy of the Brigalow Belt, Australia: Oppor-tunities for Ecosystem Rehabilitation in Semiarid Environments, Gsvadzone, 12, doi:10.2136/vzj2013.03.0052, 2013.
Arnold, S., Kailichova, Y., and Baumgartl, T.: Germination of Aca-cia harpophylla (Brigalow) seeds in relation to soil water po-tential: implications for rehabilitation of a threatened ecosystem, Peer J., 2, e268, doi:10.7717/peerj.268, 2014a.
Arnold, S. , Kailichova, Y. , Knauer, J. , Ruthsatz, A. D., and Baum-gartl, T.: Effects of soil water potential on germination of co-dominant Brigalow species: Implications for rehabilitation of water-limited ecosystems in the Brigalow Belt bioregion, Ecol. Eng., 70, 35–42, doi:10.1016/j.ecoleng.2014.04.015, 2014b. Athearn, J. L.: What is Risk?, J. Risk Insur., 38, 639–645,
doi:10.2307/251578, 1971.
Audet, P., Arnold, S., Lechner, A. M., Mulligan, D. R., and Baum-gartl, T.: Climate suitability estimates offer insight into fun-damental revegetation challenges among post-mining rehabili-tated landscapes in eastern Australia, Biogeosciences Discuss., 9, 18545–18569, doi:10.5194/bgd-9-18545-2012, 2012. Audet, P., Arnold, S., Lechner, A. M., and Baumgartl, T.:
Site-specific climate analysis elucidates revegetation challenges for post-mining landscapes in eastern Australia, Biogeosciences, 10, 6545–6557, doi:10.5194/bg-10-6545-2013, 2013.
Baldocchi, D. D. , Xu, L., and Kiang, N.: How plant functional-type, weather, seasonal drought, and soil physical proper-ties alter water and energy fluxes of an oak–grass savanna and an annual grassland, Agr. Forest Meteorol., 123, 13–39, doi:10.1016/j.agrformet.2003.11.006, 2004.
Banimahd, S. and Khalili, D.: Factors influencing markov chains predictability characteristics, utilizing SPI, RDI, EDI and SPEI drought indices in different climatic zones, Water Resour. Man-age., 27, 3911–3928, doi:10.1007/s11269-013-0387-z, 2013. Bell, L. C.: Establishment of native ecosystems after mining –
Australian experience across diverse biogeographic zones, Ecol. Eng., 17, 179–186, doi:10.1016/S0925-8574(00)00157-9, 2001. Blum, A.: Crop responses to drought and the interpretation of
adap-tation, Plant Growth Regul., 20, 135–148, 1996.
Bolger, T. P., Rivelli, A. R., and Garden, D. L.: Drought resistance of native and introduced perennial grasses of south-eastern Aus-tralia, Aust. J. Agr. Res., 56, 1261–1267, doi:10.1071/AR05075, 2005.
Bot, A. and Benites, J.: The importance of soil organic matter: key to drought-resistant soil and sustained food and production, FAO, Rome, Italy, 2005.
Brouwers, N. , Matusick, G. , Ruthrof, K. , Lyons, T., and Hardy, G.: Landscape-scale assessment of tree crown dieback follow-ing extreme drought and heat in a Mediterranean eucalypt for-est ecosystem, Landscape Ecol., 28, 69–80, doi:10.1007/s10980-012-9815-3, 2013.
Bureau of Meteorology: Climate data, http://www.bom.gov.au/ climate/data/, last access: April 2013.
Bureau of Meteorology: Australian water availability project 2014, http://www.bom.gov.au/jsp/awap/, last access: January 2014. Burton, M., Jasmine Zahedi, S., and White, B.: Public preferences
for timeliness and quality of mine site rehabilitation. The case of bauxite mining in Western Australia, Resources Policy, 37, 1–9, 2012.
Chebbi, A., Bargaoui, Z. K., and da Conceição Cunha, M.: De-velopment of a method of robust rain gauge network op-timization based on intensity-duration-frequency results, Hy-drol. Earth Syst. Sci., 17, 4259–4268, doi:10.5194/hess-17-4259-2013, 2013.
Clark, C.: Measurements of actual and pan evaporation in the upper Brue catchment UK: the first 25 years, Weather, 68, 200–208, doi:10.1002/wea.2090, 2013.
Craven, D., Hall, J. S., Ashton, M. S., and Berlyn, G. P.: Water-use efficiency and whole-plant performance of nine tropical tree species at two sites with contrasting water availability in Panama, Trees-Struct. Funct., 27, 639–653, doi:10.1007/s00468-012-0818-0, 2013.
Darshana, Pandey, A., and Pandey, R. P.: Analysing trends in refer-ence evapotranspiration and weather variables in the Tons River Basin in Central India, Stoch. Environ. Res. Risk Assess., 27, 1407–1421, doi:10.1007/s00477-012-0677-7, 2013.
Doley, D. and Audet, P.: Adopting novel ecosystems as suitable re-habilitation alternatives for former mine sites, Ecol. Process., 2, 1–11, doi:10.1186/2192-1709-2-22, 2013.
Doley, D., Audet, P., and Mulligan, D. R.: Examining the Aus-tralian context for post-mined land rehabilitation: Reconciling a paradigm for the development of natural and novel ecosystems among post-disturbance landscapes, Agr. Ecosyst. Environ., 163, 85–93, doi:10.1016/j.agee.2012.04.022, 2012.
Egidijus, R., Edvinas, S., Vladimir, K., Justas, K., Gintaras, V., and Aliaksandr, P.: Dynamics of meteorological and hydrolog-ical droughts in the Neman river basin, Environ. Res. Lett., 8, 045014, doi:10.1088/1748-9326/8/4/045014, 2013.
Engelbrecht, B. M., Comita, L. S., Condit, R., Kursar, T. A., Tyree, M. T., Turner, B. L., and Hubbell, S. P.: Drought sensitivity shapes species distribution patterns in tropical forests, Nature, 447, 80–82, 2007.
Ganguli, P. and Reddy, M. J.: Risk assessment of droughts in Gu-jarat using bivariate Copulas, Water Resour. Manage., 26, 3301– 3327, 2012.
po-D. Halwatura et al.: Drought severity–duration–frequency curves 1089
litical, historical, and environmental contexts, Restor. Ecol., 15, S3–S10, doi:10.1111/j.1526-100X.2007.00287.x, 2007. Guttman, N. B.: Accepting the Standardized Precipitation Index:
a calculation algorithm, J. Am. Water Resour. Assoc., 35, 311– 322, 1999.
Hailegeorgis, T. T., Thorolfsson, S. T., and Alfredsen, K.: Regional frequency analysis of extreme precipitation with consideration of uncertainties to update IDF curves for the city of Trondheim, J. Hydrol., 498, 305–318, doi:10.1016/j.jhydrol.2013.06.019, 2013.
Halwatura, D., Lechner, A. M., and Arnold, S.: Design droughts: A new planning tool for ecosystem rehabilitation, Int. J. Geomate, 8, 1138–1142, 2015.
Heim, R. R.: A review of twentieth-century drought indices used in the United States, B. Am. Meteorol. Soc., 83, 1149–1165, 2002. Hilhorst, H. W.: A critical update on seed dormancy, I. Primary
dor-mancy, Seed Sci. Res., 5, 61–73, 1995.
Hinz, C., McGrath, G., and Hearman, A.: Towards a climate based risk assessment of land rehabilitation, 1st International Seminar on Mine Closure, Australian Centre for Geomechanics, Perth, 407–416, 2006.
Hodgkinson, J. H., Littleboy, A., Howden, M., Moffat, K., and Loechel, B.: Climate adaptation in the Australian mining and exploration industries, CSIRO Climate Adaptation National Re-search Flagship, 1921605812 – working paper No. 5, http:// www.csiro.au/resources/CAF-working-papers.html (last access: May 2014), 2010.
Hu, Y.-M., Liang, Z.-M., Liu, Y.-W., Wang, J., Yao, L., and Ning, Y.: Uncertainty analysis of SPI calculation and drought assess-ment based on the application of Bootstrap, Int. J. Climatol., doi:10.1002/joc.4091, in press, 2014.
Huang, M., Barbour, S. L., Elshorbagy, A., Zettl, J., and Si, B. C.: Effects of variably layered coarse textured soils on plant available water and forest productivity, in: Four decades of progress in monitoring and modeling of processes in the soil-plant-atmosphere system: Applications and challenges, edited by: Romano, N., Durso, G., Severino, G., Chirico, G. B., and Palladino, M., Procedia Environmental Sciences, Elsevier Sci-ence Bv, Amsterdam, 148–157, 2013.
Hutchinson, M. F., McIntyre, S., Hobbs, R. J., Stein, J. L., Garnett, S., and Kinloch, J.: Integrating a global agro-climatic classifica-tion with bioregional boundaries in Australia, Global Ecol. Bio-geogr., 14, 197–212, 2005.
Jacobs, S. J., Pezza, A. B., Barras, V., Bye, J., and Vihma, T.: An analysis of the meteorological variables leading to appar-ent temperature in Australia: Presappar-ent climate, trends, and global warming simulations, Global Planet. Change, 107, 145–156, doi:10.1016/j.gloplacha.2013.05.009, 2013.
Jahantab, E., Javdani, Z., Bahari, A., Bahrami, S., and Mehrabi, A.: Effect of priming treatments on seed germination percentage and rate in the early stages of triticale plants grown under drought stress conditions, Int. J. Agr. Crop Sci., 5, 1909–1917, 2013. Joe, H.: Multivariate models and dependence concepts,
Chap-man & Hall, London, 1997.
Jongen, M. , Unger, S., Fangueiro, D., Cerasoli, S., Silva, J. M. N., and Pereira, J. S.: Resilience of montado under-storey to experimental precipitation variability fails under se-vere natural drought, Agr. Ecosyst. Environ., 178, 18–30, doi:10.1016/j.agee.2013.06.014, 2013.
Khalili, D., Farnoud, T., Jamshidi, H., Kamgar-Haghighi, A. A., and Zand-Parsa, S.: Comparability analyses of the SPI and RDI me-teorological drought indices in different climatic zones, Water Resour. Manage., 25, 1737–1757, 2011.
Khare, Y. P., Martinez, C. J., and Munoz-Carpena, R.: Parameter variability and drought models: A study using the Agricultural Reference Index for Drought (ARID), Agron. J., 105, 1417– 1432, doi:10.2134/agronj2013.0167, 2013.
Khedun, C. P., Chowdhary, H., Mishra, A. K., Giardino, J. R., and Singh, V. P.: Water Deficit Duration and Severity Analysis Based on Runoff Derived from Noah Land Surface Model, J. Hydrol. Eng., 18, 817–833, 2013.
Kim, D.-W., Byun, H.-R., and Choi, K.-S.: Evaluation, modifica-tion, and application of the Effective Drought Index to 200-Year drought climatology of Seoul, Korea, J. Hydrol., 378, 1–12, doi:10.1016/j.jhydrol.2009.08.021, 2009.
Kuo, C. C., Gan, T. Y., and Chan, S.: Regional Intensity-Duration-Frequency curves derived from Ensemble Empirical Mode De-composition and Scaling Property, J. Hydrol. Eng., 18, 66–74, doi:10.1061/(asce)he.1943-5584.0000612, 2013.
Kuster, T., Arend, M., Bleuler, P., Günthardt-Goerg, M., and Schulin, R.: Water regime and growth of young oak stands sub-jected to air-warming and drought on two different forest soils in a model ecosystem experiment, Plant Biol., 15, 138–147, 2013. Lee, J. H. and Kim, C. J.: A multimodel assessment of
the climate change effect on the drought severity–duration– frequency relationship, Hydrol. Process., 27, 2800–2813, doi:10.1002/hyp.9390, 2012.
Lee, T., Modarres, R., and Ouarda, T. B. M. J.: Data-based analysis of bivariate copula tail dependence for drought duration and severity, Hydrol. Process., 27, 1454–1463, doi:10.1002/Hyp.9233, 2013.
Li, Z., Chen, Y. N., Yang, J., and Wang, Y.: Potential evapotranspi-ration and its attribution over the past 50 years in the arid region of Northwest China, Hydrol. Process., 28, 1025–1031, 2014. Livada, I. and Assimakopoulos, V. D.: Spatial and temporal analysis
of drought in greece using the Standardized Precipitation Index (SPI), Theor. Appl. Climatol., 89, 143–153, doi:10.1007/s00704-005-0227-z, 2007.
Lloret, F.: Vulnerability and resilience of forest ecosystems to ex-treme drought episodes, Ecosistemas, 21, 85–90, 2012. Loaiciga, H. and Mariño, M.: Recurrence interval of
geophys-ical events, J. Water Resour. Plan. Manage., 117, 367–382, doi:10.1061/(ASCE)0733-9496(1991)117:3(367), 1991. Lugato, E., Alberti, G., Gioli, B., Kaplan, J. O., Peressotti,
A., and Miglietta, F.: Long-term pan evaporation observa-tions as a resource to understand the water cycle trend: case studies from Australia, Hydrolog. Sci. J., 58, 1287–1296, doi:10.1080/02626667.2013.813947, 2013.
Mariotte, P., Vandenberghe, C., Kardol, P., Hagedorn, F., and But-tler, A.: Subordinate plant species enhance community resistance against drought in semi-natural grasslands, J. Ecol., 101, 763– 773, doi:10.1111/1365-2745.12064, 2013.
McKee, T. B., Doesken, N. J., and Kleist, J.: The relationship of drought frequency and duration to time scales, Proceedings of the 8th Conference on Applied Climatology, Anaheim, California, 179–183, 1993.
Mirabbasi, R., Fakheri-Far, A., and Dinpashoh, Y.: Bivariate drought frequency analysis using the copula method, Theor. Appl. Climatol., 108, 191–206, 2012.
Mishra, A. K. and Singh, V. P.: A review of drought concepts, J. Hydrol., 391, 202–216, 2010.
Murphy, B. F. and Timbal, B.: A review of recent climate variability and climate change in southeastern Australia, Int. J. Climatol., 28, 859–879, doi:10.1002/joc.1627, 2008.
Myers, N., Mittermeier, R. A., Mittermeier, C. G., Da Fonseca, G. A., and Kent, J.: Biodiversity hotspots for conservation priorities, Nature, 403, 853–858, 2000.
National Drought Mitigation Cente-Interpretation of Stan-dardized Precipitation Index Maps: http://drought.unl.edu/ MonitoringTools/ClimateDivisionSPI/Interpretation.aspx, last access: January 2014.
Nefzaoui, A. and Ben Salem, H.: Cacti: Efficient tool for rangeland rehabilitation, drought mitigation and to combat desertification, in: Proceedings of the Fourth International Congress on Cactus Pear and Cochineal, edited by: Nefzaoui, A. and Inglese, P., Acta Horticulturae, 581, 295–315, 2002.
Paulo, A. A., Rosa, R. D., and Pereira, L. S.: Climate trends and be-haviour of drought indices based on precipitation and evapotran-spiration in Portugal, Nat. Hazards Earth Syst. Sci., 12, 1481– 1491, doi:10.5194/nhess-12-1481-2012, 2012.
Peel, M. C., Finlayson, B. L., and McMahon, T. A.: Updated world map of the Köppen-Geiger climate classification, Hy-drol. Earth Syst. Sci., 11, 1633–1644, doi:10.5194/hess-11-1633-2007, 2007.
Prentice, I. C., Cramer, W., Harrison, S. P., Leemans, R., Monserud, R. A., and Solomon, A. M.: Special Paper: A global biome model based on plant physiology and dominance, soil properties and climate, J. Biogeogr., 19, 117–134, doi:10.2307/2845499, 1992. Quiring, S. M.: Monitoring drought: An evaluation of me-teorological drought indices, Geogr. Compass, 3, 64–88, doi:10.1111/j.1749-8198.2008.00207.x, 2009.
Reddy, M. J. and Ganguli, P.: Application of copulas for derivation of drought severity-duration-frequency curves, Hydrol. Process., 26, 1672–1685, doi:10.1002/hyp.8287, 2012.
Ruffault, J., Martin-StPaul, N., Rambal, S., and Mouillot, F.: Differ-ential regional responses in drought length, intensity and timing to recent climate changes in a Mediterranean forested ecosystem, Climatic Change, 117, 103–117, doi:10.1007/s10584-012-0559-5, 2013.
Shi, Z., Thomey, M. L., Mowll, W., Litvak, M., Brunsell, N. A., Collins, S. L., Pockman, W. T., Smith, M. D., Knapp, A. K., and Luo, Y.: Differential effects of extreme drought on produc-tion and respiraproduc-tion: synthesis and modeling analysis, Biogeo-sciences, 11, 621–633, doi:10.5194/bg-11-621-2014, 2014. Shiau, J. T.: Fitting drought duration and severity with
two-dimensional Copulas, Water Resour. Manage., 20, 795–815, 2006.
Shiau, J. T. and Modarres, R.: Copula-based drought severity-duration-frequency analysis in Iran, Meteorol. Appl., 16, 481– 489, doi:10.1002/met.145, 2009.
Shiau, J.-T., Feng, S., and Nadarajah, S.: Assessment of hydrologi-cal droughts for the Yellow River, China, using copulas, Hydrol. Process., 21, 2157–2163, doi:10.1002/hyp.6400, 2007.
Shiau, J.-T., Modarres, R., and Nadarajah, S.: Assessing multi-site drought connections in Iran using empirical Copula, Environ. Model. Assess., 17, 469–482, doi:10.1007/s10666-012-9318-2, 2012.
Sklar, M.: Fonctions de répartition à n dimensions et leurs marges, Université Paris, Paris, 229–231, 1959.
Smithers, J., Pegram, G., and Schulze, R.: Design rainfall estimation in South Africa using Bartlett–Lewis rectangular pulse rainfall models, J. Hydrol., 258, 83–99, 2002.
Spinoni, J., Antofie, T., Barbosa, P., Bihari, Z., Lakatos, M., Szalai, S., Szentimrey, T., and Vogt, J.: An overview of drought events in the Carpathian Region in 1961–2010, Adv. Sci. Res., 10, 21–32, doi:10.5194/asr-10-21-2013, 2013.
Sternberg, M. and Shoshany, M.: Influence of slope aspect on Mediterranean woody formations: Comparison of a semi-arid and an semi-arid site in Israel, Ecol. Res., 16, 335–345, doi:10.1046/j.1440-1703.2001.00393.x, 2001.
Todisco, F., Mannocchi, F., and Vergni, L.: Severity-duration-frequency curves in the mitigation of drought impact: an agricultural case study, Nat. Hazards, 65, 1863–1881, doi:10.1007/s11069-012-0446-4, 2013.
Tsakiris, G.: Meteorological drought assessment, European Re-search Program MEDROPLAN, Mediterranean Drought Pre-paredness and Mitigation Planning, Zaragoza, Spain, 2004, Tsakiris, G. and Vangelis, H.: Establishing a drought index
incor-porating evapotranspiration, European Water, 9/10, 3–11, 2005. Tsakiris, G., Pangalou, D., and Vangelis, H.: Regional drought
as-sessment based on the Reconnaissance Drought Index (RDI), Water Resour. Manage., 21, 821–833, 2007.
Unep, N. M. and Thomas, D.: World Atlas of Desertification, Ed-ward Arnold, London, 15–45, 1992.
Vangelis, H., Tigkas, D., and Tsakiris, G.: The effect of PET method on Reconnaissance Drought Index (RDI) calculation, J. Arid En-viron., 88, 130–140, doi:10.1016/j.jaridenv.2012.07.020, 2013. Vargas, R., Sonnentag, O., Abramowitz, G., Carrara, A., Chen, J.
M., Ciais, P., Correia, A., Keenan, T. F., Kobayashi, H., and Ourcival, J.-M.: Drought influences the accuracy of simulated ecosystem fluxes: A model-data meta-analysis for Mediterranean Oak Woodlands, Ecosystems, 16, 749–764, 2013.
Vicente-Serrano, S. M., Beguería, S., and López-Moreno, J. I.: A multiscalar drought index sensitive to global warming: The Stan-dardized Precipitation Evapotranspiration Index, J. Climate, 23, 1696–1718, doi:10.1175/2009JCLI2909.1, 2010.
Vicente-Serrano, S. M., Gouveia, C., Camarero, J. J., Beguería, S., Trigo, R., López-Moreno, J. I., Azorín-Molina, C., Pasho, E., Lorenzo-Lacruz, J., Revuelto, J., Morán-Tejeda, E., and Sanchez-Lorenzo, A.: Response of vegetation to drought time-scales across global land biomes, P. Natl. Acad. Sci., 110, 52–57, doi:10.1073/pnas.1207068110, 2013.
Wilhite, D. A., Svoboda, M. D., and Hayes, M. J.: Understanding the complex impacts of drought: a key to enhancing drought mit-igation and preparedness, Water Resour. Manage., 21, 763–774, 2007.
D. Halwatura et al.: Drought severity–duration–frequency curves 1091
resource management, CSIRO Land & Water, Canberra, ACT, 2002.
Williamson, G. B., Laurance, W. F., Oliveira, A. A., Delamônica, P., Gascon, C., Lovejoy, T. E., and Pohl, L.: Amazonian tree mortal-ity during the 1997 El Nino drought, Conserv. Biol., 14, 1538– 1542, 2000.
Woli, P., Jones, J. W., Ingram, K. T., and Fraisse, C. W.: Agricultural reference index for drought (ARID), Agron. J., 104, 287–300, 2012.
Wong, G., Lambert, M. F., Leonard, M., and Metcalfe, A. V.: Drought analysis using trivariate Copulas conditional on climatic states, J. Hydrol. Eng., 15, 129–141, 2010.
Woodhams, F., Southwell, D., Bruce, S., Barnes, B., Appleton, H., Rickards, J., Walcott, J., Hug, B., Whittle, L., and Ahammad, H.: Carbon Farming Initiative: A proposed common practice frame-work for assessing additionality, Canberra, August 2012. Yoo, J., Kim, U., and Kim, T.-W.: Bivariate drought frequency
curves and confidence intervals: a case study using monthly rain-fall generation, Stoch. Environ. Res. Risk Assess., 27, 285–295, 2013.
Zarch, M. A. A., Malekinezhad, H., Mobin, M. H., Dastorani, M. T., and Kousari, M. R.: Drought monitoring by reconnaissance drought index (RDI) in Iran, Water Resour. Manage., 25, 3485– 3504, 2011.
Zargar, A., Sadiq, R., Naser, B., and Khan, F. I.: A review of drought indices, Environ. Rev., 19, 333–349, 2011.
Zhang, A. and Jia, G.: Monitoring meteorological drought in semiarid regions using multi-sensor microwave re-mote sensing data, Rere-mote Sens. Environ., 134, 12–23, doi:10.1016/j.rse.2013.02.023, 2013.
Zhang, L., Dawes, W. R., and Walker, G. R.: Response of mean an-nual evapotranspiration to vegetation changes at catchment scale, Water Resour. Res., 37, 701–708, doi:10.1029/2000WR900325, 2001.