4265
THE USER ACCEPTANCE FACTORS OF E-FILING
SYSTEM IN PONTIANAK
1FARAH DEVI ANDRIANI, 2TOGAR ALAM NAPITUPULU, 3SRI HARYANINGSIH
1Former Student, Master in Information Systems Management, Bina Nusantara University, INDONESIA
2Assoc. Prof., Master in Information Systems Management, Bina Nusantara University, INDONESIA
3Assoc. Prof., Department of Public Administration, Tanjungpura University, INDONESIA
E-mail: 1[email protected] , 2[email protected] , 3[email protected]
ABSTRACT
The application of information technology (IT) within an organization is necessity of globalization. Nowadays, governments try to develop public service system based on e-commerce called e-government. One of e-government which is currently being introduced to the public is e-Filing system for filing tax report. However, until now we do not know why a lot of people still do not adopt the e-Filing system. The purpose of writing this research study is to analyze factors that influence user acceptance of the e-Filing system. This is done by evaluating user acceptance based on human behavior theory towards the use of information systems. The research is based on a combination of UTAUT and IS Success Model. The data collected was from distributing questionnaires to 394 respondents of e-Filing users in Pontianak. All data were analyzed using Structural Equation Modeling (SEM) with SPSS AMOS 22. The test results of this research found that factors influence user acceptance of e-Filing system in Pontianak are Information Quality (IQ), Service Quality (SQ) and System Quality (SYQ), Use Behavior (UB), User Satisfaction (US) and Behavior Intention.
Keywords: User Acceptance, e-Filing, Structural Equation Model
1.
INTRODUCTIONNowadays, Information Technology (IT) is developing very fast; it offers ease of access to process all organization’s activity. One of examples from technology development is e-government. E-Government has to improve the quality of public services from government sector. According to the implementation of e-government Roadmap 2010-2014 will be implemented in several stages, namely the standardization phase which includes the construction of e-government master plan in Indonesia, then entered the stage of the online service to provide information to the public infrastructure integration with using data center or possible using cloud computing, service interconnection with collaboration, and sharing capabilities, and service integration in the implementation of e-government will encourage paperless [1].
The popular of e-government, which is currently being introduced to the public is the tax e-Filing. Implementation of e-Filing in Indonesia has been defined in regulation of the Directorate General of Taxation of the Ministry of Finance (Keputusan
Direktorat Jendral Pajak) Number Kep-88/PJ/2004. E-Filing assists the process of filling Tax (SPT) by taxpayers online. Taxpayers with internet access can use tax filing software to input their income data directly, thereby eliminating the need to fill out forms [2]. Implementation of e-Filing is expected to provide optimal service and improve taxpayer satisfaction. The automation of the tax function can be seen as the transformational catalyst for changing governmental processes through which taxation is handled, as well as the manner in which the citizenry interacts with the government in that regard[3].
The role of society to participate in e-Filing system is very important to make this system success. Social norms and the perceived attributes of relative advantage, compatibility, and complexity significantly influence the adoption intention of current users. [2], but there is also a taxpayer who still do not use e-Filing system.
4266 use of Filing is still not used optimally as e-Filing’s goal is to be applied by all taxpayers. Individual acceptance of the system indicated by the use of this system is certainly can be a big reason for the success of e-Filing system. For legal and logistical reasons, the government can not force citizens to pay taxes online [4]. If such a system is to be successful it must be attractive and trustworthy [4]. That mean the success of an information system can be seen from the interest and acceptance from the user to use it. One method to know the success of the use a system is by evaluating the use of the system. Evaluation needs to do because it can define how well the information system has been implemented and determine what improvements can be recommended in order to improve the functions of the e-filing system. E-filing system related with user satisfaction from the quality of services provided by the government in tax reporting, for the measurement of this evaluation can be done by examining any factors that drives a taxpayer to adopt e-Filing. Without analyzing the users’ perception about an information system, its evaluation is impossible. The users’ satisfaction is assumed as a performance guarantee for information [5].
2.
LITERATURE REVIEW E-FILINGThe regulation of the Directorate General of Taxation Number 47/PJ/2008 said that, e-Filing is a way of delivering Annual Tax Report (SPT) and delivery of Renewal Notice of Annual SPT electronically conducted online and in real time through an Application Service Provider (ASP) [6]. Under the e-Filing system, taxpayers need to fill their tax returns through the internet. Throughout this process, the system provides some guidance to the taxpayers on the correct information to include in their tax return. The system also calculates the amount of tax assessed based on the information that was provided in the tax return [7]. It can be concluded that the e-Filing is an information system that helps users (taxpayers) to submit reports online SPT uses the internet to be done in real time.
THE UNIFIED THEORY OF ACCEPTANCE AND USE OF TECHNOLOGY (UTAUT)
This theory was developed by Venkatesh [8] through the review and integration of eight theories and models Technology Acceptance, which consists of: Theory of Reasoned Action (TRA),
Technology Acceptance Model (TAM),
Motivational Model (MM), Theory of Planned
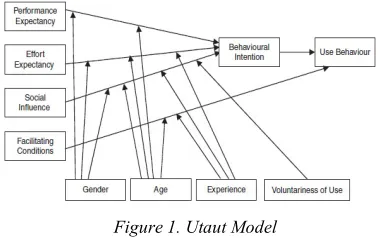
[image:2.612.325.514.229.348.2]Behavior (TPB), combined TBP and TAM (C-TAM-TPB), Model of PC Utilization, Innovation Diffusion Theory (IDT), and Social Cognitive Theory (SCT). The UTAUT suggests that four core constructs (performance expectancy, effort expectancy, social influence and facilitating conditions) are direct determinants of behavioral intention and ultimately behavior, and that these constructs are in turn moderated by gender, age, experience, and voluntariness of use [9]. This model is depicted in Figure 1.
Figure 1. Utaut Model
According to UTAUT, performance expectancy, effort expectancy, and social influence are theorized to influence behavioral intention to use a technology, while behavioral intention and facilitating conditions determine technology use. Also, moderating variables such as age, gender, and experience (note that we drop voluntariness, which is part of the original UTAUT, are theorized to moderate various UTAUT relationships [10].
In 2012, Venkatesh rebuilt this model with Thong and Xin called UTAUT2. UTAUT2 incorporates three constructs into UTAUT: hedonic motivation, price value, and habit. Individual categorizing variables such as name, age, gender, and experience are also hypothesized to moderate the effects of these constructs on behavioral intention and technology use [11].
INFORMATION SYSTEM SUCCESS MODEL
4267 Figure 2. Is Success Model
PREVIOUS RESEARCH
A study about transformation aspects of governance by applying online tax had been done before by Fu et. al [14]. This study was conducted to determine of factors that affect taxpayer intention to choose adopt tax-filing, using manual, barcode or internet. This study uses the approach of TAM and TPB theory by analyzing the use Confirmatory Factor Analysis (CFA).
Moorthy et. al [15] conduct research on e-Filing in Perak, Malaysia. In this research it can be seen that the perceived ease of use and perceived usefulness produce a greater influence than the other the factors, yet look at perceived service and information quality does not affect the behavior of e-Filing.
A similar study conducted by Islam et al. in Malaysia by using Information System Success Model. The result of this research concluded that the quality of information: the accuracy, completeness and updates; Quality of service: the perception of the service, to build trust and customization; Quality System: functionality and responsiveness is a key determinant of satisfaction of users of e-Filing in Malaysia [16]. Number of models based on human behavior in using an information system that is offered, it is necessary to approach and integration will each model to generate a powerful model and in accordance with the scope of the study. Mardiana et.al.[17] proposes the development of a theory of DeLone-McLean model because this model is considered to have the basic theory for predicting the intention to use of information systems, the additional variables, to give a philosophical theory strongly supported (Figure 3).
Figure 3. Development Of IS Success Factor Model, TAM And UTAUT
Pollard III [18] did a research of the relationship of service quality and behavior intention using the technique analysis of Structural Equation Model (SEM). While,Alibraheem and Abdul-Jabbar [19] did a research that provides the theoretical basis of adoption of Electronic Tax Filing (ETF), through using the UTAUT framework and the subsequent impact on the employees of the state tax and the tax office's picture of performance in Jordan.
3.
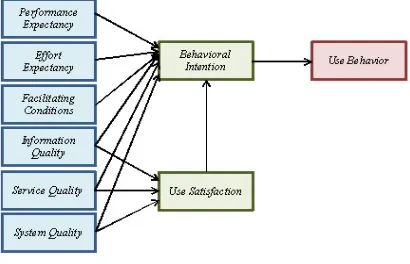
METHOD [image:3.612.314.519.557.689.2]Based on the study from theories in the previous chapter, this study will use the combined model of The Unified Theory of Acceptance And Use Of Technology (UTAUT) integrated with the Information System (IS) Success Model, known as Model DeLone and McLean. Some of the variables used from UTAUT models are performance expectancy (PE), effort expectancy (EE), facilitating conditions (FC), behavioral intention (BI) and use behavior (UB). Another variable that is used as part of IS Success Model of variable information quality (IQ), service quality (SQ), system quality (SyQ) and user satisfaction (US). The model framework for this research can be seen in Figure 4.
Figure 4. Research Model
e-4268 Filing system in Pontianak. Total of population is 29,377 taxpayers registered. Sampling technique in this research used a proportional random sampling with the sample size is calculated using Slovin’s formula. The results of samples calculate by Slovin’s formulas is 394.6 which is rounded up to 394 people.
Methods of data analysis in this study using a model Structural Equation Modeling (SEM) with SPSS Analysis of Moment Structures (AMOS) 22. SEM consists of two parts:
1. Measurement Model. This section describes the
latent relationship with its indicators. It will describe each variable, in the equation linking these variables with the indicator, in order to define the latent variables in this study. 2. Structural model designed from relations that
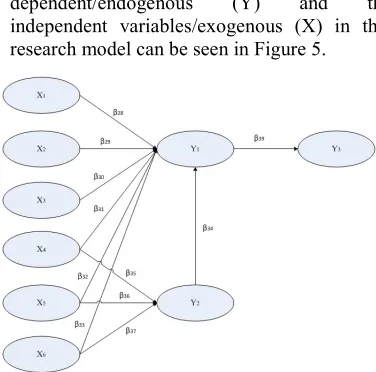
have been shown in the theoretical framework (Figure 3.1) of this study. The design is done by analyzing the relationship between the dependent variable (Y) and the independent variable (X). Those independent variables are the performance expectancy (X1), effort expectancy (X2), facilitating conditions (X3), information quality (X4), service quality (X5), system quality (X6), behavioral intention (Y1), and user satisfaction (Y2) to use behavior (Y3).
The relationship between the
dependent/endogenous (Y) and the
[image:4.612.323.530.209.353.2]independent variables/exogenous (X) in this research model can be seen in Figure 5.
Figure 5. Research Structural Model Furthermore, from the relationship between variables in the model (Figure 5) can be written in the following a structural equation models as regression equations:
Y1 = β10 + β11X1 + β12X2 + β13X3 + β14X4 + β15X5 + β16X6 + β17Y2 +
ε
1 ……… (1)Y2 = β20 + β21X4 + β22X5 + β23X6 +
ε
2 …… (2) Y3 = β30 + β31Y1 +ε
3 ……….. (3)4.
RESULT AND DISCUSSION [image:4.612.103.291.438.624.2]The research model that has been formed in the previous chapter created in SPSS AMOS 22 to analysis the model. The SEM model in this research can be seen in Figure 6.
Figure 6. Structural Equation Model Using AMOS 22
MEASUREMENT MODEL
From Figure 6, it can be seen that all research indicators have a value of loading factor ≥ 0.50, so it means all indicators already have a higher contribution to explain the latent variables. Based on the above loading factor, then the next can be done reliability testing. This test is intended to be able to see the reliability and consistency of the data in this study, the reliability tests performed by calculating construct Reliability (CR). A variable is valid if it has a CR value equal to or greater than 0.70 (≥ 0.70). The formula calculates the CR is:
CR =
* λi = loading factor
i = measurement error = 1- λi2
Next step is calculated construct reliability value, as below:
PE = = 0,84
4269
FC = = 0,78
IQ = = 0,81
SQ = = 0,82
SyQ = = 0,85
BI = = 0,86
US = = 0,84
UB = = 0,87
Based on the calculation of CR, all the latent variable gain value is greater than 0.70, so it can be concluded that this research data is reliable.
STRUCTURAL MODEL
Hypothesis testing in the SEM of causal relationship can be concluded based on the p-value
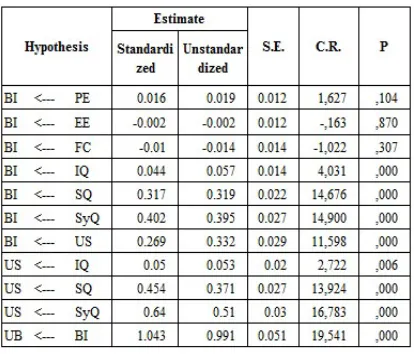
[image:5.612.91.298.462.639.2](P) or Critical Ratio (C.R.) or t-stat. The results of hypothesis testing can be seen from Table 1.
Table 1. Regression Weight
The result can be described as below:
a. Hypothesis 1:
H0: There is no influence of performance
expectancy (PE) on the behavioral intention (BI) in the adoption of e-Filing system.
H1: There is a positive influence of performance
expectancy (PE) on the behavioral intention (BI) in the adoption of e-Filing system.
Parameter estimation in testing the effect of Performance Expectancy on Intention indicates that having the value of the t-stat amounted to 1,627 which is less than 1.95 and the p-value of 0.104 which is greater than 0.05, we accept H0, meaning that there is not enough evidence from the sample to conclude that Performance Expectancy has an influence on Behavior Intention with significant level of 5 %.
b. Hypothesis 2:
H0: There is no influence of effort expectancy (EE)
on behavioral intention (BI) in the adoption of e-Filing system.
H1: There is positive influence of effort expectancy
(EE) on behavioral intention (BI) in the adoption of e-Filing system.
Parameter estimation in testing the effect of Performance Expectancy on Intention indicates that having the value of the t-stat amounted to 0.163 which is less than 1.95 and the p-value of 0.870 which is greater than 0.05, we accept H0, meaning that there is not enough evidence from the sample to conclude that Effort Expectancy has an influence on Behavior Intention with significant level of 5 %.
c. Hypothesis 3:
H0: There is no effect of facilitating conditions
(FC) on behavioral intention (BI) in the adoption of e-Filing system.
H1: There is positive influence between facilitating
conditions on behavioral intention in the adoption of e-Filing system.
Parameter estimation in testing the effect of Facilitating Condition on Intention indicates that having the value of the t-stat amounted to 1.022 which is less than 1.95 and the p-value of 0.307 which is greater than 0.05, we accept H0, meaning that there is not enough evidence from the sample to conclude that Facilitating Condition has an influence on Behavior Intention with significant level of 5 %.
d. Hypothesis 4
H0: There is no effect of information quality (IQ)
4270
H1: There is a positive influence of Information
Quality with behavioral intention in the adoption of e-Filing system.
Parameter estimation in testing the effect of Information Quality on Intention indicates that having the value of the t-stat amounted to 4.031 which is greater than 1.95 and the p-value of 0.000 which is smaller than 0.05, we reject H0, meaning that there is enough evidence from the sample to conclude that Information Quality has an influence on Behavior Intention with significant level of 5 %.
e. Hypothesis 5
H0: There is no influence between Service Quality
(SQ) on Behavioral Intention (BI) in the adoption of e-Filing system.
H1: There is a positive influence of service quality
with behavioral intention in the adoption of e-Filing system.
Parameter estimation in testing the effect of Service Quality on Intention indicates that having the value of the t-stat amounted to 14.676 which is greater than 1.95 and the p-value of 0.000 which is less than 0.05, we reject H0, meaning that there is enough evidence from the sample to conclude that Service Quality has an influence on Behavior Intention with significant level of 5 %.
f. Hypothesis 6
H0: There is no influence of quality of the system
(SyQ) on behavioral intention in the adoption of e-Filing system.
H1: There is a positive influence of quality of the
system on behavioral intention in the adoption of e-Filing system.
Parameter estimation in testing the effect of System Quality on Intention indicates that having the value of the t-stat amounted to 14.900 which is greater than 1.95 and the p-value of 0.000 which is less than 0.05, we reject H0, meaning that there is enough evidence from the sample to conclude that System Quality has an influence on Behavior Intention with significant level of 5 %.
g. Hypothesis 7
H0: There is no positive influence of user
satisfaction (US) on behavioral intention in the adoption of e-Filing system
H1: There is a positive influence between user
satisfaction on the behavioral intention in the adoption of e-Filing system.
Parameter estimation in testing the effect of User Satisfaction on Intention indicates that having the value of the t-stat amounted to 11.598 which is greater than 1.95 and the p-value of 0.000 which is less than 0.05, we reject H0, meaning that there is enough evidence from the sample to conclude that User Satisfaction has an influence on Behavior Intention with significant level of 5 %.
h. Hypothesis 8
H0: There is no effect of information quality (IQ)
on user satisfaction in the adoption of e-Filing system.
H1: There is a positive influence between
information quality on user satisfaction in the adoption of e-Filing system.
Parameter estimation in testing the effect of Information Quality on User Satisfaction indicates that having the value of the t-stat amounted to 2.722 which is greater than 1.95 and the p-value of 0.006 which is less than 0.05, we reject H0, meaning that there is enough evidence from the sample to conclude that Information Quality has an influence on User Satisfaction with significant level of 5 %.
i. Hypothesis 9
H0: There is no influence of service quality (SQ) on
user satisfaction (US) in the adoption of e-Filing system.
H1: There is a positive influence between service
quality on user satisfaction in the adoption of e-Filing system.
Parameter estimation in testing the effect of Service Quality on User Satisfaction indicates that having the value of the t-stat amounted to 13.924 which is greater than 1.95 and the p-value of 0.000 which is less than 0.05, we reject H0, meaning that there is enough evidence from the sample to conclude that Service Quality has an influence on User Satisfaction with significant level of 5 %.
j. Hypothesis 10
H0: There is no effect of quality system (SyQ) on
user satisfaction (US) with the in the adoption of e-Filing system.
H1: There is a positive influence between systems
quality on user satisfaction in the adoption of e-Filing system.
4271 which is greater than 1.95 and the p-value of 0.000 which is less than 0.05, we reject H0, meaning that there is enough evidence from the sample to conclude that System Quality has an influence on User Satisfaction with significant level of 5 %.
k. Hypothesis 11
H0: There is no influence of behavioral intention
on the use behavior.
H1: There is a positive influence of behavioral
intention on the use behavior.
Parameter estimation in testing the effect of Behavioral Intention on Use Behavior indicates that having the value of the t-stat amounted to 19.541 which is greater than 1.95 and the p-value of 0.000 which is less than 0.05, we reject H0, meaning that there is enough evidence from the sample to conclude that Behavioral Intention has an influence on Use Behavior with significant level of 5 %.
Table 2. Behavior Intention Coefficient Determination
Based on the results of Table 2 it can be seen that variation on the Behavioral Intention is explain by the model, i.e., the variable Information Quality, Service Quality, System Quality and User Satisfaction by 93% (Equation 1), while the remaining 7% influenced by other factors which is not included in the study. In other words, the reliability of the model is 93 %.
Table 3. User Satisfaction Coefficient Determination
Table 3 shows that the variation in User Satisfaction explained by relationship model between variables information Quality, Service Quality and System Quality (Equation 2) by the amount of 92%, while the remaining 8% influenced by other factors not included in the study. Meaning that the reliability of the model is 92 %.
Table 4. Use Behavior CoefficientDetermination
Based on Table 4 can be seen that the variable Behavior Intention contributed 87% to the variation in influencing Use Behavior, while the rest of 13% influenced by other factors not included in the
study. In other words, the reliability of the model (Equation 3) is 87 %.
5.
CONCLUSIONBased on the hypothesis test results, it was found that factors that influence user acceptance of the use of Tax e-Filing city of Pontianak, represented by Use Behavior (UB), are Information Quality (IQ), Service Quality (SQ) and System Quality (SYQ) that first mediated by Behavior Intention (BI). Those three variables also has an impact on User Satisfaction (US) which in turn through mediating variable Behavior Intention determine user acceptance of the system. It is therefore suggested for the local tax agency to improve the three variables in order to increase the rate of usage of the system. Other variables such as performance expectancy, effort expectancy, and facilitating condition were found to not significantly affecting the user acceptance of the system. Either these factors have been fulfilling their expectation or they might be considered as important factors in their acceptance of the system. In terms of degree of importance of the factors, it was found that System Quality followed by Service Quality are the most dominant factors in determining Behavior Intention while System Quality is the most dominant factor in determining User Satisfaction, followed by Service Quality and Information Quality. From this, it can be seen that the System Quality and Service Quality are factors that most influences user to adopt the e-Filing system. This can be caused by the nature of this type of system as an electronic-based service system, where visibility and security as part of quality are usually mostly considered by users or customers.
REFRENCES:
[1] Kementerian Komunikasi dan Informatika Republik Indonesia (KOMINFO). (2012).
Kementerian Komunikasi dan Informatika Buku Putih. Jakarta: Badan Penelitian dan Pengembangan Sumber Daya Manusia Kementerian Komunikasi dan Informatika. [2] Liang, S.-w., & Lu, H.-p. (2013). Adoption
of e-government services: an empirical study of the online tax filing system in Taiwan.
Online Information Review, Vol.37, 424-442
[3] Stafford, T. F., & Turan, A. H. (2011). Online tax payment systems as an emergent aspect of governmental transformation.
4272 [4] Connolly, R., Bannister, F., & Kearney, A.
(2010). Government website service quality: a study of the Irish revenue online service.
European Journal of Information Systems, 649–667
[5] Isfahani, S., Jahanbakhsh, M., Habibi, M., Mirzaeian, R., Nasirian, M., & Rad, J. (2014). A Survey on the Users’ Satisfaction with the Hospital Information Systems (HISs) based on DeLone and McLean’s Model in the Medical-Teaching Hospitals in Isfahan City. ACTA INFORM MED, 179-182.
[6] Direktorat Jendral Pajak. (2008). Peraturan
Direktur Pajak Nomor 47/PJ/2008. Jakarta:
Direktorat Jendral Pajak Republik Indonesia. [7] Azmi, A. C., & Ng, L. B. (2010). The Acceptance of the e-Filing System by Malaysian Taxpayers: A Simplified Model.
Academic Conferences International
Limited, 13-21.
[8] Venkatesh, V., Morris, M. G., Davis, G. B., & Davis, F. D. (2003). User Acceptance Of Information Technology: Toward A Unified View. MIS Quartery, Vol.27, 425-478. [9] Williams, M. D., Rana, N. P., & Dwivedi, Y.
K. (2015). The unified theory of acceptance and use of technology (UTAUT) : a literature review. Journal of Enterprise
Information Management, 443-488
[10] Venkatesh, V., Thong, J., & Xin, X. (2012). Consumer Acceptance And Use Of Information Technology:Extending The Unified Theory Of Acceptance And Use Of Technology. Forthcoming in MIS Quarterly, 157-178.
[11] Chang, A. (2012). Utaut And Utaut 2: A Review And Agenda For Future Research.
Journal The WINNERS, 106-114.
[12] DeLone, W., & McLean, E. (2003). The DeLone and McLean Model of Information Systems Success: A Ten-Year Update.
Journal of Management Information Systems, Vol.19, 9-30.
[13] Petter, S., DeLeon, W., & McLean, E. (2013). Information Systems Success: The Quest for the Independent Variables.
Journal of Management Information Systems, 6-61.
[14] Fu, J.-R., Farn, C.-K., & Chao, W.-P. (2006). Acceptance of electronic tax filing: A study of taxpayer intentions. ELSEVIER: Information & Management, 109-126
[15] Moorthy, M., Binti Mohd Hussin, S., Binti Samsuri, A. S., Binti Othman, M. S., & Chelliah, M. K. (2014). E-Filing Behaviour among Academics in Perak State in Malaysia. Scientific Research, Vol. 5, 79-94. [16] Islam, M., Yusuf, D., Yusoff, W., & Nor, A.
B. (2012). Factors affecting user satisfaction in the Malaysian income tax e-filing system.
African Journal of Business Management, Vol. 6, 6447-6455.
[17] Mardiana, S., Tjakraadmadja, J., & Aprianingsih, A. (2015). DeLone–McLean Information System Success Model Revisited: The Separation of Intention to Use - Use and the Integration of Technology Acceptance Models. International Journal of Economics and Financial, 172-182. [18] Pollard III, L. M. (2010). Perceived Service
Quality’s Impact On Behavioral Intentions
In The Timeshare Industry. Florida:
University of Central Florida.