Smart Traffic Control System Based on Image
Processing
Chirag Thakkar1, Rajesh Patil2
1
M.Tech Scholar, Dept. of Electronics Engineering, VJTI, Mumbai 400019
2
Associate Professor, Dept. of Electronics Engineering, VJTI, Mumbai 400019
Abstract: In today’s life we are facing many problems one of which is traffic congestion becoming more serious day after day. The major reason leading to traffic jam is the high number of vehicle which was caused by the population and the development of economy. Currently, traffic lights are automatically getting ON and OFF depending on the timer value changes. In this, time is being wasted by a green light on an empty road which can be utilized on some other lane. These frequent traffic problems like traffic jams have led to the rise of the need for an efficient traffic management method. Possible Solution is dynamic allocation of time to different lanes on signals. This paper demonstrates about a project that design a smart traffic control system based on image processing in MATLAB with GUI using GUIDE. In this, traffic density of lanes is calculated using image processing which is done of images of lanes that are captured using digital camera. After image acquisition, image undergoes various image pre-processing, image enhancement and edge detection techniques. At last, image matching of detected edges is done using pixel by pixel method. According to this matching percentage, decision is to be taken for the dynamic allocation of time to different lanes.
Keywords: Image Pre-processing, Image enhancement, Edge detection, Traffic density analysis, Graphical User Interface (GUI)
I. INTRODUCTION
In modern life we have to face with many problems one of which is traffic congestion becoming more serious day after day. It is said that the high tome of vehicles, the scanty infrastructure and the irrational distribution of the development are main reasons for augmented traffic jam. The major cause leading to traffic jam is the high number of vehicle which was caused by the population and the development of economy. Particularly, in some Asian countries such as Viet Nam, the local authorities passed law limiting to the number of vehicles for each family. Besides, the highway and roads are incapable of meeting the requirement of increasing number of vehicle. Instead of working on roads to accommodate the growing traffic various techniques have been devised to control the traffic on roads like embedded controllers that are installed at the junction.
A. Standard Traffic Control Systems
1) Manual Controlling: Manual controlling the name instance it require man power to control the traffic. Depending on the countries and states the traffic polices are allotted for a required area or city to control traffic. The traffic polices will carry sign board, sign light and whistle to control the traffic [2] ,[5].
2) Automatic Controlling: Automatic traffic light is controlled by timers and electrical sensors. In traffic light each phase a constant numerical value loaded in the timer. The lights are automatically getting ON and OFF depending on the timer value
changes. While using electrical sensors it will capture the availability of the vehicle and signals on each phase depending on the signal the lights automatically switch ON and OFF [2] ,[5].
B. Drawbacks of Standard Traffic Control System
II. IMAGEPROCESSINGINTRAFFICLIGHTCONTROL
Image Processing is a technique to enhance raw images received from cameras/sensors placed on space probes, aircrafts and satellites or pictures taken in normal day-today life for various applications. An Image is rectangular graphical object. Image processing involves issues related to image representation, compression techniques and various complex operations, which can be carried out on the image data[6],[7]. The operations that come under image processing are image enhancement operations such as sharpening, blurring, brightening, edge enhancement etc. [6],[7]. Image processing is any form of signal processing for which the input is an image, such as photographs or frames of video; the output of image processing can be either an image or a set of characteristics or parameters related to the image. Most image-processing techniques involve treating the image as a two-dimensional signal and applying standard signal-processing techniques to it. Image processing usually refers to digital image processing, but optical and analog image processing are also possible.
We propose a system to control traffic light by image processing. The vehicles are detected by the System with the help of images instead of using electronic sensors. A camera will be placed alongside the traffic light. It will capture image sequences. Image processing is a better technique to control the state change of the traffic light. It shows that it can decrease the traffic congestion and avoids the time being wasted by a green light on an empty road. It is also more reliable in estimating vehicle presence because it uses actual traffic images. It visualizes the practicality, so it functions much better than those systems that rely on the detection of the vehicles’ metal content
III.DETAILDESCRIPTIONOFPROJECT
Many techniques have been developed in Image Processing during the last four to five decades. Most of the methods are developed for enhancing images obtained from unmanned space probes, spacecraft and military reconnaissance flights. Image Processing systems are becoming widely popular due to easy availability of powerful personnel computers, large memory devices, graphics software and many more.
Image processing involves issues related to image representation, compression techniques and various complex operations, which can be carried out on the image data. The operations that come under image processing are image enhancement operations such as sharpening, blurring, and brightening and edge enhancement .Traffic density of lanes is calculated using image processing which is done of images of lanes that are captured using digital camera. We have chosen image processing for calculation of traffic density as cameras are very much cheaper than other devises such as sensors.
[image:3.612.79.536.485.706.2]A. Image Acquisition
Generally an image is a two-dimensional function f(x, y) (here x and y are plane coordinates).The amplitude of image at any point say f is called intensity of the image [1] ,[4]. It is also called the grey level of image at that point. We need to convert these x and y values to finite discrete values to form a digital image. The input image is a fundus taken from stare data base and drive data base. The image of the retina is taken for processing and to check the condition of the person. We need to convert the analog image to digital image to process it through digital computer. Each digital image composed of a finite elements and each finite element is called a pixel.
B. Image Pre-processing
Image Pre-processing includes RGB to grey conversion and image scaling.
1) RGB to Grey Conversion: Humans perceive colour through wavelength-sensitive sensory cells called cones. There are three different varieties of cones, each has a different sensitivity to electromagnetic radiation (light) of different wavelength. One cone is mainly sensitive to green light, one to red light, and one to blue light. By emitting a restricted combination of these three colours (red, green and blue), and hence stimulate the three types of cones at will, we are able to generate almost any detectable colour [6] ,[13]. This is the reason behind why colour images are often stored as three separate image matrices; one storing the amount of red (R) in each pixel, one the amount of green (G) and one the amount of blue (B). We call such colour images as stored in an RGB format. In grayscale images, however, we do not differentiate how much it emits of different colours, it emits the same amount in every channel. We will be able to differentiate the total amount of emitted light for each pixel; little light gives dark pixels and much light is perceived as bright pixels [6],[13]. When converting an RGB image to grayscale, we have to consider the RGB values for each pixel and make as output a singlevalue reflecting the brightness of that pixel. One of the approaches is to take the average of the contribution from each channel: (R+B+C)/3. However, since the perceived brightness is often dominated by the green component, a different, more "human-oriented", method is to consider a weighted average, e.g.: 0.3R + 0.59G + 0.11B [13].
2) Image Scaling: Image scaling occurs in all digital photos at some stage whether this be in Bayer demosaicing or in photo enlargement. It happens anytime you resize your image from one pixel grid to another. Image resizing is necessary when you need to increase or decrease the total number of pixels. Even if the same image resize is performed, the result can vary significantly depending on the algorithm. Images are resized because of number of reasons but one of them is very important in our project. Every camera has its resolution, so when a system is designed for some camera specifications it will not run correctly for any other camera depending on specification similarities. So it is necessary to make the resolution constant for the application and hence perform image resizing.
C. Image Enhancement
Image enhancement is the process of adjusting digital images so that the results are more suitable for display or further analysis. For example, we can eliminate noise, which will make it easier to identify the key characteristics. In poor contrast images, the adjacent characters merge during binarization. We have to reduce the spread of the characters before applying a threshold to the word image. Hence, we introduce “POWER- LAW TRANSFORMATION” which increases the contrast of the characters and helps in better segmentation. The basic form of power-law transformation
S = crγ
where r and S are the input and output intensities, respectively; c and γ are positive constants[12]. A variety of devices used for image capture, printing, and display respond according to a power law. By convention, the exponent in the power-law equation is referred to as gamma. Hence, the process used to correct these power-law response phenomena is called gamma correction. Gamma correction is important, if displaying an image accurately on a computer screen is of concern. In our experimentation, γ is varied in the range of 1 to 5. If c is not equal to ’1’, then the dynamic range of the pixel values will be significantly affected by scaling. Thus, to avoid another stage of rescaling after power-law transformation, we fix the value of c = 1.With γ = 1, if the power-law transformed image is passed through binarization, there will be no change in the result compared to simple binarization. When γ > 1, there will be a change in the histogram plot, since there is an increase of samples in the bins towards the grey value of zero [12]. Gamma correction is important if displaying an image accurately on computer screen is of concern.
Edge detection is the name for a set of mathematical methods which aim at identifying points in a digital image at which the image brightness changes sharply or, more technically, has discontinuities or noise [13]. The points at which image brightness alters sharply are typically organized into a set of curved line segments termed edges.
The same problem of detecting discontinuities in 1D signal is known as step detection and the problem of finding signal discontinuities over time is known as change detection. Edge detection is a basic tool in image processing, machine vision and computer envisage, particularly in the areas of feature reveal and feature extraction [8],[13].
1) Various edge detection techniques are [8],[13]
a) Sobel Edge Detection Technique
b) Perwitt Edge Detection
c) Roberts Edge Detection Technique
d) Zero cross Threshold Edge Detection Technique
e) Canny Edge Detection Technique
In our project we have used “CANNY EDGE DETECTION TECHNIQUE” because of its various advantages over other edge detection techniques.
The Canny Edge Detector is one of the most commonly used image processing tools detecting edges in a very robust manner. It is a multi-step process, which can be implemented on the GPU as a sequence of filters. Canny edge detection technique is based on three basic objectives.
i) Low Error Rate: All edges should be found, and there should be no spurious responses. That is, the edges must be as close as possible to the true edges.
ii) Edge Point should be well Localised: The edges located must be as close as possible to the true edges. That is the distance between a point marked as an edge by the detector and the centre of the true edge should be minimum.
iii) Single Edge Point Response: The detector should return only one point for each true edge point. That is, the number of local maxima around the true edge should be minimum. This means that the detector should not identify multiple edge pixels where only a single edge point exist.
The Canny edge detection algorithm consist of the following basic steps [14]: Smooth the input image with Gaussian filter
Compute the gradient magnitude and angle images.
Apply nonmaxima suppression to the gradient magnitude image.
Use double thresholding and connectivity analysis to detect and link edges.
E. Image Matching
Recognition techniques based on matching represent each class by a prototype pattern vector. An unknown pattern is assigned to the class to which is closest in terms of predefined metric. The simplest approach is the minimum distance classifier, which, as its name implies, computes the (Euclidean) distance between the unknown and each of the prototype vectors. It chooses the smallest distance to make decision. There is another approach based on correlation, which can be formulated directly in terms of images and is quite intuitive.
We have used a totally different approach for image matching. Comparing a reference image with the real time image pixel by pixel. Though there are some disadvantages related to pixel based matching but it is one of the best techniques for the algorithm which is used in the project for decision making. Real image is stored in matric in memory and the real time image is also converted in the desired matric. For images to be same their pixel values in matrix must be same. This is the simplest fact used in pixel matching. If there is any mismatch in pixel value it adds on to the counter used to calculate number of pixel mismatches. Finally percentage of matching is expressed as
Number of pixels matched successfully
%Match= * 100
Total number .of pixels
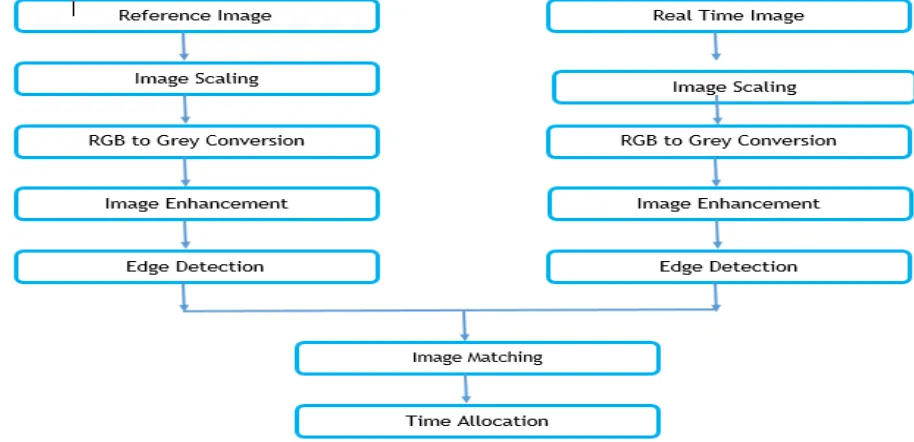
IV.IMPLEMENTATIONALGORITHM
The algorithm behind the block diagram consists of following steps
B. The images are pre-processed in two steps as follows
1) Images are rescaled to 300x300 pixels.
2) Then the above rescaled images are converted from RGB to grey.
C. Edge detection of pre-processed images is carried out using canny edge detection technique.
D. The output images of previous step are matched using pixel to pixel matching technique.
E. After matching the timing allocation is done depending on the percentage of matching as
1) If the matching is between 0 to 30% - green light is on for 90 seconds. 2) If the matching is between 30 to 50% - green light is on for 60 seconds. 3) If the matching is between 50 to 70% - green light is on for 30 seconds. 4) If the matching is between 70 to 90% - green light is on for 20 seconds. 5) If the matching is between 90 to 100% - red light is on for 90 seconds.
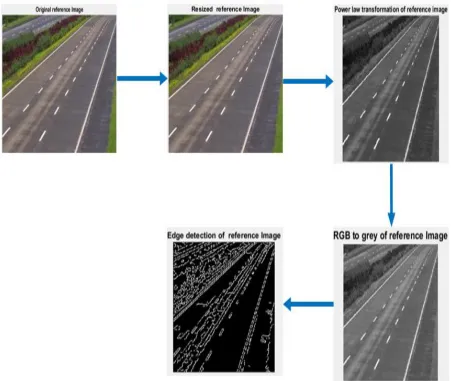
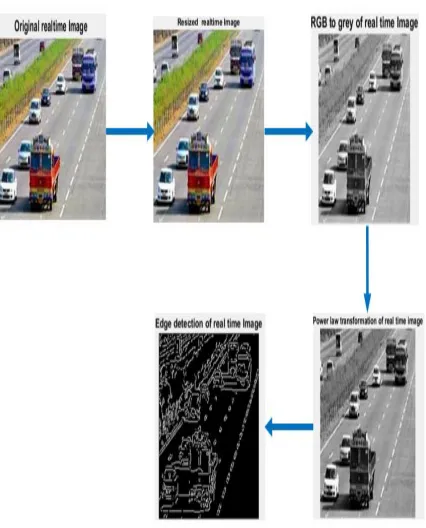
V. RESULTS
[image:6.612.79.530.316.697.2]Results of individual steps for reference and real time image are shown below
Fig. 3 Results of individual step for Real time image
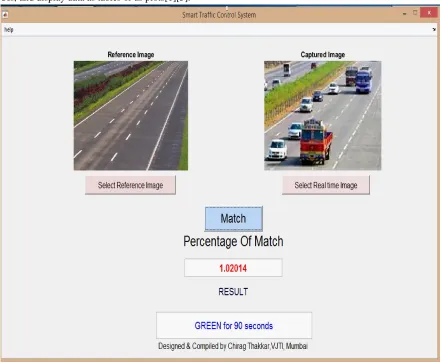
VI.IMPLEMENTATIONOFPROPOSDSYSTEMONGUIANDITSRESULTS
A. Graphical User Interface(GUI)
the tasks are performed. GUI components can include menus, toolbars, push buttons, radio buttons, list boxes, and sliders—just to name a few. GUIs created using MATLAB tools can also perform any type of computation, read and write data files, communicate with other GUIs, and display data as tables or as plots[1][5].
Fig. 4 Implementation of project in GUI
VII. CONCLUSIONS
“Smart Traffic Control System based on Image Processing” technique that we propose overcomes all the limitations of the earlier (in use) techniques used for controlling the traffic. Earlier in automatic traffic control use of timer had a drawback that the time is being wasted by green light on the empty. This technique avoids this problem. Upon comparison of various edge detection algorithms, it was inferred that Canny Edge Detector technique is the most efficient one. The project demonstrates that image processing is a far more efficient method of traffic control as compared to traditional techniques. The use of our technique removes the need for extra hardware such as sound sensors. The increased response time for these vehicles is crucial for the prevention of loss of life. Major advantage is the variation in signal time which control appropriate traffic density using Image matching. The accuracy in calculation of time due to single moving camera depends on the registration position while facing road every time. Output of GUI clearly indicated some expected results. It showed matching in almost every interval that were decided as boundaries like 10%, 35%, 68% etc.
VIII. ACKNOWLEDGMENT
REFERENCES
[1] Digital image processing by Rafael C. Gonzalez and Richard E. Woods.
[2] Ahmed S. Salama, Bahaa K. Saleh, Mohamad M. Eassa, ”Intelligent Cross Road Traffic Management System (ICRTMS),” 2nd Int. Conf. on Computer
Technology and Development, Cairo, Nov 2010, pp. 27-31.
[3] B. Fazenda, H. Atmoko, F.Gu, L. Guan1 and A. Ball” Acoustic Based Safety Emergency Vehicle Detection for Intelligent Transport Systems” ICCAS-SICE,
Fukuoka, Aug 2009, pp.4250-4255.
[4] Z. Jinglei, L. Zhengguang, and T. Univ, “A vision-based road surveillance system using improved background subtraction and region growing approach,”
Eighth ACIS Int. Conf. on Software Engineering, Artificial Intelligence, Networking, and Parallel/Distributed Computing, Qingdao, August 2007, pp. 819-822.
[5] Pallavi choudekar,sayanti banarjee,m.k muju “real time traffic light control using image processing” in Indian Journal of Computer Science and Engineering
(IJCSE)
[6] Chandrasekhar. M, Saikrishna. C, Chakradhar. B, Phaneendra Kumar. P & Sasanka. C “Traffic Control Using Digital Image Processing” in International
Journal of Advanced Electrical and Electronics Engineering, (IJAEEE), ISSN (Print): 2278-8948
[7] Harsha H. Sanap , P. A. Ghonge “Traffic Analysis Based On Image Processing” in International Journal of Science and Research (IJSR) ISSN (Online):
2319-7064
[8] M. Siyal, and J. Ahmed, “A novel morphological edge detection and window based approach for real-time road data control and management,” Fifth IEEE Int.
Conf. on Information, Communications and Signal Processing, Bangkok, July 2005, pp. 324-328.
[9] Y. Wu, F. Lian, and T. Chang, “Traffic monitoring and vehicle tracking using roadside camera,” IEEE Int. Conf. on Robotics and Automation, Taipei, Oct
2006, pp. 4631– 4636.
[10] Reulke, S. Bauer, T. D’oring, F. Meysel, “Traffic surveillance using multi-camera detection and multi-target tracking”, Proceedings of Image and Vision
Computing New Zealand 2007, pp. 175–180, Hamilton, New Zealand, December 2007
[11] Chinmaya H G, Nithin kumar N , Sagar B , Vinay Raj K M “Gesture Based Smart Home Automation System Using Real Time Inputs” in International
Journal of Latest Research in Engineering and Technology (IJLRET) ISSN: 2454-5031
[12] Traffic light control system simulation through vehicle detection using image processing by Mac Michael B. Reyes and Dr Eliezer A. Albaccea Deepak
Kumar and A G Ramakrishnan “Power-law Transformation for Enhanced Recognition of Born-Digital Word Images”
[13] 1 PM.Deborah. P ,C.Soniya Prathap.M.E “Detection of Fake currency using Image Processing” in IJISET - International Journal of Innovative Science,
Engineering & Technology, Vol. 1 Issue 10, December 2014.
[14] Manpreet Kaur, Spardha Sethi “Evaluating The Short Comings of Edge Detection Techniques” in IJSRD - International Journal for Scientific Research &