A Latent Trust Discovery Algorithm Based on Optimization of
Trust Network
Mei-yu FANG
1,*, Bing-lin YANG
1and Qi-bei LU
21School of Science and Technology, Zhejiang International Study University, Hangzhou, China 2School of Business Administration, Zhejiang Gongshang University, Hangzhou, China
*Corresponding author
Keywords: Latent trust, Trust view, User-to-commodity trust.
Abstract. Trust networks can be divided into user-to-user and user-to-commodity trust
sub-networks. In those networks, it can be distinguished two kinds of classical trust relationships such as functional trust and referral trust. In fact, there is a third invisible trust relationship which we call latent trust. We propose the discovery algorithm to find the latent trust and compute the trust value of user-to-commodity trust which can help customers to directly make the final purchase decisions. Experiment results with the extended Epinions’ dataset illustrate that this algorithm has a better performance than other similar algorithms.
Introduction
Trust, as a means of social interaction, has attracted significant research interest in recent years[1,2]. Guha [3], Liben-Nowell[4] and Zhang[5] et al. proposed TP algorithm, Neighbour(CN) algorithm and SP(Statistical inference problem) algorithm. Their “propagation” concept and probabilistic trust propagation model have better performance than before. Bur its direct inference and calculation on the information of OSNs usually make the trust network too complicated to be obtained and difficult to be maintained. Its statistical process is subject to probabilistic randomization, and its performance results are poor. In addition, the earlier studies dealt with the unobserved trust in the network based on the user (u-u) trust type rather than user-to-commodity (u-c) ones. For example, Guha et al. [3] proposed u-u trust and distrust prediction algorithm which remains a cornerstone study in trust prediction literature [2].
In our opinion, two actors (i.e., a user and a commodity) and two trust relationships (i.e., user-to-user (u-u) and user-to-user-to-commodity (u-c)) are involved in the e-commerce application field. They play important different roles for forming the trust network. u-u trust relationships are bidirectional, u-c trust relationships are unidirectional. User-to-commodity’s trust degree determines the user’s purchase decision. In order to find out the invisible trust and simplify the trust network, the key point is determining the u-c trust network and calculating the similarity, reputation, differences of users’ reputation.
The rest of this paper is organized as follows. Section 2 reviews the related work and concepts in the literature. Section 3 presents our algorithms. Section 4 presents the design of an experiment on a real OSN dataset. Section 5 concludes this paper and suggests future work.
Related Work
BasicConcepts
individual-to-local trust (sometimes called local trust or local reputation in other literature [1]), whereas reputation expresses the possibility of a kind of global result. When we call the jth user uj,
let 𝑅𝐸𝑃𝑢𝑗 denote the global reputation of uj, 𝑡𝑟𝑢𝑖𝑗 denote the trust degree of the ith neighbour to uj.
𝑅𝐸𝑃𝑢𝑗aggregates all 𝑡𝑟𝑢𝑖𝑗from all uj’s neighbours who trust uj. If the uj’sith neighbour node ui trusts
uj, then the value of 𝑡𝑟𝑢𝑖𝑗 equals 1. Otherwise, this value equals ˗1. Let m represent the total number
of uj’s neighbours notably, 𝑅𝐸𝑃𝑢𝑗 produces a fuzzy result between ˗1 and 1.
𝑅𝐸𝑃𝑢𝑗 = ∑ 𝑡𝑟𝑢𝑗
𝑖
𝑚 𝑖, 𝑗 = 1,2, … … , 𝑚 (1)
Trust Network
Trust network is divided into u-u sub network and u-c sub network. The u-c sub network is made of the users, the commodities and the functional trust relationships from the users to commodities. In the trust network, users both trust users and trust products, u-u sub network and u-c network interwoven together and cannot be separated completely.
Latent Trust and Its Formation Mechanism
This study extends Jiang’s definition [7] (referral trust and functional trust) and adds a type of trust relationship called latent trust. Functional trust represents the trust ability of a target from his direct neighbour. Referral trust represents the ability to directly recommend a suitable target, whereas latent trust represents the ability to indirectly recommend a suitable target.
Latent Trust Discovery Algorithm
Generating a Trust View(GTV)
When the user number increases, the complexity of the trust network clearly becomes difficult to control and we can’t traverse all paths. We introduce trusted view in this study. The initial trust network will be created based on acquaintance circle, and then all the trust relationships from START to TARGET in e-commerce system will be added. Through processing a large social network into a small one (PSN), we generate the trust view (GTV processes) to optimize the complex trust network.
Two conditions should be met to build a trust network from START to TARGET. First, numerous short paths for the two given nodes are determined as much as possible, which is a typical breadth-first search. For each step, the breadth-first search method was used to discover the trusted acquaintance chains. Trust information was added between the directly connected nodes.
Algorithm 1: Trust View Generating Algorithm GTV(START, TARGET) 1: Input: START nodes set Nstart; TARGET; a trustor; a trustee.
2: Output: Set P∗( a trusted path set of trust view) 3: n ←L−1. Let START be the start trust node. 4: for each neighbour u in Nstart of current node do 5: if u is TARGET then get a path p, add p into P*. 6: else
7: if n >0 then add all nodes into Nstart. n ←n – 1 end if 8: end if
9: end for
10: for each path p in P* do
11: if the length of p is bigger than L, Delete p.
12: if the trust value of p (sum of every trust value on the path p) is lower than th. Delete p. 13:end for
Latent Trust Computation Algorithm
Hypothesis that TNk makes a bridge and form a latent trust for ui and cj. For computing the latest trust value from user ui to commodity cj, we firstly adopt GTV to generate the trust view TVk from ui to uk who trusts cj; then compute the latent u-u trust value LTi,k which is the latent trust value from ui to uk. Finally, our objective is to obtain the u-i latent trust value LTi,k,j from user ui to commodity cj.
Commodity cj’s functional trustor set is F*. F*= {f1, f2, ……,fn} (n is the number of functional
trustors of cj). For each node fk(k<=n), we create a trust view TVi,k between ui and fk. Let P*
represent the set of paths, and LTi,k represent the trust value computed for all path of P* according
to Equation (2). Given the kth path: psk,psk∈ 𝑃 ∗,i∈ 𝑁, i is less than the length of P*, P* is the path
set of TV, the latent trust from ui to cj is created through the bridge TVi,k by GTV.
𝐿𝑇𝑖,𝑘 = ∑ 𝑡𝑟𝑝𝑠𝑘
𝑚 =
∑ ∏ 𝑝(𝑛𝑘 𝑖,𝑛𝑗)
𝑚 (2) Deriving the value of LTi,k is the second element for computing LTi,k,j. Let 𝑡𝑟𝑝𝑠𝑘denotethe kth
path’s trust value; In accordance with the principle of trust transfer attenuation, 𝑡𝑟𝑝𝑠𝑘= ∏ 𝑝(𝑛𝑖, 𝑛𝑗) . ∏ 𝑝(𝑛𝑖, 𝑛𝑗)denotes the value by multiplying every edge’s priority p(i,j) on the path psk.
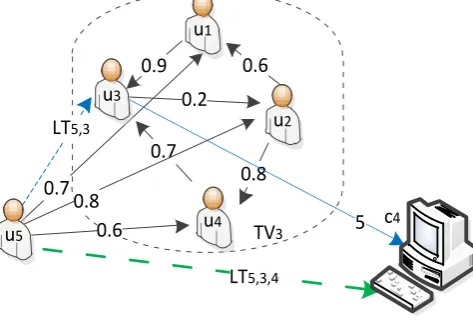
In Figure 1, suppose i = 5, j = 4, after GTV processing, the priority between each node on the trust view is shown as the circle in Figure3. Ψ = {p1, p2, p3, p4}. p1 starts from u5 to u1 and then to
u3; p2 starts from u5 to u2, and then to u1 and ends with u3; p3 starts from u5 to u4, ends with u3; and
p4 starts from u5 to u2, to u4, to u3.
Figure 1. Trust View Example.
0.9 0.6
0.2
0.7
0.8
0.6 5
0.7 0.8
TV3
LT5,3
LT5,3,4
u1
u3
u2
u4
u5 c
[image:3.595.177.414.573.735.2]trk,j is the trust value between user uk and commodity ck. rak,j is the rate at which user k reviews
commodity cj. For the consistency with trust value in the range of [0, 1], rak,j is processed to trk,j
using the following formula.
trk,j =
𝑟𝑎k,j
max𝑘≤𝑛,𝑗≤𝑛𝑟𝑎k,j
(3)
If ∃𝑢𝑘, which is the bridge between ui and ij, LTi,k,j can be obtained as follows:
𝐿𝑇𝑖,𝑘,𝑗 = 𝑅𝐸𝑃𝑢𝑘× 𝐿𝑇𝑖,𝑘 × 𝑡𝑟𝑘,𝑗 = {
0 𝑅𝐸𝑃𝑢𝑗 < 0
𝑅𝐸𝑃𝑢𝑘 × 𝐿𝑇𝑖,𝑘× 𝑟𝑎𝑘,𝑗
𝑚𝑎𝑥𝑘≤𝐿𝑈,𝑗≤𝐿𝐼𝑟𝑎𝑘,𝑗𝑅𝐸𝑃𝑢𝑗 ≥ 0
(4)
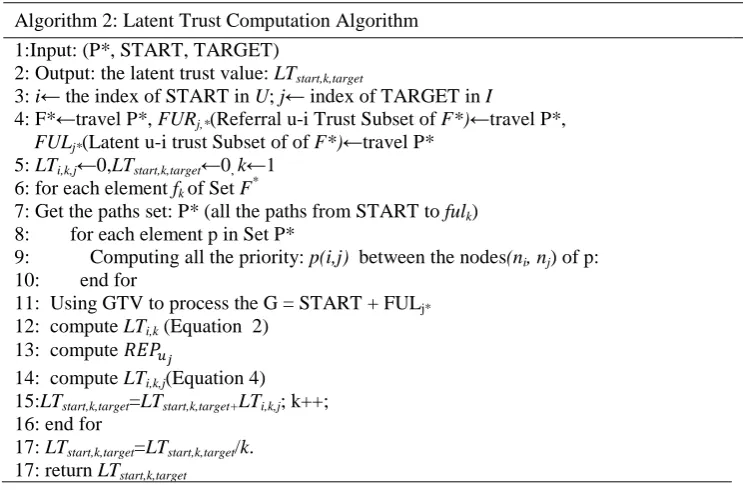
[image:4.595.109.481.294.539.2]In the following LTCA algorithm (Table 2), the START is the user node, whereas the TARGET is the commodity node. p is an element of P*, P* is composed of all the nodes on path p. Latent trust computation algorithm is as follows:
Table 2. Latent Trust Computation Algorithm (LTCA):LTstart,k,target.
Algorithm 2: Latent Trust Computation Algorithm 1:Input: (P*, START, TARGET)
2: Output: the latent trust value: LTstart,k,target
3: i← the index of START in U; j← index of TARGET in I
4: F*←travel P*, FURj,*(Referral u-i Trust Subset of F*)←travel P*,
FULj*(Latent u-i trust Subset of of F*)←travel P*
5: LTi,k,j←0,LTstart,k,target←0, k←1 6: for each element fk of Set F*
7: Get the paths set: P* (all the paths from START to fulk)
8: for each element p in Set P*
9: Computing all the priority: p(i,j) between the nodes(ni, nj) of p:
10: end for
11: Using GTV to process the G = START + FULj* 12: compute LTi,k (Equation 2)
13: compute 𝑅𝐸𝑃𝑢𝑗
14: compute LTi,k,j(Equation 4)
15:LTstart,k,target=LTstart,k,target+LTi,k,j; k++;
16: end for
17: LTstart,k,target=LTstart,k,target/k.
17: return LTstart,k,target
Experiments and Performance Evaluation
Experimental Design
Data Set of Experiments. We used the data set which is called Extended Epinion dataset [8]; it
was experimented and verified in the literature [4, 7, and 9] for trust prediction studies. The data set contains 132,000 users who have issued 841,372 statements (717,667 trusts and 123,705 distrusts), 1,560,144 articles, and 13,668,319 article ratings.
Data Pre-process. User rating data contains u-u trust network information which provide the u-c
trust data. So the u-u and u-c trust networks can be immediately created. Using the Article Author information, all the priorities among all trustors and trustees can be calculated according to TALT algorithm [10]. For convenience, the former 63,000 rows of trust/distrust information and 67,000 rows of the user_rating_data are selected for the initial data set. Approximately 931 pairs of ui to uk
relationships can then be filtered out for research. All these ui to uk relationships can form millions
experiments by LTCA algorithm.
Metric Evaluation and Comparison of Algorithms
Evaluation Metrics. For the evaluation metrics’s definitions include MAE,MAE01,TPP, Recall
and Fscore, Please see literauer [10].
Parameter Settings and Algorithm’s Stability Performance. In the parameter setting
experiments, MAE first appears to decrease and then increase. The value of MAE is 0.134 which is the minimum value when α = 0.739 and β = 0.259.
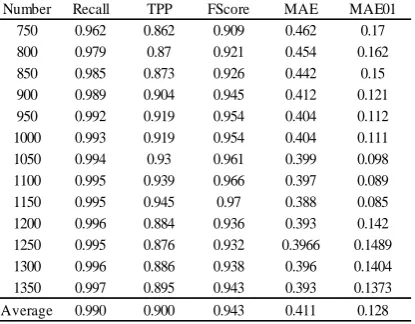
[image:5.595.92.300.312.474.2]The metric trends of Recall1, TP1, FScore1, MAE1, and MAE01 are shown in Figures 2 (b). They fluctuate according to the number of trust relationships, the detailed metric values are shown in Figure2 (a). When the participating number of trust relations in the experiment is under 900, the various performance of the algorithm is not very stable; when the participating number of trust relations in the experiment is over 900, with the number of involved experiments the trust relationship tends to increase, Recall, TPP and FScsore became stable and improved slightly, and MAE and MAE01 tended to be stable and slightly reduced. Seen from the chart below, Recall tends to be more than 0.9, the error rate of MAE01 tends to be below 0.2.
Figure 2. LTCA Algorithm’s stability performance.
Performance Comparison. Experiments are performed to compare the proposed LTCA
algorithm with other three algorithms
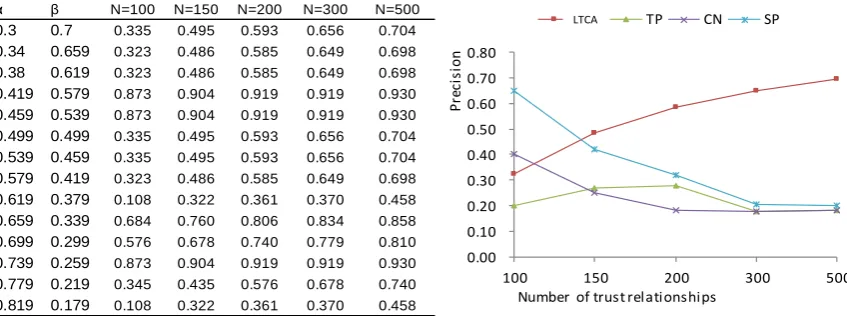
(TP, CN, and SP). MAE is almost fixed when th varies. MAE01 changes largely and unstably. LTCA runs best when th = 0.5. It can be observed that LTCA outperforms all other algorithms when N is greater than 150(Figure 3). Here, in Figure 3(b). It appears that LTCA achieves the best top-N precision when the parameters are set to α = 0.739, β = 0.259 . For TP, CN and SP, we search their parameters space for the settings that give the best top-N precision (TPP in our article). It can be observed that LTCA outperforms all other algorithms when N is greater than 150.
Number Recall TPP FScore MAE MAE01
750 0.962 0.862 0.909 0.462 0.17
800 0.979 0.87 0.921 0.454 0.162
850 0.985 0.873 0.926 0.442 0.15
900 0.989 0.904 0.945 0.412 0.121
950 0.992 0.919 0.954 0.404 0.112
1000 0.993 0.919 0.954 0.404 0.111
1050 0.994 0.93 0.961 0.399 0.098
1100 0.995 0.939 0.966 0.397 0.089
1150 0.995 0.945 0.97 0.388 0.085
1200 0.996 0.884 0.936 0.393 0.142
1250 0.995 0.876 0.932 0.3966 0.1489
1300 0.996 0.886 0.938 0.396 0.1404
1350 0.997 0.895 0.943 0.393 0.1373
Average 0.990 0.900 0.943 0.411 0.128
(a)The detail values of Recall, TPP, FScore, MAE, MAE01 (b) Metrics value curve of LTCA Algorithm
0 0.2 0.4 0.6 0.8 1 1.2
M
e
tr
ic
s
'
v
a
lu
e
Number of Trust Relationships
Recall TPP FScore
Figure 3. Top-K precision comparison of LTCA, TP, CN and SP.
Conclusion and Future Work
This LTCA directly uses the fuzzy u-c trust value to predict the u-c trust value without defuzzification so that it avoids losing useful information from the source data. Our main future work is to obtain a lower MAE and design a new trust recommendation method that can overcome sparse data.
Acknowledgements
This research was financially supported by the Zhejiang Basic Public Welfare Research Project (No: LGF19G020002).
Reference
[1] Parikh, P., Gupta, M., & Varma, V. Tapping Community Memberships and Devising a Novel Homophily Modeling Approach for Trust Prediction. Pacific-asia Conference on Knowledge Discovery & Data Mining Vol.10, 2018, pp. 231-243.
[2] Wang J, Zhang S, Xiao L, et al. A novel collective matrix factorization model for recommendation with fine-grained social trust prediction[J]. Concurrency & Computation Practice & Experience, 2017, 29(6):e4233.
[3] Ramanathan V. Guha, Ravi Kumar.PrabhakarRaghavan, and Andrew Tomkins. Propagation of trust and distrust. In Proceedings of the 19th International Conference on World Wide Web, 2004; pp. 403–412.
[4] Liben-Nowell, D, Knipe, C,Coalson, C. Indifferent Attachment: The Role of Degree in Ranking Friends. 2013 IEEE/ACM International Conference on Advance in Social Networks Anabasis and Mining, Aug. 25-28, 2013, pp. 1416-1417.
[5] Richong Zhang, Yongyi Mao. Trust Prediction via Belief Propagation. ACM Transactions on Information Systems. Volumn. 32, June 2014, pp. 15:10-15:27.
[6] F. Liébana-Cabanillas, R. Nogueras, L.J. Herrera, A. Guillén. Analysing user trust in electronic banking using data mining methods. Expert Systems with Applications. Volume 40, Issue 14, 15 October 2013, pp. 5439-5447.
α β N=100 N=150 N=200 N=300 N=500
0.3 0.7 0.335 0.495 0.593 0.656 0.704
0.34 0.659 0.323 0.486 0.585 0.649 0.698
0.38 0.619 0.323 0.486 0.585 0.649 0.698
0.419 0.579 0.873 0.904 0.919 0.919 0.930
0.459 0.539 0.873 0.904 0.919 0.919 0.930
0.499 0.499 0.335 0.495 0.593 0.656 0.704
0.539 0.459 0.335 0.495 0.593 0.656 0.704
0.579 0.419 0.323 0.486 0.585 0.649 0.698
0.619 0.379 0.108 0.322 0.361 0.370 0.458
0.659 0.339 0.684 0.760 0.806 0.834 0.858
0.699 0.299 0.576 0.678 0.740 0.779 0.810
0.739 0.259 0.873 0.904 0.919 0.919 0.930
0.779 0.219 0.345 0.435 0.576 0.678 0.740
0.819 0.179 0.108 0.322 0.361 0.370 0.458
(a) Top_N performance value of each algorithm under different α,β (b) Top-K precision comparison curves
0.00 0.10 0.20 0.30 0.40 0.50 0.60 0.70 0.80
100 150 200 300 500
P
re
ci
si
o
n
Number of trust relationships
UITP TP CN SP
social networks. Future Generation Computer Systems. 2014, pp. 48–58.
[8] Wintersong. http://www.datatang.com/data/11850. Copyright © 2011-2014 datatang.com. Oct, 25, 2011.
[9] R. Marimon, J.P. Nicolini, and P. Teles. Competition and reputation. In Proceedings of the World Conference Econometric Society. Seattle, 2000, pp. 121-130.