Community Discovery Algorithm Based on Ant Colony and
Signal Transfer
Wenjie Li
*, Xiaoming Yu
Key Laboratory of Ministry of Education, Tianjin Key Laboratory of Intelligence Computing and Novel Software Technology, Tianjin University of Technology, Tianjin, China.
* Corresponding author. Tel.: 13042276692; email: [email protected] Manuscript submitted October 13, 2017; accepted March 19, 2018. doi: 10.17706/jcp.13.8 897-904.
Abstract: With continuous emergence of social network platforms, the research of complex network has become a hot field. Complex networks have an obvious feature of community structure, which could be used to study other network characteristics. However, how to better research community structure also becomes a problem that scholars have been exploring. Detecting community structure contributes to analyzing networks to futher discover its implicit patterns. This paper proposes an community discovery algorithm that combines foraging model of ant colony algorithm and signal transmission mechanism to detect overlapping communities. Ants will release pheromones to guide other partners to find the optimal solution, meanwhile pheromones will evaporate at a certain probability. On the other hand, some signals will be lost during transmission. We apply the mechanism of signal loss to process of pheromone evaporation, and consider the similarity between ants to construct ant transfer matrix. Through above two aspects, ant colonies will choose a better walking strategy. In this way, our algorithm can get better division results by adopting above strategy. What’s more, our experiment results indicate that our proposed algorithm could obtain a higher modular value Qov and NMI (Normalied Mutual Information) value, which shows very excellent
performance in discovering overlapping communities.
Key words: Complex network, community detection, ant colony algorithm, signal transfer, walking strategy.
1.
Introduction
Nowadays, virtual communities and social platforms have gradually penetrated into our lives and actual production [1]. In this context, how to better analyze social network structure has become a hot topic of current research. Community discovery is a basic task of social network analysis, which is used to study various network phenomena [2]. It is well known that complex networks have common properties: scale-free property, small world property [3], community structure characteristics [4], [5].
Community discovery is a division of real social network, which has become an important subject of social science, physical science, biological science and computer science [6]. In 2005, Palla proposed a CPM algorithm for mining overlapping communities. Subsequently, Palla designed a software CFinder [7]. After that, COPRA algorithm is proposed by Steve Gregory [8], [9]. Shen [10] et al proposed EAGLE algorithm, and Fuzzy clustering method was also applied to overlapping community discovery [11]. Reza [12] proposed a SATOCI algorithm based on intelligent swarm. As in [13], ant colony algorithm is proposed to detect overlapping community structure through ant colony foraging model.
system was first proposed by Italy scholars Dorigo, Maniezzo and others in 1990s [16]. Individuals in social networks communicate information with each other to form communities, and individuals in the same community have similar information [17]. References [18], [19] have proposed signal transmission method.
This paper combines the idea of signal transfer loss and ant colonies foraging model to detect overlapping communities. Pheromone released by ant colonies will evaporate at a certain probability, which is similar to the phenomenon that some signal will loss in transmission process. We apply signal transfer into ant colonies foraging model to optimize our algorithm. And here we consider similarity between ants as another factor to construct transition matrix. In this way, we could get better division results by the optimal strategy.
2.
Theory Analysis
2.1.
Ant Colony Foraging Model Analysis
In the process of searching food, ant colonies will release a substance called pheromones. Ants in ant colonies are sensitive to pheromones, and they walk along higher concentrations of pheromones. It’s common that ant colonies are not only affected by pheromones, but also by obstacles and other ants. Ant colony algorithm adopts the positive feedback mechanism, so that search process converges continuously and finally approaches the optimal solution.
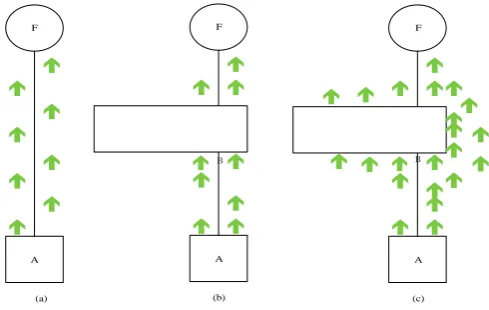
As shown in Fig. 1, there are a group of ants, assuming that A is ant nest, and F is food source. Under normal conditions (Fig. 1 (a)), ants at A will walk along straight lines to find food. If there is an obstacle between A and F (Fig. 1 (b)), then ant will make a decision at B point, left or right. At first, the probability that ants walk in two directions is same because there are no pheromones left by other ants. As time goes on, ants in front will leave pheromones on the road and ants in the back will choose strategy by these pheromones. In this way, more and more ant colonies walk along the shortest path, and at the same time, pheromone on this path becomes more and more dense.
F
A
F
A
F
A
(a) (b) (c)
B B
Fig. 1. Ant colony foraging model.
2.2.
Signal Transmission Theory Analysis
According to signal transduction mechanism, we suppose that a network with n nodes is
}
,...,
,
{
V
1V
2V
mV
. Here for any nodeV
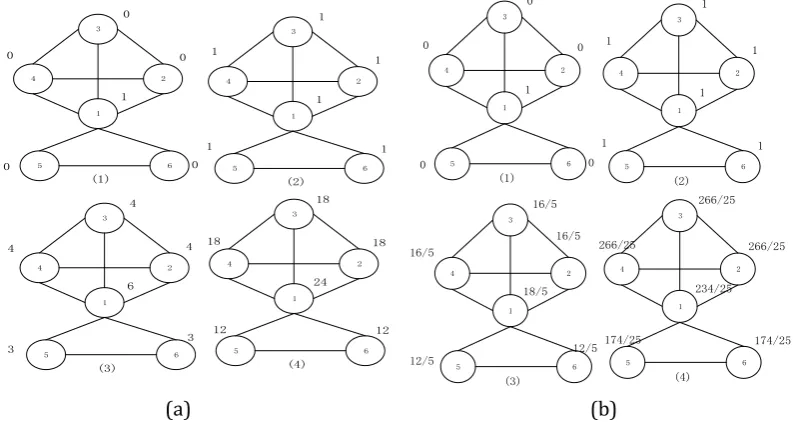
i V
that has the ability to send, receive and record signals. Each node only transmits signals to itself and neighbor nodes, and signals that receive from others can be transmitted in turn. The specific signal transfer process is shown in Fig. 2 (a) below:nodes is 1; Similarly, each node passes signal value to neighbor nodes and itself respectively in Fig. 2 (a) (3) (4).
The above procedure is expressed as follows:
( ) ( )T
V T AI (1) Here, A represents adjacency matrix, T indicates iteration number and T={1,2,3,...}, I is unit matrix. As shown in Fig. 2 (b), we could get the vector (1,1,1,1,1,1) by V(1)=(A+I) where T=1; the vector is (6,4,4,4,3,3) by V(2)=(A+I)2 where T=2; and the final vector is (24,18,18,18,12,12) by V(3)=(A+I)3 where T=3. This final vector represents impact of initial node 1 on the entire network after the end of three signal transmission.
Let we define probability that node j receive signals of node i and its formula is as follows:
( , ) 1 i
d p j i
n
(2)
where di stands for degree of node i and n denotes the number of nodes. The adjacency matrix of the
network is
A
{
A
1,
A
2,...,
A
n}
,A
i
{
a
i1,
a
i2,...,
a
in}
(i=1,2,...,n). If there exists edge between i and j, aij=1. Otherwise aii=0 when i=j. Meanwhile, signal loss matrix is defined asP
{
P
1,
P
2,...,
P
n}
,(i=1,2,...,n). According to (2), each element in the loss matrix is defined as
P
i
p
(
j
,
i
)
A
i. Thus finalmatrix after transmission in the case of signal loss is as follows:
I p
A p
V T T1... (3) By (3), a set of nodes after passing T times is obtained:
{
,
',...,
'}
2 ' 1 ' n
V
V
V
V
, where}
,...,
,
{
'1 '2 ' 'in i i
i
v
v
v
V
. In order to further obtain its relative influence quantity, we normalize it as },..., ,
{ i1 i2 in i f f f
F , where
n j ij ij ij v v f 1 ' ' 2. Fi represents the impact of node i on entire network, so we
convert topology map into n-dimensional vectors. Fig. 2(b) shows the final result in case of signal loss:
3 1 4 2 5 6 1 0 0 0 0 0 (1) 3 1 4 2 5 6 1 1 1 (2) 3 1 4 2 5 6 6 4 4 (3) 3 1 4 2 5 6 24 18 18 (4) 1 1 1 4 3 3 18 12 12 3 1 4 2 5 6 1 0 0 0 0 0 (1) 3 1 4 2 5 6 1 1 1 (2) 3 1 4 2 5 6 18/5 16/5 16/5 (3) 3 1 4 2 5 6 234/25 266/25 266/25 (4) 1 1 1 16/5 12/5 12/5 266/25 174/25 174/25
2.3.
Improved Ant Colony Walking Strategy
Here an ant colony guide model is proposed to measure influence of ant colonies, which can be described from two aspects: ant neighbours and their edge relation. The formula for measuring similarity between ants is as follows:
) , ( )) ( ( )) ( ( )) ( ( )) ( ( ) 1 ( ) ( ) ( ) ( ) ( j i E j N E i N E j N E i N E j N i N j N i N
sij
(4)
Here first part describes neighbor nodes, N(i) and N(j) represent neighbor nodes of i and j respectively. |N(i)∩N(j)| represents the number of common neighbors for node i and j. |N(i)∪N(j)| denotes the number of all neighbors of i and j. In second section, E(N(i)) and E(N(j)) represent sets of neighbors’ edges of i and j respectively. |E(N(i))∩E(N(j))| stands for the number of common edges between neighbors of i and j, and |E(N(i))∪E(N(j))∪E(i,j)| is the number of all edges in the graph.
Next, we construct ant colonies transition matrix by combining pheromone and similar guidance. Walking transition matrix is defined here
M
m
(i
,j
)
k*k, where element m(i,j) is obtained by followingtwo cases: (1) j ∈ N(i);
Under this case, elements are calculated according to the following formula:
) ( ) )( ( ) )( ( ) , ( i N o ij io ij ij s f s f j im
(5)
(2) j is not exist in N(i);
Under this case, element m(i,j)=0.
In formula (5), fij stands for pheromone and is calculated by (3). sij is similarity between ants by (4). Here
λ and μ represent weights of pheromone and similar guidance, and these two values usually determine the search performance of algorithm.
3.
Algorithm Description
Overlapping community detection algorithm (Ant-Singal Algorithm) based on ant colony and signal transmission is proposed in this paper, including following processes:
Table 1. Ant-Signal Algorithm Description Input: Initialized ant colonies:G=(V,E),T,n,f,α;
Output:Overlapping community results:C
1.Ant colony location initialization;
2.Calculate colony pheromones according to formula (3); 3.Calculate similarity of similar ants according to formula (4); 4.Construct ant colony transfer matrix according to formula (5); 5.Start for t=1 to T
for i=1 to n
Each ant chooses the walking strategy according
to the transfer matrix;
Update pheromone and similarity on edge; End for
End for
4.
Experimental Design
4.1.
Datasets and Evaluation Criterion
Our experimental datasets include two real data sets and a simulated data set. And these two real datasets are Zachary karate club and dolphin network. Zachary's Karate Club [20] data set is one of small community structure networks commonly used in complex networks. Dolphin Social Networks [21] is more complex than Zachary network, including 62 nodes and 159 edges. Artificial analog network LFR [22] is an extension of GN networks.
Here we adopt modular Qov value [23] as criterion to evaluate performance of our algorithm. For
networks generated by LFR simulations, we adopt extended NMI (Normalied Mutual Information) to measure the accuracy of algorithms for mining communities.
4.2.
Results and Analysis
In order to validate the overlapping community detection algorithm based on ant colonies and signal (AntSigA), we compare our proposed algorithm with classic COPRA algorithm and CPM algorithm.
The following Table 2 shows basic description of Karate Club data sets and Dolphin data sets:
Table 2. Datasets Description
DataSets Vertice Edge Average k Value Community
Karate
Dolphins 34 62
78 159
4.5 5.1
2 2
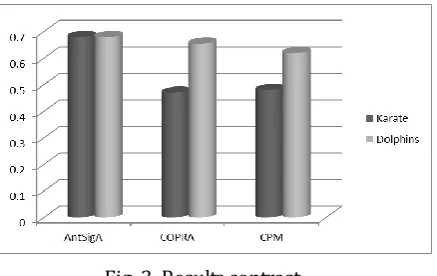
Through above experiments, we obtain modular values of three algorithms on two real datasets. Results are shown in Table 3:
Table 3. Results Description
DataSets AntSigA COPRA CPM
Karate
Dolphins 0.68 0.68
0.47 0.655
0.48 0.62
Table 3 describes Qov value results of AntSigA algorithm and other two algorithms in real datasets. In
order to make a clearer comparison of results, we draw above results into Fig. 3:
Fig. 3. Results contrast.
It’s clearly that Qov value of AntSigA algorithm is higher than that of COPRA algorithm and CPM algorithm.
Table 4. Parameter Setting in LFR
DataSets N μ Community Size
On Om
LFR1 LFR2
LFR3 100 100 500
0.1 0.3 0.1
2,10 2,10 2,10
10 10 50
2,3,4,5 2,3,4,5 2,3,4,5
Here N is the number of nodes; μ is a mixed parameter that represents connection rate of a node with other nodes in same community, and here μ is setted to 0.1 or 0.3; The smallest size of community is 2 and the largest is 10; On stands for number of overlapping nodes in a network; Om stands for the number of
communities that overlapping nodes belong to , here are 2, 3, 4, 5.
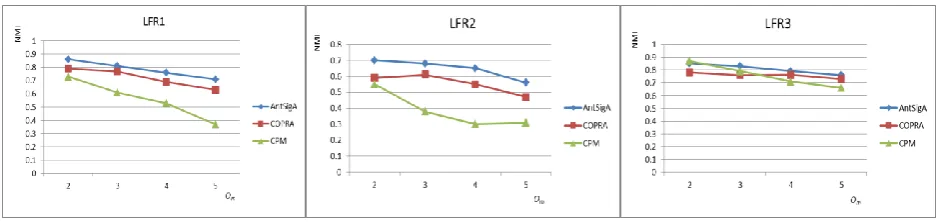
Fig. 4. Results contrast in LFR1, LFR2, LFR3.
On the whole, NMI value of AntSigA algorithm is higher than other two algorithms' NMI values by combining with Fig. 4, and the performance of our algorithm is also relatively excellent. Separately, Fig. 4 where in LFR1 and LFR3 are case of μ=0.1, and NMI decreases as the number of communities increases where overlapping nodes exist in. In Fig. 4 where in LFR3, the NMI value of AntSigA algorithm is similar to value of CPM when Om=2. In other words, CPM will be better suitable for discovering community structures
when Om is small, but its performance will gradually decrease as Om grows. Additionally, NMI values of
three algorithms are higher when the ambiguity is 0.1 in LFR1, LFR2 where μ=0.1, μ=0.3.
5.
Conclusion
This paper analyzes and summarizes existing community detection algorithms, and proposes an overlapping community detection algorithm based on ant colonies and signal transfer for overlapping community partition. Firstly, the ant foraging model is analyzed. In process of walking, ants will release pheromones to guide other partners to select the optimal path. However, these pheromones will evaporate at a certain probability, which will affect the change of selection strategy. Secondly, we analyze the mechanism of signal transmission: some signals will be lost during transmission. Based on above two aspects, this paper applies mechanism of signal loss to the process of pheromone evaporation. Thus, we further construct the walking transition matrix, and ants will reach the destination through guidance of the selected strategy. Finally, overlapping community division results are obtained by above process.
The following work focuses on solving two problems. How to apply our algorithm to large-scale networks needs to be studied. At the same time, dynamic community discovery has a wide range of applications, how to divide dynamic community is also an important problem.
Acknowledgment
Excellent Talents in University of China (No.NCET-09-0895), Key project of Ministry of Education of China (No.208010), Tianjin Natural Science Foundation (No.10JCYBJC00500), Tianjin Key Natural Science Foundation (No.13JCZDJC34600), Training plan of Tianjin University Innovation Team (No.TD12-5016).
References
[1] Shize, G., & Zheming, L. (2012). Basic Theory of Complex Networks. Beijing: Science Press.
[2] Xiaojia, L., Peng, Z., & Zengru, D. (2008). Community structure in complex networks. Complex Systems and Complexity Science, 5(3), 19–42.
[3] Xu, X., Jiawei, L., & Yuantong, G. (2012). Yuantong gu. collective dynamics and control of a 3-d small-world network with time delays. International Journal of Bifurcation & Chaos, 22(11), 114101. [4] Xiaofan, W. (2006). Complex Network Theory and Its Applications. Beijing: Tsinghua University Press. [5] Todd, R. M., & Anderson, A. K. (2009). Six degrees of separation: The amygdala regulates social
behavior and perception. Nature Neuroscience, 12(10), 1217.
[6] Jinqing, F. (2005). Research and challenges of rapidly evolving complex networks. Nature Magazine, 27(5), 269-273.
[7] Palla, G. (2006). CFinder: Locating cliques and overlapping modules in biological networks. Bioinformatics, 22(8), 1021-1023.
[8] Gregory, S. (2010). Finding overlapping communities in networks by label propagation. New Journal of Physics, 12(10), 2011-2024.
[9] Chen, I., Zaiane, O. R., & Goebel, R. (2009). Detecting communities in large networks by iterative local expansion. Proceedings of the International Conference on Computational Aspects of Social Networks: IEEE Computer Society (pp. 105-112).
[10]Shen, H., Cheng, X., & Cai, K. (2009). Detect overlapping and hierarchical community structure in networks. Physica A Statistical Mechanics & Its Applications,388(8), 1706-1712.
[11]Esquivel, A. V., & Rosvall, M. (2011). Compression of flow can reveal overlapping-module organization in networks. Physical Review X, 1(2), 1668-1678.
[12]Badie, R., Aleahmad, A., Asadpour, M., & Rahgozar, M. (2013). An efficient agent-based algorithm for overlapping community detection using nodes’ closeness. Physica A Statistical Mechanics & Its Applications, 392(20), 5231-5247.
[13]Zhou, X., Liu, Y., Zhang, J., Liu, T., & Zhang, D. (2015). An ant colony based algorithm for overlapping community detection in complex networks. Physica A Statistical Mechanics & Its Applications, 427, 289-301.
[14]Dorigo, M., Maniezzo, V., & Colorni, A. (1996). Ant system: Optimization by a colony of cooperating agents. IEEE Transactions on Systems Man & Cybernetics Part B Cybernetics A Publication of the IEEE Systems Man & Cybernetics Society, 26(1), 29.
[15]Zhenyu, G. (2015). Soft Computing Method and Its Military Application. Beijing: National Defense Industry Press.
[16]Dorigo, M., & Gambardella, L. M. (1997). Ant colony system: A cooperative learning approach to the traveling salesman problem. IEEE Transactions on Evolutionary Computation, 1(1), 53-66.
[17]Gang, W., & Guoxiang, Z. (2011). Community discovery algorithm based on information entropy. Computer Science, 38(2), 238-240.
[18]Hu, Y., Li, M., Zhang, P., Fan, Y., & Di, A. (2008). Community detection by signaling on complex networks. Physical Review E Statistical Nonlinear & Soft Matter Physics, 78(2), 016115.
[20]Zachary, W. W. (1977). An information flow model for conflict and fission in small groups. Journal of Anthropological Research, 33(4), 452-473.
[21]Lusseau, D., Schneide, K., Boisseau, O. J., Haase, P., & Slooten, E. (2003). The bottlenose dolphin community of doubtful sound features a large proportion of long-lasting associations: Can geographic isolation explain this unique trait? Behavioral Ecology & Sociobiology, 54(4), 396-405.
[22]Lancichinetti, A., & Fortunato, S. (2009). Benchmarks for testing community detection algorithms on directed and weighted graphs with overlapping communities. Physical Review E Statistical Nonlinear & Soft Matter Physics, 80(2), 016118.
[23]Nicosia, V., Mangioni, G., & Carchiolo, V. (2009). Extending the definition of modularity to directed graphs with overlapping communities. Journal of Statistical Mechanics Theory & Experiment, 2009(3), 3166-3168.
Wenjie Li was born in 1975. He is currently an associate professor at Tianjin University of Technology. His research interests include semantic web, knowledge engineering, intelligent information processing.