Performance Analysis and Comparison of Various
FACTS Devices in Power System
Anulekha Saha
P.G Scholar
Priyanath Das
Associate Professor
Ajoy Kumar Chakraborty
Associate Professor EE Dept., National Institute of Technology Agartala, Jirania, Tripura (west), Pin - 799055, India.
ABSTRACT
This paper investigates the enhancement in voltage stability margin as well as the improvement in the power transfer capability in a power system with the incorporation of Fixed Capacitors, Static Synchronous Compensator (STATCOM) and Static VAR Compensator (SVC). A simple transmission line system is modeled in MATLAB/SIMULINK environment. The load flow results are first obtained for an uncompensated system, and the voltage and real and reactive power profiles are studied. The results so obtained are compared with the results obtained after compensating the system using Fixed Capacitors, SVC and STATCOM to show the voltage stability margin enhancement. The results obtained after simulation demonstrate the performances of shunt capacitor, SVC and STATCOM when connected to a system on the verge of unstability. All the simulations for the above work have been carried out using MATLAB (SIMULINK) software.
Keywords
Voltage Stability, SVC, STATCOM, Fixed Capacitor, FACTS, Active Power, Reactive Power.
1.
INTRODUCTION
Today’s power systems are large, interconnected and involves thousands of buses and hundreds of generators. Power system protection devices also form a large part of the system. Environmental as well as economic factors primarily govern the installation of new power stations and to transport this power, new transmission line constructions are needed to meet the ever increasing load demand. Apart from these factors, new transmission line constructions are expensive and also take considerable amount of time and way of right. Therefore, the generated power to be transported with the existing transmission lines results in compromising with voltage profiles and system stability in most of the cases. Voltage instability is the prime cause of system voltage collapse. Voltage collapse occurs when the system voltage decays to a level from which it is unable to recover. The consequences of voltage collapse involve partial or full power interruption in the system.
One of the main causes of voltage instability in a system is the occurrence of reactive power imbalance in the system. Reactive power imbalance occurs when there is a sudden increase or decrease in reactive power demand in the system. The only way to prevent the occurrence of voltage collapse is either to reduce the reactive power load or to provide the system with additional supply of reactive power before the system reaches the point of voltage collapse. This can be done by connecting sources of reactive power, i.e., shunt capacitors and/or Flexible AC Transmission System (FACTS) controllers at appropriate locations in the system.
Flexible AC Transmission Systems (FACTS) technology help utilities in reducing transmission congestion and in utilizing more efficiently the existing transmission system without compromising the reliability and security of the system. Their fast response offers high potential for power system stability enhancement apart from steady state flow control. The benefits of employing FACTS are aplenty: (a) They help to increase the power transfer capability of existing transmission systems, (b) They can directly control real and reactive power flow, (c) Provide fast dynamic reactive power support and voltage control, (d) Improve system stability and damp power system oscillations, (e) Reduce financial costs and environmental impact by possible deferral of new transmission lines.
FACTS devices have been defined by the IEEE as “alternating current transmission systems incorporating power electronic-based and other static controllers to enhance controllability and increase power transfer capability” [1]. There are five well known FACTS devices namely: Static Var Compensator (SVC), Static Synchronous Compensator, Thyristor Controlled Series Capacitor (TCSC), Static Synchronous Series Compensator (SSSC) and Unified Power Flow Controller (UPFC). Each of them have their own characteristics and limitations. It would be very effective if we could improve voltage stability by incorporating the most beneficial FACTS device for a given operating condition.
1.1 Literature Review
in power system stability enhancement considering a two-area power system. A comparison between shunt capacitor, SVC and STATCOM has been done to show their performance while connected to a Multi-bus system in [8]. STATCOM has been found to provide higher voltage stability margin as well as higher loading margin compared to other FACTS devices [9]. Voltage stability improvement with the incorporation of SVC is studied in [10]. There, the controller has been modeled as variable impedance that changes with the firing angle of the TCR. Voltage regulation and system oscillatory disturbances regulation using SVC has been proposed in [11]. In [12], simulation and comparison of various FACTS devices has been done using PSPICE. [13]–[16] deals with obtaining the optimal location for placing the FACTS devices in a power system. Effectiveness of SVC and STATCOM in improvement of voltage security of a Multi-bus power network has been studied in [17]. The results show that STATCOM can enhance system voltage security in a much better way even at line contingency. [18]–[20] discuss the benefits of employing FACTS devices in electric utilities in detail. An efficient way to increase maximum loadability point regarding size, location and control modes of FACTS devices is presented in [21].
In this paper suitable models have been designed for controlling the FACTS devices by controlling their impedances and also in determining the impedance value for obtaining optimum performance. The variation in the magnitude of real and reactive power with varying impedance values have been tabulated to obtain the best rating of the FACTS devices.
[image:2.595.311.545.69.711.2]2.
SYSTEM MODEL
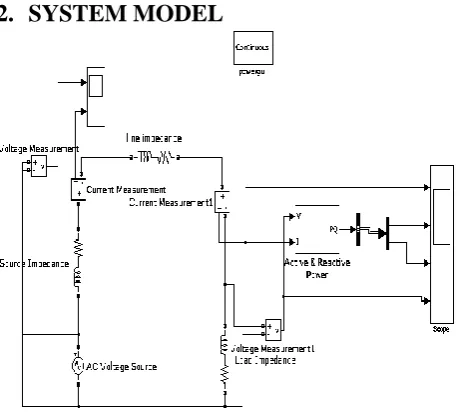
Figure 1: Basic transmission line model
The above diagram shows a simplified model of an uncompensated system. The system is modeled in SIMULINK platform. The model is supplied from an 11 kV voltage source. The line impedance is kept at (10+j0.028) Ω and the load is kept fixed at 30 MW and 60 MVAR. The scopes provided displays the signals generated during the simulation. In the above figure, two scopes are provided: one displays the source voltage and current, and the other displays the Load Voltage (VL), Load Current (IL), Real and Reactive
[image:2.595.318.542.72.376.2]Power at the receiving end. The results obtained after simulation are shown below:
Figure 2: Source Voltage
Figure 3: Source Current
Figure 4: Load Voltage
[image:2.595.313.546.364.688.2] [image:2.595.56.287.405.612.2]Figure 6: Real Power Flow
Figure 7: Reactive Power Flow
The load voltage is found to be 0.945 kV, which is 15.5% below the required voltage. The real and reactive power profiles are also shown. So, in order to keep the system stable, we have to provide adequate compensation to the system. It is an established fact, that voltage stability is dependent on the reactive power. So, if we can improve the reactive power to meet the demand, then we can as well improve the voltage profile of the system to prevent it from dipping below the margin. In this paper, compensation using Fixed Capacitor, SVC and STATCOM are studied and compared to obtain the best compensation for the system under study.
3. COMPENSATED SYSTEM
3.1 Fixed Capacitor Compensated
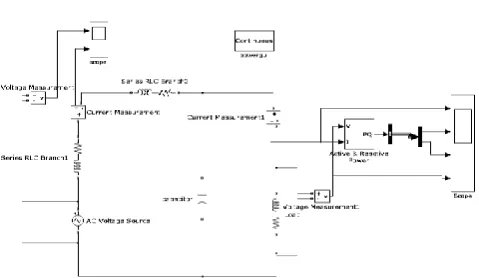
Figure 8: Capacitor Compensated Model
The plots showing the Load Voltage (VL), Load Current (IL),
[image:3.595.316.545.72.376.2]Real and Reactive Powers for the compensated system are shown below:
Figure 9: Load Voltage
[image:3.595.314.544.74.693.2]Figure 10: Load Current
Figure 11: Real Power Flow
Figure 12: Reactive Power Flow
[image:3.595.58.298.558.697.2]Variation of Real and Reactive Power with change in the capacitance is tabulated below:
Table 1: Variation of Real and Reactive Power with the Variation of Capacitance
C(micro F) P(MW) Q(MVAR)
100 0.973 1.886
150 1.223 2.373
200 1.573 2.985
220 1.641 3.261
250 1.975 3.686
350 2.551 4.688
400 2.455 4.568
425 2.350 4.340
450 2.178 4.036
500 1.802 3.338
700 0.828 1.350
1000 0.292 4.800
Thus we see that the real and reactive powers are both improved with the introduction of capacitance. But it is also seen that compensation occurs only upto a certain value of the capacitance (350µF here). Increasing the capacitance beyond this value does not result in any compensation, and the powers are seen to deteriorate beyond that value. Reactive compensation is obtained again for a capacitance value of 1000µF, but again deteriorates on further increase of capacitance. But increased rating means increase in the cost of the equipment too. So we have to find a balanced rating for the capacitor, which is found to be 350µF in this case.
3.2 SVC Compensated System
[image:4.595.319.546.74.396.2]The model of the SVC compensated system is shown below:
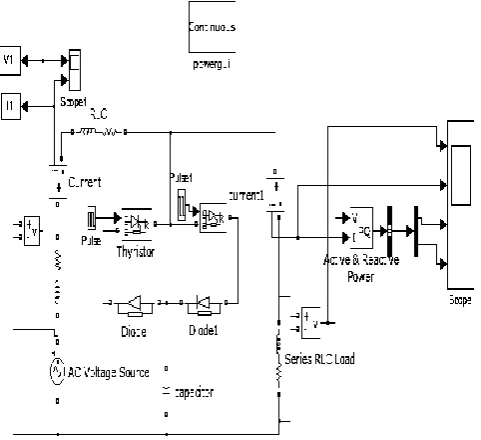
Figure 13: SVC Compensated System
The above figure shows an SVC, modeled in FC-TCR configuration, connected to the system. The Real and Reactive Powers are obtained for a fixed value of capacitance taken to be 100µF and by varying the inductance of the TCR. Plots for a particular case of the compensated system with inductor value 100mH are shown below:
Figure 14: Load Voltage
Figure 15: Load Current
Figure 16: Real Power Flow
Figure 17: Reactive Power Flow
[image:4.595.95.242.131.275.2] [image:4.595.57.302.465.658.2]Table 2: Variation of Real and Reactive Power With the Variation of TCR Inductance
Capacitance (µF)
Inductance (mH)
Real Power (MW)
Reactive Power (MVAR)
100 100 0.026 0.047
100 170 0.031 0.058
100 230 0.032 0.061
100 540 0.034 0.066
100 850 0.0343 0.067
100 1100 0.0344 0.068
100 1500 0.0345 0.068
Thus from the above table we see that both real and reactive powers are compensated to a large extent by incorporating SVC into the system and the power flow improves in direct proportion to the variation of the TCR inductance. Also the receiving end voltage improves considerably with the addition of SVC into the system and helps in keeping the system in stable state. In this case, increasing the TCR inductor value upto 1100mH gives desirable performance.
3.3 STATCOM Compensated System
The SIMULINK model for a STATCOM compensated system is shown below:
Figure 18: STATCOM Compensated System
[image:5.595.318.547.74.381.2]The above figure shows the configuration of the STATCOM model connected to the system. The plots showing the improvement in the Load Voltage, Load Current and Real and Reactive Power are given below:
[image:5.595.65.286.100.210.2]Figure 19: Load Voltage
Figure 20: Load Current
Figure 21: Real Power
Figure 22: Reactive Power
[image:5.595.59.300.380.600.2]voltage profile improves further with increased rating upto a certain point. The change in the power flows is obtained for different values of capacitance:
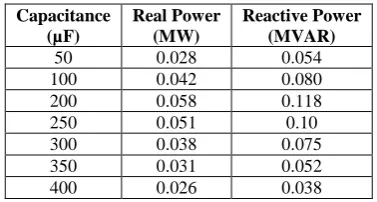
Table 3: Variation of Real and Reactive Power with the Variation of Capacitance
Capacitance (µF) Real Power (MW) Reactive Power (MVAR)
50 0.028 0.054
100 0.042 0.080
200 0.058 0.118
250 0.051 0.10
300 0.038 0.075
350 0.031 0.052
400 0.026 0.038
From the above table, it is seen that, both Real and Reactive power flows are improved impressively upto a capacitor rating of around 200µF. Increasing the capacitance value further deteriorates the power profile.
4. CONCLUSION
It is seen from the above simulation results that both the Power Flow and Voltage profiles are improved with all the compensating devices, but maximum real and reactive power compensation is obtained with the introduction of STATCOM in the system. STATCOM offers better performance in regulating the Voltage Stability of the system. But care has to be taken in determining the rating of the compensating devices in order to make the system stable as well as cost effective. In this paper, the variations in power and voltage profiles with the controller parameter variations have been presented. The results obtained clearly show that in case of fixed Capacitor Compensation, a capacitor value of 350µF will be appropriate, whereas, in case of FC-TCR type SVC, a fixed capacitor value of 100µF and an inductor value of 1100mH yields good results. For the STATCOM, a capacitor rating of 200µF gives best results. This paper presents an elaborate comparison between shunt capacitor, SVC and STATCOM. It will help in determining the appropriate capacitor and inductor values (as the case may be) for achieving optimum performance by the compensating devices.
5. REFERENCES
[1] CIGRE, “FACTS Overview”, IEEE Power Engineering Society, 95 TP 108, April 1995
[2] B. Gao, G.K. Morison, P. Kundur, “Towards the Development of a Systematic Approach for Voltage Stability Assessment of Large-Scale Power Systems,” IEEE Trans. Power Syst., Vol. 11, No. 3, pp. 1314-1324, Aug.1996.
[3] N.G Hingorani & Laszlo Gyugyi, “Understanding FACTS: concepts and technology of flexible AC transmission systems”, IEEE Press, New York (2000).
[4] “Proposed Terms and Definitions for Flexible AC Transmission Systems (FACTS)”, IEEE Transactions on Power Delivery, Vol. 12, No. 4, October 1997.
[5] D.J Hanson, M.L Woodhouse, C. Horwill, D. R. Monkhouse and M. M. Osborne, “ STATCOM: a new
era of reactive compensation,” Power Engineering Journal, June 2002.
[6] Ying Xiao, Y.H. Song, “Power Flow Control Approach to Power Systems With Embedded FACTS Devices,” IEEE Trans. Power Syst., Vol. 17, No. 4, November 2002. [7] D. Murali, Dr. M. Rajaram, N. Reka, “Comparison of
FACTS Devices for Power System Stability Enhancement,” International Journal of Computer Applications (0975 – 8887), Vol. 8, No.4, October 2010. [8] Arthit Sode-Yome and N. Mithulananthan, “ Comparison
of shunt capacitor, SVC and STATCOM in static voltage stability margin enhancement,” IJEEE, , Vol. 41, No. 3. pp. 158-171.
[9] Arthit Sode-Yome, Nadarajah Mithulananthan, “Static Voltage Stability Margin Enhancement Using STATCOM, TCSC and SSSC,” IEEE/PES Transmission and Distribution Conference & Exhibition: Asia and Pacific Dalian, China, 2005.
[10] Mark Ndubuka NWOHU, “Voltage Stability Improvement using Static Var Compensator in Power Systems”, Leonardo Journal of Sciences, Issue 14, p. 167-172, January-June 2009.
[11] Alisha Bang and S.S. Kaushik, “Modelling And Simulation of SVC Controller For Enhancement of Power System Stability”, International Journal of Advances in Engineering and Technology,Vol.1, Issue 3, pp.79-84 July 2011.
[12] S. Shankar, S. Balaji and S. Arul, “Simulation and Comparison of Various FACTS Devices in Power System”, International Journal of Engineering Science and Technology, Vol. 2(4), pp. 538-547, 2010.
[13] M. Kowsalya, K. K. Ray, and D. P. Kothari, “Positioning of SVC and STATCOM in a Long Transmission Line”, International Journal of Recent Trends in Engineering, Vol. 2, No. 5, November 2009.
[14] R. Benabid and M. Boudour, “Optimal Location and Size of SVC and TCSC for Multi-objective Static Voltage Stability Enhancement,” Proceeding of the International Conference on Renewable Energy and Power Systems Quality, ICREPQ’2007, Spain, March. 2008.
[15] P. R. Sharma, “Optimal Location for Shunt Connected FACTS Devices in a Series Compensated Long Transmission Line,” Turk J Elec Engin, Vol. 15, No. 3, 2007.
[16] Syona Chawla, Sheetal Garg and Bhawna Ahuja, “Optimal Location of FACTS Devices for Transmission Line Compensation,” International Conference on Control, Automation, Communication and Energy Conservation, INCACEC 2009. .
[17] Priyanath Das, Sunita Halder nee Dey, Abhijit Chakrabarti and Tanaya Dutta, “A Comparative Study in Improvement of Voltage Security in A Multi-Bus Power System Using STATCOM and SVC,” International Conference on Energy, Automation and Signal (ICEAS), 28-30 Dec. 2008.
on Electromagnetic Compatibility and Electromagnetic Ecology, pp.26-29, 26-29 June. 2007.
[19] M. Noroozian and C. W. Taylor, “ Benefits of SVC and STATCOM for Electric Utility Application,” Transmission and Distribution Conference and Exposition, IEEE PES, Vol. 3, pp. 1192-1199, 7-12 Sept. 2003.
[20] Laszlo Gyugyi, “ Power Electronics in Electric Utilities: Static Var Compensators”, Proceedings of the IEEE, Vol. 76, No. 4, April 1988.