Thermal Management Using Pulsating Jet Cooling
Technology
S Alimohammadi1,2, P Dinneen1, T Persoons1, D B Murray1
1 Department of Mechanical and Manufacturing Engineering, Parsons Building, Trinity College, Dublin, Ireland
E-mail: [email protected]
Abstract. The existing methods of heat removal from compact electronic devises are known to be deficient as the evolving technology demands more power density and accordingly better cooling techniques. Impinging jets can be used as a satisfactory method for thermal management of electronic devices with limited space and volume. Pulsating flows can produce an additional enhancement in heat transfer rate compared to steady flows. This article is part of a comprehensive experimental and numerical study performed on pulsating jet cooling technology. The experimental approach explores heat transfer performance of a pulsating air jet impinging onto a flat surface for nozzle-to-surface distances 1 ≤ H/D ≤ 6, Reynolds numbers 1,300 ≤ Re ≤ 2,800 pulsation frequency 2Hz ≤ f ≤ 65Hz, and Strouhal number 0.0012 ≤ Sr = fD/Um ≤ 0.084. The time-resolved velocity at the nozzle exit is measured to
quantify the turbulence intensity profile. The numerical methodology is firstly validated using the experimental local Nusselt number distribution for the steady jet with the same geometry and boundary conditions. For a time-averaged Reynolds number of 6,000, the heat transfer enhancement using the pulsating jet for 9Hz ≤ f ≤ 55Hz and 0.017 ≤ Sr ≤ 0.102 and 1 ≤ H/D ≤ 6 are calculated. For the same range of Sr number, the numerical and experimental methods show consistent results.
1. Introduction
The existing methods of heat removal from compact electronic devises are known to be deficient as the growing technology demands more power and accordingly better cooling techniques with time. Impinging jets can be used as a satisfactory method for thermal management of electronic devices with limited space and volume. Pulsating flows can produce an additional enhancement in heat transfer rate compared to steady flows. This article represents parts of a comprehensive study performed on pulsating jet cooling technology both experimentally and numerically.
Potential heat transfer enhancement using pulsating jet impingement has not been broadly studied to date. A few of studies have identified a considerable enhancement in heat transfer coefficient [3]-[4]. Zumbrunnen and Aziz have experimentally examined the intermittent pulsation with square-wave form [3]; using square-wave pulsation at high frequency, a large heat transfer enhancement of up to 100% is measured by them. Herwig and Middleberg [4] have studied different waveform signals including triangular, sinusoidal and square-wave forms. They have shown that square-wave form velocity signals are able to generate higher heat transfer coefficients compared to other types. A criterion based on the Strouhal number is partly recognized by different findings. Herwig and Middelberg [4] observed an increasingly positive enhancement for Sr > 0.029 for a circular jet from a long pipe nozzle, up to δNu0 = 30% at Sr = 0.076 for square wave excitation. Conversely, some
researchers have concluded a decrease of heat transfer using pulsating jet impingements [5]-[7].
Azevedo [5] reported that the introduction of pulsation only served to reduce stagnation point heat transfer in all instances and for all H/D. The reductions reported equal to less than -25% degradation in heat transfer. Liu and Sullivan [6] have measured the relative heat transfer enhancement changing between -10% to +10% with pulsation frequency and H/D. Using an acoustically exited air jet from a contoured nozzle, O’Donovan and Murray [7] have also reported a heat transfer reduction up to -21% for 10,000 ≤ Re ≤ 30,000 and 0.5 ≤ H/D ≤ 2. The very different finding by various sources as described is main reason for which the unanimity about the effect of flow pulsation on magnitude of the heat transfer enhancement has not reached yet. This lack of consistency can partly be partly related to the wide range of operating conditions used in different studies.
Both numerical and experimental capabilities in investigation of the cooling effect of pulsating jets are presented in this paper. The impinging jet test facility has been previously fabricated for fluid dynamics and local heat transfer coefficient measurements by Persoons et al. [1] and O’Donovan and Murray [8]-[9]. A couple of modifications are performed in order record and process the fluctuating velocity signal at the exit of pipe nozzle. Also, the fluctuating velocity signals at the nozzle exit are processed in order to derive the values of turbulence intensities, as a major intention of current study. The experimental approach explores heat transfer performance of a pulsating air jet impinging onto a flat surface for nozzle-to-surface distances 1 ≤ H/D ≤ 6, Reynolds numbers 1,300 ≤ Re ≤ 28,00 pulsation frequency 2Hz ≤ f ≤ 65Hz, and Strouhal number 0.0012 ≤ Sr ≤ 0.0839.
The CFD methodology has been earlier validated using the experimental local Nusselt number distribution for the steady jet in the first step [10]-[12]. An essential requirement for CFD investigation of pulsating flow is the correct numerical modelling of laminar-turbulent boundary layer transition is. This paper employs a transition turbulence model called the Gamma-Theta model. This approach captures the laminar-turbulent transition in the wall jet for small nozzle-to-surface distances (H ≤ 2D), and thus the intensity and extent of the secondary peak in the radial Nusselt number distribution. As another important motivation of this paper, it is aiming to generate a reliable CFD approach for heat transfer analysis of pulsating jet cooling technology for thermal management of compact electronic devices. The numerical methodology is firstly validated using the experimental local Nusselt number distribution for the steady jet with the same geometry and boundary conditions. As a main object, for the time-averaged Reynolds number of 6,000, the heat transfer enhancement using pulsating jet for 9Hz ≤ f ≤ 55Hz and 0.017 ≤ Sr ≤ 0.102 and 1 ≤ H/D ≤ 6 are calculated. This study can be considered as the second step toward a numerical methodology for unsteady impinging flows such as synthetic or pulsating jets [10]-[12].
2. Experimental approach
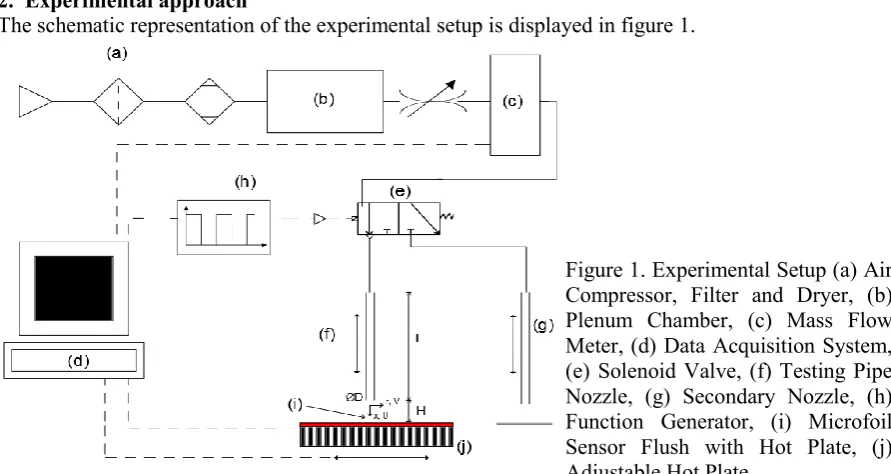
[image:2.595.72.518.500.737.2]The schematic representation of the experimental setup is displayed in figure 1.
Figure 1. Experimental Setup (a) Air Compressor, Filter and Dryer, (b) Plenum Chamber, (c) Mass Flow Meter, (d) Data Acquisition System, (e) Solenoid Valve, (f) Testing Pipe Nozzle, (g) Secondary Nozzle, (h) Function Generator, (i) Microfoil Sensor Flush with Hot Plate, (j) Adjustable Hot Plate.
passed through a digital mass flow controller (c) with an accuracy of ± 1%, controlled by a computer algorithm at (d), through to the solenoid valve (e). This valve divides the flow between the testing pipe (f) and the secondary pipe (g), at a frequency specified by the amplified signal from the function generator (h). Both the testing and secondary nozzles are identical, straight edged pipes with a diameter D = 5mm and length L = 80D. The secondary pipe is used so as to allow for air to be expelled to the ambient when the valve is closed, preventing pressure build up in the system. The height of the testing pipe, H, is adjusted as required with the height of the dummy pipe in order to maintain the same boundary conditions at both pipes, providing equal the back pressures at each pipe. The testing pipe was centred over an RDF Microfoil™ sensor at (i) which was installed flush with the hot plate at (j). This sensor was connected by the DAQ system and computer at (d) along with three T-type thermocouples allowing for the ambient, plate, and flow to be measured. This hot plate could be positioned radially using a stepper motor controlled through the computational algorithm at (d).
The plate was heated using a DC power supply to provide the electrical power to the electrical heaters stored in a 1.1mm silicon matt beneath the 5mm thick copper plate. This mat is glued to the underside of the copper plate, with the topside of the plate being the impingement surface. The plate was maintained at a constant temperature of 60˚C with the ambient remaining around 22˚C. The plate has been found to maintain a uniform wall temperature boundary condition according to previous studies [8]. The angle of impingement for all tests was 90˚, maintaining the same experimental setup from previous studies [1]. The relationship used in this study to define heat transfer achieved is that of Shadlesky [13] who utilised laminar flow theory and assumptions in order to develop the following expression; for H/D < 2. Using this expression and a 13mm jet the relationship between heat flux and voltage from the Microfoil™ was correlated. This is performed to provide an accurate calibration for the 5mm straight pipe nozzles.
The heat transfer was approximated using where the heat flux was provided by the RDF Microfoil™ before converting to the Nusselt number
Hot wire measurements were carried out using the one-dimensional Dantec MiniCTA™ 54T30 hot wire (response time of 1-2 ms). This was clamped to the plate in order to give accurate radial temperature measurements of the flow utilising to the spatial resolution of the stepper motor. Measurements were carried at a sampling frequency proportional to the pulsation frequency being implemented. The uncertainty in the velocity measurements obtained is estimated at 2.7%.
The Nusselt number was measured radially for Reynolds number of 1300 and 2800. These low Reynolds numbers were selected as a result of previous studies that had suggested that the valve was struggling to maintain a square wave pulse at high frequencies. The duty cycle, assumed to be 0.5, was not reached and the study to achieve similar values to that of Persoons et al. [1]. It was therefore decided to reduce the volumetric flow rate by introducing 5mm piping. This decrease in piping lead to a reduction in the Reynolds numbers tested so as to maintain a similar order of Strouhal number to Persoons et al. [1].
3. Numerical approach
The CFD model reproduces the exact configuration used in the accompanying experiments for steady jet which used a smooth pipe nozzle with inner diameter D = 13mm and length L = 32D. The initial computational mesh is refined and adapted iteratively in regions with large velocity, pressure, temperature and turbulence gradients, such as the impingement wall region and the mixing region of jet and surrounding entrained air, in order to attain a stable solution. Figure 2 represents the computational domain together with the generated mesh used for simulations.
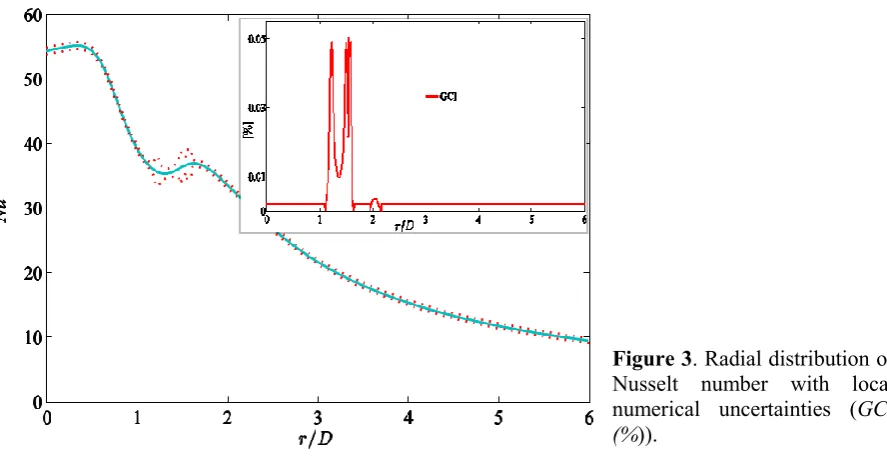
As a meticulous numerical uncertainty analysis, the Grid Convergence Index (GCI) study is performed in order to show that solutions are in asymptotic range of convergence [10]-[11]. The results which represent the discretization error in the solution can be plotted in the form of error band on the numerical results. As shown in figure 3, for steady jet with Re = 6,000 and H/D = 1, Alimohammadi et. al [10] have shown that local distribution of numerical uncertainty has some peaks with the maximum of smaller than 5% in the region of 1 < r/D < 2.
numerical results from experimental data for Re = 14,000 are quantified as 5%, 3% and 2% in terms of local, area-averaged and stagnation point Nusselt numbers, respectively. Conclusively, the results confirms that the developed numerical steady jet model, as the baseline model, can be extended for simulation of unsteady jet impingement problems such as pulsating flows. Further details about the computational procedure and the comprehensive sensitivity analysis performed on the effect of grid density, spatial discretization scheme, turbulent turbulence model and turbulent Prandtl number can be found in Alimohammadi et al. [10]-[12].
[image:4.595.75.503.171.393.2]Figure 2. Computational domain and mesh for numerical simulation of axisymmetric pulsating jet impingement.
Figure 3. Radial distribution of Nusselt number with local numerical uncertainties (GCI (%)).
At the next step, the steady model is modified with an aim to investigate the pulsating jet flows. Detailed adjustments are implemented to account for the intermittent pulsation with a square-wave form with exponential decay/growth as the inlet velocity signal [11]. The exponential decay/growth (±e-t/τ; where τ is a decay constant) between extrema of the pulsating signal is used to take into consideration the response time of the pneumatic valve which provides the pulsating flow component and has a response time of approximately 2 milliseconds (see section 2).
Sym
m
et
ry
A
xis
Nozzle Exit Opening Boundary
Conditions (1 atm.)
[image:4.595.77.521.434.663.2]4. Results and Discussion
4.1. Experimental results
4.1.1. Radial heat transfer results. The following experimental results for the radial Nusselt number distributions are presented in Figures 4. These display the effects of pulsation frequency ((2Hz ≤ f ≤ 65Hz; 0.0012 ≤ Sr ≤ 0.0839) and nozzle to plate spacing (1D ≤ H ≤ 6D) on the heat transfer for time averaged Reynolds numbers of 1,300 and 2,800.
(a) (b)
[image:5.595.75.517.182.556.2](c) (d)
Figure 4. Radial heat transfer for 2Hz ≤ f ≤ 65Hz and 0.0012≤ Sr ≤ 0.0839 at (a). H/D = 1, Re = 1300; (b). H/D = 1, Re = 2800; (c). H/D = 2, Re = 1300; (d). H/D = 2, Re = 2800.
The impinging jet Nusselt number correlation employed in the following analysis is that of Shadlesky [13], ,, which provides a lower bound estimate for the stagnation Nusselt number due to the use of laminar flow theory and assumptions in its conception. This provides a lower bound estimate for the stagnation Nusselt number due to its use of laminar flow theory and assumptions during its formulation.
As shown in figures 4, the highest heat transfer is achieved at the stagnation point. The highest velocity and lowest jet temperature is observed at this point, causing a corresponding increase in the Nusselt number due to the well documented dependencies on Re and ΔT [14].
The stagnation Nusselt number Nu0 decreases for all Reynolds numbers and H/D values when
pulsation is introduced. The results above were reflected by Azevedo et al. [5] who reported that the introduction of pulsation only served to reduce stagnation point heat transfer in all instances and for all
H/D. The reductions reported equate < -25% degradation in heat transfer. This however was found at higher Strouhal numbers than those in this study, hence why such a significant degradation is observed above. It displays a marked decrease for pulsating jets at low H/D, caused by the increased
0 1 2 3 4 5 6
0 5 10 15 20 25 30
H/D=1 Re=1300
r=D
N
u Steady2hz
5hz 15hz 40hz 65hz
0 1 2 3 4 5 6
0 5 10 15 20 25 30
H/D=1 Re=2800
r=D
N
u
Steady 2hz 5hz 15hz 40hz 65hz
0 1 2 3 4 5 6
0 5 10 15 20 25 30
H/D=6 Re=1300
r=D
N
u
Steady 2hz 5hz 15hz 40hz 65hz
0 1 2 3 4 5 6
0 5 10 15 20 25 30
H/D=6 Re=2800
r=D
N
u
entrainment and mixing provided by the introduction of pulsation. This leads the jet to become shorter and broadening its velocity profile, reducing the length for which the potential core persists and degrading the mean velocity of the jet at the core, confirmed in the studies of Hofman et al. [15]. This increased mixing and rate of decay of the potential core of the jet is accelerated by increasing the frequency of pulsation and therefore Strouhal number [14], [16]. However, the distance is not large enough to allow the increased mixing provided by the pulsating jet to impact the potential core of the jet. The impact of the ordered, periodic vortices of a pulsating jet do not rival the stagnation point heat transfer of a steady jet until they have penetrated the core of the jet at a higher H/D, shown figure 4 [14]-[15]. This results in increased turbulence intensity and mixing compensating for the loss in mean velocity when compared to a steady jet. It should also be noted that Nu0 decreases for a steady jet with
increasing H/D as compared to pulsating jets, which remain relatively constant, increasing in some isolated incidences.
Interestingly there are no sizeable “saddle back” profiles observed in these distributions. This is a phenomenon specific to impinging jets, where by a secondary peak is observed around r/D = 1.5 where the boundary transitions from a laminar to a turbulent regime at low H/D, increases the momentum transport [17]. This was observed in the previous set of results obtained using a 13.3mm contoured pipe by Persoons et al. [1]. This has been attributed to the low Reynolds number of the flow, in contrast to the considerably higher Reynolds numbers which were analysed by the previous studies using this experimental set up and the majority of the authors in the review of the literature above. The lower Reynolds number and therefore slightly higher Strouhal number also means that the potential core of the jet is diminished at a quicker rate as outlined above. This is shown by Lytle and Webb [18] who display that the secondary maximum only occurs at higher Reynolds number when H/D is increased. Conversely this secondary maximum becomes evident at lower Re with a corresponding decrease in H/D. Therefore such a saddle back profile may be evident testing at H/D < 1. This secondary peak was mildly visible in this investigation however, at H/D = 1 when a Reynolds number of 2800 was utilised. This secondary maximum can also be observed at higher frequencies for low
H/D, a result akin to that of Persoons et al. [1]. This is caused by the Reynolds number being doubled during pulsating flows so as to allow for the same time averaged velocities compared to a steady jet.
4.1.2. Average radial heat transfer results. To discern as to whether any improvements in heat transfer are obtained beyond the stagnation point, the area averaged Nusselt number was derived. This was defined utilising the length scale of the jet nozzle to define a circular impingement area of radius
R = 6D around the stagnation point. The integral of the Nusselt number with respect to r/D was then calculated and divided by the surface are to give ̅̅̅̅
∫ ∫
. The enhancement was then derived from the following expression: ̅̅̅̅ ( ̅̅̅̅
̅̅̅̅ ) . The stagnation and area-averaged heat enhancements, when compared to steady jet, are quantified as follows -49% ≤ ≤ -8% and -21% ≤ ̅̅̅̅ ≤ 29.5%. Variation of ̅̅̅̅ with H/D is shown in figure 5.
[image:6.595.69.531.457.744.2](a) (b)
Figure 5. Area-averaged Nusselt number enhancement vs. H/D at (a). Re = 1300; (b). Re = 2800.
1 2 3 4 5 6
-20 -10 0 10 20 30
/N ufor Re=1300
H=D
/
N
u
(%
)
2 Hz 5 Hz 15hz 40hz 65hz
1 2 3 4 5 6
-25 -20 -15 -10 -5 0 5 10 15
/N ufor Re=2800
H=D
/
N
u
(%
)
The enhancements in the area-averaged Reynolds number increase substantially at H/D > 2 for both Reynolds numbers, as displayed in figure 5. This is reflective again of the normally clear secondary maximum found at low H/D. The enhanced mixing and turbulence intensity found to exist as the velocity decreases radially and the turbulence intensity increases; this has been found by Mladin and Zumbrunnen [20], and therefore leads to increased heat transfer for r/D > 2. These higher turbulence intensities observed in pulsating flows have been noted to cause increases in the radial velocity of a pulsating jet improving the heat transfer in the wall jet region [21]. The peak in area-averaged heat transfer is found at H/D = 2 for the lower Reynolds number of 1300 and increases to H/D = 3 for Re = 2800. These peaks in area-averaged heat transfer coincided with a disappearance in of the small secondary maximum visible in the radial heat transfer for H/D = 1 Re = 2800 in figure 4, indicative of the existence of the potential core of the jet. This would suggest that at H/D=3, the potential core of the jet has been completely enveloped by the shear layer allowing for increased turbulence intensity across the jet [15]. This shortening and spreading of the jet also allows for an increased radial velocity increasing heat transfer away from the stagnation point. This results in a flatter radial heat transfer distribution [22]. Some area-averaged enhancement has already been observed at Re = 1300 and H/D = 1 at 65Hz, with no secondary maximum visible at this H/D spacing in the radial profiles in figure 4. The ̅̅̅̅ profile in figure 5 suggests that this envelopment of the potential core has already occurred due to the higher Strouhal numbers in effect. The increases in heat transfer, as shown above, display a clear dependency on the reduction in the mean velocity flow and increasing the frequency of pulsation. This confirms that there is a definite dependency on the Strouhal number as suggested by a number of authors [3] and [15]-[16].
4.1.3. Turbulence Intensities. The compressibility of air results in pulsating jets of higher frequencies struggling to maintain a square wave pulsation. The theoretical analysis of the effective pulsation amplitude displays that at higher frequencies there is effectively a steady flow oscillating to a maximum. This observation of the flow never reaching a standstill is reflected in the predictions of Persoons et al. [1].
The following velocity signals, as shown in figure 6, were obtained using hot wire anemometry. It is the intention of this paper to provide an extended range of turbulence intensities occurring in a pulsating jet for varying pulsation frequencies and Reynolds numbers. The centreline turbulence intensity was evaluated for a selected number of frequencies using Reynolds decomposition. This was carried out by decomposing the flow into periodical signals, as shown in figure 6, before deriving the phase averaged velocity ( ̅ ) for each period. This phase averaged velocity was then subtracted from the true velocity ( )) of the flow to give the turbulent fluctuations ( ̅ ). Turbulence intensity is defined as the root-mean-square of the turbulent velocity fluctuations with respect to mean averaged jet exit velocity ̅ ; √ ̅̅̅̅̅̅̅̅ ̅ . Noise was eliminated on a case by case basis so as to ensure the accuracy of the values obtained.
Figure 6 diplays the dependence of turbulence intensity on the Reynolds number. This dependence is often assumed for a fully developed pipe flow, as is the case in this study, through the correlation [23]. The profiles above demonstrate this relationship with the turbulence decreasing for higher Reynolds numbers. Using this expression it is expected that the turbulence intensities for these flows would be for Re = 2800. It is expected however that there be some deviation from this due to the pulsating nature of the flow, while the above expression is proposed for steady flows.
(a) (b)
Figure 6. Velocity signal decomposition and Tu(%) at (a). Re = 1300, f = 8Hz; (b). Re = 2800, f = 8Hz.
4.2. Numerical results
4.2.1. Radial heat transfer results. The effect of pulsating inlet flow on the local Nusselt number distribution and thermal enhancement on stagnation (δNu0) and area-averaged (δNuave) Nusselt
numbers are discussed. As shown in Fig. 1, a degradation of Nusselt number is obvious in the stagnation zone. At higher frequencies (27Hz ≤ f ≤ 55Hz) and larger values of H/D, the pulsating jet flow raises the local Nusselt number distribution over the whole impingement surface. For the radial distances of r/D > 2, after the secondary peak, the results show a gradual reduction in heat transfer distribution, and interestingly, the difference between the results of various frequencies after this region becomes insignificant. In addition, as the frequency of the pulsation increases, the second peak in the Nusselt number distribution becomes less intense while remaining at the same location.
[image:8.595.76.522.72.285.2](a) (b)
Figure 7. Radial Nusselt number distribution for steady and pulsating flows at different frequencies (f
= 9 – 55 Hz; Sr = 0.017-0.102; Re = 6,000) for: (a). H/D = 1, (b). H/D = 6.
4.2.2. Area-averaged and Stagnation Nusselt Numbers. The enhancement effects of flow pulsation on area-averaged Nusselt (δNuave) and stagnation Nusselt (δNu0) numbers, when compared to
corresponding steady jet, are shown in figure 8.
For f = 9 Hz, a reduction in the stagnation Nusselt number occurs when pulsation is used, followed by increases with increasing frequency from 9 to 55 Hz. For H/D of 1, the maximum reduction of -10% of the steady Nusselt number is observed (f = 9 Hz, Sr = 0.017), and only at the uppermost frequency of 55 Hz, is an increase of the stagnation point Nusselt number detectable.
0 2 4 6 8
-1 0 1 2 3 4 5
Re= 1300f= 8Hz
P hase(radians)
V el o ci ty ( m = s )
T u= 7%
phase-averaged velocity [m/s]
turbulent velocity.uctuation [m/s]
0 2 4 6 8
-5 0 5 10 15 20
Re= 2800f= 8Hz
P hase(radians)
V el o ci ty ( m = s )
T u= 3%
phase-averaged velocity [m/s]
turbulent velocity.uctuation [m/s]
0 1 2 3 4
15 20 25 30 35 40 45 50 55 60 r=D N u 55 Hz 40 Hz 32 Hz 27 Hz 9 Hz Steady
0 1 2 3 4
[image:8.595.83.526.452.634.2]The level of area-averaged enhancement (δNuave) increases with frequency (or Strouhal number). H/D strongly affects the area-averaged heat transfer. The results for two higher frequencies, 40 and 55
Hz, are very close; this becomes more evident at H/D = 6, where the maximum δNuave of 63% occurs (f = 55, Sr = 0.102). The lowest enhancement is equal to 10% for H/D =1 (f = 9 Hz, Sr = 0.017). The increased δNuave outweighs the reductions in δNu0. The stagnation and area-averaged Nusselt numbers
exhibit similar trends with frequency and nozzle-to-surface distance. The area-averaged Nusselt numbers represent more consistent and larger enhancements showing a monotonic increase with frequency at different H/D values. The variation of enhancement in stagnation and area-averaged Nusselt numbers with f and H/D are consistent with experimental data of Persoons et al. [1].
(b) (c)
(d)
[image:9.595.76.521.190.545.2](e)
Figure 8. Effect of flow pulsation on area-averaged Nusselt number (a. H/D = 1, b. H/D = 6) and Stagnation Nusselt number (b. H/D = 1, b. H/D = 6) for f = 9 – 55 Hz; Sr = 0.017-0.102; Re = 6,000.
5. Conclusions
Using the numerical approach, the effect of flow pulsation on stagnation and area-averaged Nusselt numbers, when compared to steady jet, are respectively quantified as -10% ≤ δN0 ≤ 19% and 10% ≤ δNuave ≤ 63%. For experimental approach, the stagnation and area-averaged heat enhancements are
quantified as follows -49% ≤ ≤ -8% and -21% ≤ δNuave≤ 29.5%.
The results of numerical and experimental approaches are consistent for identical values of Sr
numbers. A clear unanimity about the effect of flow pulsation on magnitude of the heat transfer enhancement can be achieved by adapting the range of the operating conditions in both approaches, as a further step of the current study. By adjusting the effective parameters appropriately, the employment of the pulsating jet flow can cause a significant enhancement compared to the equivalent steady jet flow. All in all, pulsating jet cooling technology shows great potentials for thermal management in compact electronic systems.
0 10 20 30 40 50 60
10 20 30 40 50 60
f, Hz
/
N
ua
v
e
(%
)
H=D= 1
0 10 20 30 40 50 60
10 20 30 40 50 60
f, Hz
/
N
ua
v
e
(%
)
H=D= 6
0 10 20 30 40 50 60
-10 -8 -6 -4 -2 0 2 4 6
f, Hz
/
N
u0
(%
)
H=D= 1
0 10 20 30 40 50 60
-10 -5 0 5 10 15 20
f, Hz
/
N
u0
(%
)
References
[1] Persoons T, Balgazin, K, Brown K and Murray D B 2013 Scaling of convective heat transfer enhancement due to flow pulsation in an axisymmetric impinging jet J. Heat Transf. 135 111012.
[2] Garimella S V, Yeh L T and Persoons T 2012 Thermal Management Challenges in Telecommunication Systems and Data Centers IEEE Trans. Compon. Packag. Manuf. Technol. 2 1307–16.
[3] Zumbrunnen D A and Aziz M 1993 Convective heat-transfer enhancement due to Iintermittency in an impinging jet Trans. J. Heat Transf. 115 91–98.
[4] Herwig H and Middelberg G 2008 The physics of unsteady jet impingement and its heat transfer performance Acta Mech. 201 171–184.
[5] Azevedo L F A 1994 Pulsed Air Jet Impingement Heat Transfer Exp. Therm. Fluid Sci. 8 206– 213.
[6] Liu T S and Sullivan J P 1996 Heat transfer and flow structures in an excited circular impinging jet Int. J. Heat Mass Transfer 39 3695–3706.
[7] O’Donovan T S and Murray D B 2007 Effect of acoustic excitation on the heat transfer to an impinging air jet Proc. ASME-JSME Thermal Eng. Summer Heat Transf. Conf. HT2007– 32800 (Vancouver: CANADA).
[8] O’Donovan T S and Murray D B 2007 Jet impingement heat transfer – Part I: Mean and root-mean-square heat transfer and velocity distributions Int. J. Heat Mass Transf. 50 3291–3301. [9] Persoons T, McGuinn A and Murray D B 2011 A general correlation for the stagnation point Nusselt number of an axisymmetric impinging synthetic jet Int. J. Heat Mass Transf. 54 3900–08.
[10] Alimohammadi S, Murray D and Persoons T 2014 Experimental Validation of a CFD Methodology for Transitional Flow Heat Transfer Characteristics of a Steady Impinging Jet
J. Heat Transf. HT-14-1049 (accepted; in press).
[11] Alimohammadi S, Persoons T and Murray D B 2014 A numerical-experimental study of heat transfer enhancement using unconfined steady and pulsating turbulent air jet impingement
Proc. 15th Int. Heat Transfer Conf. IHTC15-8765 (Kyoto:Japan) (accepted; in press). [12] Alimohammadi S, Persoons T, Murray D B, Tehrani M S, Farhanieh B and Koehler J 2013 A
Validated Numerical-Experimental Design Methodology for a Movable Supersonic Ejector Compressor for Waste-Heat Recovery J. Therm. Sci. Eng. Appl. 6 021001:1-10.
[13] Shadlesky P S 1983 Stagnation point heat transfer for jet impingement to a plane surface AIAA J. 21 1214–15.
[14] Farrington R B and Claunch S D 1994 Infrared Imaging of Large-Amplitude, Low-Frequency Disturbances on a Planar Jet AIAA J. 32 317–323.
[15] Hofmann H M, Movileanu D L, Kind M and Martin H 2007 Influence of a Pulsation on Heat Transfer and Flow Structure in Submerged Impinging Jets Int. J. Heat Mass Transf. 50 3638–3648.
[16] Mladin E and Zumbrunnen D 1997 Local Convective Heat Transfer To Submerged Pulsating Jets Int. J. Heat Mass Transf. 40 3305–21.
[17] Lee J and Lee S 1999 Stagnation Region Heat Transfer of a Turbulent Axisymmetric Jet Impingement Exp. Heat Transf. 12 137-156.
[18] Lytle D and Webb B W 1994 Air jet impingement heat transfer at low nozzle-plate spacings 37
Int. J. Heat Mass Transf. 1687–97.
[19] Sheriff H S and Zumbrunnen D A 1994 Effect of Flow Pulsations on the Cooling Effectiveness of an Impinging Jet J. Heat Transfer 116 886–895.
[20] Mladin E C and Zumbrunnen D A 2000 Alterations to Coherent Flow Structures and Heat Transfer Due to Pulsations in an Impinging Air-Jet Int. J. Therm. Sci. 39 236–248.
[21] Zulkifli R and Sopian K 2007 Studies on Pulse Jet Impingement Heat Transfer : Flow Profile
Int. J. Eng. Technol. 4 86–9.
[22] Camci C and Herr F 2002 Forced Convection Heat Transfer Enhancement Using a Self-Oscillating Impinging Planar Jet J. Heat Transfer 124 770-782.