Open Access
Research
Resting myocardial perfusion quantification with CMR arterial spin
labeling at 1.5 T and 3.0 T
Benjamin E Northrup
1,2, Kyle S McCommis
1, Haosen Zhang
1,
Shuddhadeb Ray
1,3, Pamela K Woodard
1, Robert J Gropler
1and Jie Zheng*
1Address: 1Mallinckrodt Institute of Radiology, Washington University School of Medicine, St. Louis, Missouri, USA, 2Dartmouth Medical School, Hanover, New Hampshire, USA and 3University of Kansas School of Medicine, Kansas City, Kansas, USA
Email: Benjamin E Northrup - [email protected]; Kyle S McCommis - [email protected];
Haosen Zhang - [email protected]; Shuddhadeb Ray - [email protected]; Pamela K Woodard - [email protected]; Robert J Gropler - [email protected]; Jie Zheng* - [email protected]
* Corresponding author
Abstract
Background: The magnetic resonance technique of arterial spin labeling (ASL) allows myocardial perfusion to be quantified without the use of a contrast agent. This study aimed to use a modified ASL technique and T1 regression algorithm, previously validated in canine models, to calculate myocardial blood flow (MBF) in normal human subjects and to compare the accuracy and repeatability of this calculation at 1.5 T and 3.0 T. A computer simulation was performed and compared with experimental findings.
Results: Eight subjects were imaged, with scans at 3.0 T showing significantly higher T1 values (P < 0.001) and signal-to-noise ratios (SNR) (P < 0.002) than scans at 1.5 T. The average MBF was found to be 0.990 ± 0.302 mL/g/min at 1.5 T and 1.058 ± 0.187 mL/g/min at 3.0 T. The repeatability at 3.0 T was improved 43% over that at 1.5 T, although no statistically significant difference was found between the two field strengths. In the simulation, the accuracy and the repeatability of the MBF calculations were 61% and 38% higher, respectively, at 3.0 T than at 1.5 T, but no statistically significant differences were observed. There were no significant differences between the myocardial perfusion data sets obtained from the two independent observers. Additionally, there was a trend toward less variation in the perfusion data from the two observers at 3.0 T as compared to 1.5 T.
Conclusion: This suggests that this ASL technique can be used, preferably at 3.0 T, to quantify myocardial perfusion in humans and with further development could be useful in the clinical setting as an alternative method of perfusion analysis.
Background
Myocardial blood flow (MBF), defined as the rate at which blood enters the myocardial microvasculature through the coronary artery network, is an important indicator of myocardial perfusion changes, as seen in myocardial
stress and ischemic heart disease [1-3]. The gold standard for human myocardial perfusion analysis is positron emission tomography (PET), but this technique is marred by limited spatial resolution, high cost, limited availabil-ity, and patient radiation exposure [4]. Additionally, first-Published: 17 November 2008
Journal of Cardiovascular Magnetic Resonance 2008, 10:53 doi:10.1186/1532-429X-10-53
Received: 14 May 2008 Accepted: 17 November 2008
This article is available from: http://www.jcmr-online.com/content/10/1/53
© 2008 Northrup et al; licensee BioMed Central Ltd.
pass perfusion cardiovascular magnetic resonance (CMR) would allow efficient measurement of myocardial per-fusion, but the necessity of a gadolinium-based contrast agent would limit this technique in terms of repetition in a single CMR examination and use in the renal failure patient. However, arterial spin labeling (ASL), through measurement of myocardial and blood T1, is capable of
measuring myocardial perfusion multiple times in a sin-gle CMR examination [2,5]. ASL uses arterial water as an endogenous tracer and can be implemented through a number of techniques. The method used in this work is based on the flow-sensitive alternating inversion recovery (FAIR) scheme. In FAIR, two sets of inversion recovery (IR) images are acquired: a slice-selective inversion and a nonselective inversion [6]. After the slice-selective inver-sion, non-inverted proton spins from arterial water flow into the imaging slice and exchange with tissue water, resulting in T1 shortening in the tissue of interest.
Previously, two studies involving the rat heart in various states (resting, hyperemic, and during post-infarction remodeling) have validated ASL against the previously established technique of myocardial perfusion quantifica-tion using microspheres [7,8]. Furthermore, ASL has been validated with both the microsphere technique and first-pass perfusion imaging in a different study using rats [9]. Notably, ASL has been shown to be successful in its appli-cation to humans with ischemic heart disease and in the determination of perfusion reserve, a clinically useful metric, in a study that included patients with suspected coronary artery disease [10].
From ASL sequences, myocardial perfusion can be quanti-fied by calculating MBF using the following equation [5]:
where λ is the constant blood-tissue coefficient of water, and λ = 0.92 mL/g for blood-perfused myocardial tissue [11]; T1, GS is the T1 of the myocardium after the nonselec-tive IR pulse; T1, Blood is the average T1 of the left ventricular blood pool; and T1, SS is the T1 of the myocardium after the slice-selective IR pulse. This equation assumes identical spatial slice profiles of the slice-selective IR pulse and the slice-selective excitation pulse, a two-compartment model (consisting of the intravascular capillary blood and the extravascular tissue) in which magnetization is homoge-neous in each compartment, and rapid exchange of water between the two compartments. The accuracy of the myo-cardial perfusion rate determined by this equation is highly dependent on both the measured T1 values and the ASL technique used to obtain them. Recently, we have proposed a modified ASL technique and T1 regression algorithm that has proved reliable in assessing MBF in canine models [2,12].
In recent years, 3.0 Tesla (T) magnetic resonance imaging systems have been used increasingly in the clinical setting. The primary advantage of 3.0 T over 1.5 T systems is the anticipated, but less than, twofold increase in signal-to-noise ratio (SNR) [13-15]. Though it is the intrinsically longer T1 relaxation times observed at 3.0 T that lead to this lower-than-expected SNR increase in T1-weighted
imaging, 3.0 T systems still demonstrate a significantly higher SNR than that of 1.5 T, and thus serve as a more reliable platform for the calculation of T1 [16,17]. Addi-tionally, the intrinsically longer T1 relaxation times grant 3.0 T greater sensitivity to T1 changes.
Accordingly, the primary aim of this study was to compare the accuracy and repeatability of myocardial perfusion measurements by the use of a recently modified ASL tech-nique at 3.0 T to those at 1.5 T in resting healthy human subjects [2].
Methods
Imaging protocolA total of 8 subjects (5 male, 3 female, mean age 21.9 ± 2.0 years) were recruited. All subjects had no known his-tory of cardiovascular disease and were in the resting state for both CMR examinations. Each patient underwent two consecutive same-day imaging sessions, one on a 1.5 T whole-body Sonata system (Siemens Medical Solutions, Erlangen, Germany) and one on a 3.0 T whole-body Mag-netom Trio system (Siemens Medical Solutions, Erlangen, Germany). Both systems were equipped with a fast gradi-ent system (maximal gradigradi-ent strength = 40 mT/m; maxi-mal slew rate = 200 mT/m per millisecond). A four-element phased array coil was used for signal reception and a body coil was used for transmission. For electrocar-diogram (ECG) monitoring and pulse sequence trigger-ing, a three-lead patch was attached to the chest of each subject. This allowed for the acquisition of images at mid-diastole, the time of least cardiac contractile motion. To eliminate respiratory motion artifacts, the subjects were instructed to hold their breath for the duration of each series of acquisitions [18].
A scout image was first obtained to localize a short axis view of the left ventricle (LV) of each subject's heart. Next, a cine acquisition with a segmented steady-state free pre-cession (SSFP) sequence was performed to determine the mid-diastolic period in the cardiac cycle [19]. T1-weighted
images were then acquired using a recently developed sin-gle-shot gradient-echo (GE)-based ASL sequence with an adiabatic hyperbolic secant IR pulse [2]. At both main magnetic field [B0] strengths, the previous ASL sequence was modified by combining nonselective (NonS) and slice-selective (Sel) prepared sequences into one series. This allowed for the reduction of inter-scan motion effects and total scanning time. Based on the Look-Locker scheme, the sequence acquired multiple data points along
MBF T GS
T Blood T SS T GS
=l 1 −
1
1
1
1
1 ,
, (
, ,
the magnetization recovery time course after each IR pulse. There was a 3-second idle time between the two IR acquisitions to allow more time for the recovery of mag-netizations of GE acquisitions. Therefore, the NonS and Sel T1-weighted signals were acquired sequentially. Data acquisition was ECG-triggered (Figure 1). Each pair of series was repeated three times in order to evaluate the reliability of ASL in perfusion measurement.
Imaging parameters
On the 1.5 T system, ASL sequence parameters included a TR range of 2.47 to 2.59 ms and a TE range of 1.07 to 1.12 ms. At 3.0 T the TR range was 2.48 to 3.16 ms and the TE range was 1.06 to 1.69 ms. At both B0 strengths, flip angle = 5°, slice thickness = 8 mm, receive bandwidth = 650 Hz, the number of phase-encoding steps ranged from 64 to 73, and the interpolated matrix size ranged from 128 × 64 to 128 × 73. The first series consisted of 20 to 24 image acquisitions (half obtained with a Sel IR pulse and half obtained with a NonS IR pulse), temporally separated by the RR interval. The average observed RR interval was approximately 800 ms, making the total duration of the series, and thus the breath hold duration, 16 to 19 sec-onds. The first series was followed immediately by a sim-ilar second series of acquisitions (data from both parts were combined in the analysis, described below) with a longer initial inversion time (TI). At 1.5 T, the initial inversion time from the first series (initial TI1) ranged from 91 to 99 ms, while that of the second series (initial TI2) ranged from 137 to 155 ms. At 3.0 T, the initial TI1 ranged from 91 to 122 ms and the initial TI2 ranged from
137 to 177 ms. The TI was the time from the middle of the IR pulse to the time when the central k-space data of the GE acquisition was acquired. Thus, the initial TI1 was the minimal TI achieved with the defined image matrix size since k-space data was linearly acquired in each T1 -weighted image. Generally, the TI2 was approximately 40 ms greater than the TI1. This ensured that the IR pulse of the second series, together with the following GE acquisi-tion, remained in mid-diastole [2].
Data analysis
Two independent observers drew one region of interest (ROI) in the left ventricular blood pool and one in the entire left ventricular myocardial ring. The use of two independent observers facilitated the determination of the inter-observer variability for the calculated MBF values (note that the T1 and MBF values presented in the results
and the tables represent data from a single observer). The ROI in the left ventricular myocardial ring were drawn in the central 50% of the myocardium, in order to avoid arti-facts common to the edges. However, the ROI were not drawn over large full-thickness artifacts that were readily visualized, such as air-solid interface magnetic susceptibil-ity artifacts of the lateral wall or blood-pool and myocar-dial partial volume effects at the septum [20]. Notably, ROI were not drawn over major coronary artery branches so MBF calculations would presumably include data from the level of the myocardial microvasculature only, neces-sary for this method to accurately quantify myocardial perfusion. Bulk adjustment of a ROI was performed if nec-essary to correct for positional changes. In addition to this, each image in a pair of series was screened by one observer for motion of any kind, and the pair was given a motion rating on a scale of zero to five (0 = no motion and 5 = severe motion artifacts). Each score was subsequently classified as respiratory, cardiac, or inter-series related motion.
From the absolute values of the signal intensities meas-ured in each ROI, our previously developed MatLab (The MathWorks Co., Natick, MA)-based nonlinear regression algorithm using real clock time for TI was used to calculate
T1 values [2]. Using these values in Eq.[1], MBF was calcu-lated. The average MBF values, as well as the standard deviations (SD), were calculated from all of the pairs of series from each subject at 1.5 T and 3.0 T, respectively. The repeatability was calculated as the ratio of the average SD to the average MBF. Paired comparison of the two field strengths was performed using a paired two-tailed Stu-dent's t test with a P < 0.05 significance level. The strength of agreement between the two sets of observations was determined via MBF comparisons by paired Student's t
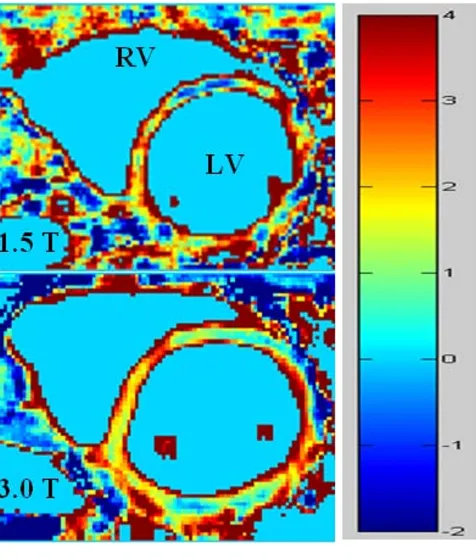
tests and Bland-Altman tests. To demonstrate the capabil-ity of perfusion mapping by this method, a myocardial perfusion map was created pixel-by-pixel using corre-sponding nonselective and slice-selective T1 maps (Figure 2).
Additionally, SNR was calculated for the entire LV myo-cardial ring (from both slice-selective and nonselective series) and the LV blood pool (from nonselective series only). This was done by dividing the mean signal intensity (of the LV blood pool or the myocardium) by the stand-ard deviation of the signal intensity of extracorporeal air. In both the experimental and the simulation results (see A schematic diagram of the sequence that was used to obtain
the data necessary for myocardial perfusion quantification, highlighting ECG triggering and the 3 second idle time between the two IR acquisitions
Figure 1
below), the SNR values from the last image acquired (the image with the longest TI) in each sequence were used.
Error analysis
To evaluate the effect of SNR on the accuracy and preci-sion of the myocardial perfupreci-sion measurements using this ASL method, a computer simulation was performed with the T1 data sets from the averaged values of volunteers (see Results). Using the following equation (Eq. [12] in refer-ence [2]), signal intensity of SN (N is the number of images collected after the IR pulse) can be derived:
Where An/2-1 is defined as
and B is equal to
, β is the inversion pulse flip angle, α is the
RF-train excitation angle, and τN is the time interval between the (N - 1)th and Nth measurements. This equa-tion was derived from the Bloch Equaequa-tion to correlate T1 -weighted signal intensities of dynamic images during T1
recovery, necessary due to the brevity of the RR interval. Using this equation, the saturation effect induced by the multiple data acquisitions between each cardiac cycle can be accounted for in the T1 calculation.
Random Gaussian noise was then added to the SN and
SNR was calculated as . Different SNR values
were designed and corresponding nonselective and slice-selective myocardial T1 values were calculated using the nonlinear regression algorithm, as well as non-selective blood T1 values. MBF values were calculated using Eq. [1] to compare with the true MBF data (data without noise) for accuracy analysis. For the specific T1 and SNR data sets of the volunteers at 1.5 T and 3.0 T, these procedures were repeated 3 times to calculate the repeatability and aid in the estimation of the accuracy of the means.
Results
The individual and overall average T1 values, calculated from the data from one observer, are shown in Table 1. The average LV blood pool T1, nonselective myocardial T1,
and slice-selective myocardial T1 values all showed statis-tically significant increases from 1.5 T to 3.0 T (P < 0.001). Dynamic normalized (to noise) curves of T1 recovery are demonstrated in Figure 3. A trend of greater SNR at most
time points, as well as larger T1 values, was evident at 3.0 T as compared to 1.5 T.
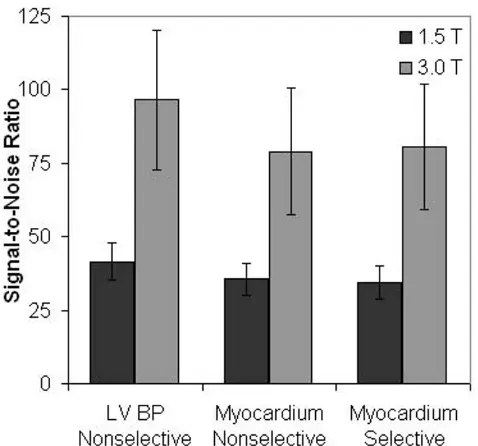
The average calculated SNR values from the final acquisi-tion of each sequence are displayed in Figure 4. The aver-age LV blood pool SNR from nonselective sequences (41.56 ± 6.19 at 1.5 T and 96.51 ± 23.57 at 3.0 T), global myocardial SNR from nonselective sequences (35.60 ± 5.43 and 79.01 ± 21.50), and global myocardial SNR from slice-selective sequences (34.54 ± 5.65 and 80.65 ± 21.37) all showed statistically significant increases from 1.5 T to 3.0 T (P < 0.002).
The myocardial perfusion data (the average of the MBF values calculated from Eq. [1] for each subject) for the eight subjects, as well as their demographic data and motion ratings are shown in Table 2. Higher standard deviations (SD) of MBF values were observed at 1.5 T in subjects 1, 2, 3, and 6. Higher SD of MBF values were observed at 3.0 T in subjects 5, 7, and 8. In subject 4, the SD could not be compared because only one pair of series of images was acquired at 3.0 T. The average SD at 1.5 T was 0.365, representing a repeatability of 0.37, whereas the SD at 3.0 T was 0.221, representing a repeatability of 0.21, a 43% improvement. In subjects 4, 5, and 6, the 1.5 T scans had higher average motion ratings than the 3.0 T scans. In subjects, 1, 2, 3, 7, and 8, the 3.0 T scans had higher average motion ratings than the 1.5 T scans.
The average myocardial perfusion rate for all subjects, cal-culated from the MBF data from one observer, was found to be 0.990 ± 0.302 mL/g/min at 1.5 T and 1.058 ± 0.187 mL/g/min at 3.0 T. This difference between the two field strengths was not found to be statistically significant (P = NS). Likewise, the average standard deviations of the MBF values (0.365 ± 0.201 mL/g/min at 1.5 T and 0.221 ± 0.128 mL/g/min at 3.0 T) did not demonstrate statistically significant differences between the two field strengths (P
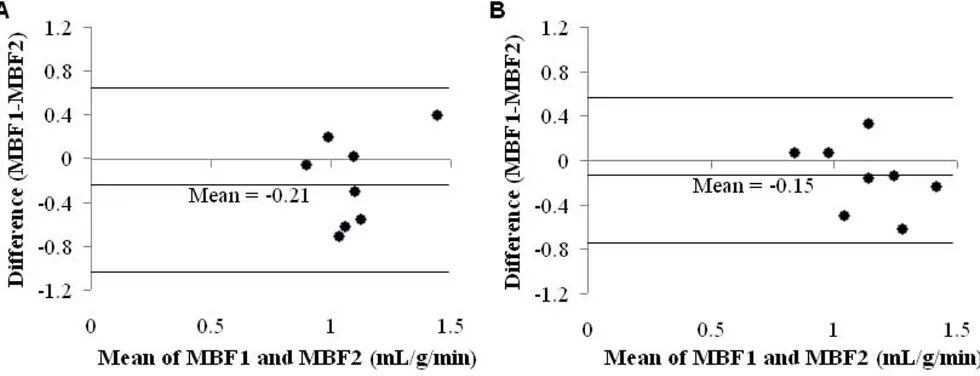
= NS). No significant difference was found between the two observers in terms of calculated MBF values at 1.5 T or 3.0 T (P = NS), although a slightly higher average MBF was obtained by the second observer at both B0 strengths (1.198 ± 0.205 mL/g/min at 1.5 T and 1.211 ± 0.281 mL/ g/min at 3.0 T). Figure 5 shows the Bland-Altman analysis and demonstrates a trend toward less variation in the cal-culated MBF values by the two observers at 3.0 T as com-pared to 1.5 T.
Error simulations
The relationship of the absolute error of the calculated MBF (in percentages) with the SNR of the images (35.60 at 1.5 T and 79.01 at 3.0 T) was determined with the error simulations. The data were obtained using the T1 values at 1.5 T. When the SNR is lower than 250 (for all 1.5 T and 3.0 T MRI systems), the error of the MBF is larger than SN
sin M cos e B A A cos e B
N T n n n NT n
a b a
t t
=
(
+ −)
− + − + − −0 1 /1 /2 1 /2 1 /2 /1 /211+SN−1 −1 − 1
sin Bn cos e
N T
a a
t /
(2)
M e TR T
TR T
e n
TR T e
0 1
1 2 1
1
( / ) cos
/ / cos / 1 1 1 − − −
(
−)
− − − a a cosa −TR T/e 1
M Noise
10% (10–50%). The repeatability of the MBF measure-ments in this simulation was found to be 0.127 for 1.5 T and 0.078 for 3.0 T (P = NS), whereas the error of the MBF was 13.9 ± 7.1% at 1.5 T and 5.4 ± 4.5% at 3.0 T (P = NS).
Discussion
The primary goal of this study was to compare the accu-racy and repeatability of myocardial perfusion data obtained at 3.0 T to that at 1.5 T using an ASL technique in normal human subjects. This ASL technique was previ-ously validated at 1.5 T in a canine model [2].
The gold standard in human myocardial perfusion deter-mination is PET, and 13N-ammonia is considered the
tracer of choice, over 15O-water [21]. In the most recent 13N-ammonia PET study, Schepis, et al. found the MBF in
resting human subjects to be in the range of 0.81 ± 0.28 to 0.84 ± 0.25 mL/g/min, depending on the PET method used [22]. Additionally, Rahimtoola compiled eight 13
N-ammonia PET studies from the mid-1990's and found the range of MBF values (± 2 SD) in normal subjects to be approximately 0.40 to 1.50 mL/g/min [4]. In recent years, first-pass perfusion has been the primary CMR method used for the determination of myocardial perfusion.
Using this technique, Hsu, et al. found the perfusion rate in resting human subjects to be 1.02 ± 0.22 mL/g/min [23]. Thus, our perfusion data at both field strengths com-pare favorably with the data obtained with 13N-ammonia
PET and first-pass CMR.
Secondly, as anticipated, no significant difference was found between the myocardial perfusion data at the two different field strengths or between the perfusion data obtained by the two independent observers. The simula-tion results suggested the same finding; while the accuracy of perfusion data from the simulation at 3.0 T is some-what better than that at 1.5 T (as 3.0 T displayed a 61% reduction in error), this difference was not found to be statistically significant. Additionally, less variation was observed in the perfusion data from the two observers at 3.0 T as compared to 1.5 T. Concordantly, the repeatabil-ity of MBF measurements at 3.0 T improved to 0.21 from 0.37 at 1.5 T, although these differences were not statisti-cally significant. This is an improvement of approximately 43%; similar to the simulation result of a 38% improve-ment (P = NS). It should be noted that the absolute values of repeatability are much smaller than the measured ones, suggesting other errors contribute significantly, in addi-tion to the effect of SNR. These errors may include incom-pletely labeled spins [24], transition time error [25], and imperfect slice profiles of data acquisition RF pulses [26]. Our simplified simulation accounted for none of these, and therefore, further investigations are needed to incor-porate the effects of these error sources.
Limitations
The major limitation of the ASL technique remains high sensitivity to motion. The requirement of ECG-gating and breath-holding for the duration of each series is not com-pletely effective in eliminating cardiac and respiratory motion. Additionally, patient movement between the two back-to-back series introduced potential perfusion quan-tification error associated with inter-acquisition motion since the selective and non-selective scans were performed sequentially. All of these types of motion can lead to blur-ring and image distortion. In terms of the future applica-tion of this technique to patients, these moapplica-tion types will be significant because patients requiring perfusion analy-sis will likely suffer from a myriad of comorbidities. It might be unreasonable to request a breath-hold of nearly 20 seconds in some patients, such as those with severe car-diovascular or respiratory disease.
Another limitation is associated with the MBF equation that was used in this study. This equation uses differences in T1 values between the slice-selective and nonselective acquisitions, rather than differences in signal intensity val-ues, to calculate MBF. Notably, Zhou and van Zijl have theorized that in FAIR techniques, T1 value differences
[image:5.612.56.294.86.365.2]Perfusion maps at 1.5 T and 3.0 T
Figure 2
Perfusion maps at 1.5 T and 3.0 T, demonstrating a more uniform myocardial perfusion distribution at 3.0 T.
Normalized dynamic curves of T1 recovery
Figure 3
between the slice-selective and nonselective acquisitions may be increased or decreased, depending on the transit time of the "tagged bolus," while the signal intensity dif-ference is always decreased [27]. The unpredictability of the effect of transit time makes it impossible to control for this source of error when T1 value differences are used to calculate MBF. In addition to this, perfusion quantifica-tion using FAIR techniques is susceptible to many sources
of error, including macrovascular flow [28-30], radiation damping [31], the longer T1 of arterial blood [28,32,33],
and imperfect inversion profiles [34].
There are two main limitations unique to the use of a 3.0 T MRI system for these techniques. First, the specific absorption rate (SAR) quadruples with the doubling of the field strength from 1.5 T to 3.0 T. This often necessi-tates increased repetition times and, consequently, increased examination durations. Second, magnetic sus-ceptibility artifacts are more prominent at 3.0 T, particu-larly at the boundary of myocardial tissue and lung air, as well as the boundary of the myocardium and ventricular blood. The ROI was drawn at the center of the myocar-dium to avoid these effects. Nonetheless, imperfect mag-netic shimming might still lead to these artifacts in some large subjects at 3.0 T. This was not often observed with the 1.5 T system.
[image:7.612.56.557.101.259.2]Finally, this study quantified myocardial perfusion at rest. Such measurement may be helpful to monitor the efficacy of medical therapy in patients with cardiovascular disease. The next step in the study of this technique is to evaluate its efficacy during adenosine- or dipyridamole-induced vasodilatation. This would facilitate the determination of myocardial perfusion reserve, a more important clinical parameter. A study including this parameter as an end-point would be likely to demonstrate a greater reduction in the magnitude of error from 1.5 T to 3.0 T because the percent error of perfusion reserve is proportional to the percent error of myocardial perfusion during stress. The latter percent error would be greatly reduced during vasodilatation, when perfusion is three-to-four-fold greater than at rest [2].
Table 1: The 8 subjects' mean T1 values (in msec) from Observer 1.
1.5 T 3.0 T
Subject T1, Blood T1, GS T1, SS T1, Blood T1, GS T1, SS
1 1743.1 ± 29.5 1003.0 ± 10.9 973.9 ± 11.9 2045.2 ± 25.0 1317.5 ± 5.6 1267.9 ± 13.0
2 1612.6 ± 10.8 1012.1 ± 12.2 987.6 ± 34.2 1856.0 ± 10.0 1306.0 ± 17.9 1268.7 ± 23.6
3 1506.4 ± 24.6 1037.0 ± 1.7 1016.3 ± 8.0 1863.3 ± 39.8 1281.4 ± 7.0 1248.3 ± 11.6
4 1622.0 ± 87.2 839.4 ± 3.2 823.2 ± 2.3 1769.7 1269.7 1219.1
5 1707.2 ± 14.0 1044.0 ± 10.8 1010.3 ± 22.2 1903.7 ± 27.3 1332.1 ± 15.0 1289.3 ± 31.3
6 1589.3 ± 41.1 1046.6 ± 18.6 1014.5 ± 29.9 1889.0 ± 21.8 1318.9 ± 27.9 1274.8 ± 28.1
7 1813.0 ± 89.3 964.7 ± 5.5 915.3 ± 1.4 1860.7 ± 30.6 1253.6 ± 3.9 1200.9 ± 13.4
8 1662.4 ± 117.8 995.3 ± 9.1 971.5 ± 1.2 1793.4 ± 2.5 1287.8 ± 13.1 1240.7 ± 2.3
Mean 1657.4 ± 96.2 992.4 ± 67.9 963.6 ± 65.8 1871.0 ± 85.0 1290.2 ± 33.2 1236.2 ± 55.2
T1, Blood = T1 of the left ventricular blood pool; T1, GS = T1 of the myocardium after the nonselective IR pulse; T1, SS = T1 of the myocardium after the slice-selective IR pulse.
The average SNR of the LV blood pool (nonselective sequences) and the entire LV myocardial ring (slice-selective and nonselective sequences), calculated from the final acqui-sition of each sequence
Figure 4
[image:7.612.56.295.399.622.2]Conclusion
This work suggests that CMR ASL can be used to quantify myocardial perfusion at rest in humans with relative accu-racy. However, there are several limitations to this tech-nique, to the MBF equation that was used, and to the use of the error simulation to assess accuracy that must tem-per this suggestion. Furthermore, no significant difference in the use of 1.5 T and 3.0 T systems, in terms of the accu-racy and repeatability of myocardial perfusion quantifica-tion, was found. However, 3.0 T did demonstrate a significantly higher SNR that yielded slightly improved repeatability, slightly less variation in perfusion data, and more uniform signals in perfusion maps. With continued success, this technique could be applied to patients with
significant perfusion defects and eventually become part of the standard clinical work-up of patients with ischemic heart disease.
Abbreviations
[image:8.612.59.549.469.657.2]ASL: arterial spin labeling; CMR: cardiovascular magnetic resonance; ECG: electrocardiogram; FAIR: flow-sensitive alternating inversion recovery; GE: gradient echo; IR: inversion recovery; LV: left ventricle; MBF: myocardial blood flow; NonS: non-slice-selective prepared sequence; PET: positron emission tomography; ROI: region of inter-est; Sel: slice-selective prepared sequence; SNR: signal-to-noise ratio; SSFP: steady-state free precession; TI: inver-sion time.
Table 2: The 8 subjects' demographic data, scan characteristics, perfusion data, and motion ratings from Observer 1.
Pairs of series Average MBF (mL/g/min) Average motion rating per pair of series
Subj Age/Sex 1.5 T 3.0 T 1.5 T 3.0 T 1.5 T Type 3.0 T Type
1 22/F 3 3 0.951 ± 0.371 1.060 ± 0.184 0 - 0.33 S
2 20/M 3 3 0.871 ± 0.802 0.874 ± 0.179 1 S 2.67 R
3 23/M 3 2 0.745 ± 0.243 0.789 ± 0.133 0.67 R 1 S, R
4 24/F 2 1 0.678 ± 0.268 1.296 2 R 1 S
5 22/M 3 3 1.088 ± 0.397 0.968 ± 0.438 1.67 S, R 0.67 S, R
6 22/F 3 3 1.102 ± 0.449 1.010 ± 0.043 3.67 S, C 1.67 C
7 18/M 3 3 1.641 ± 0.169 1.303 ± 0.301 1 S, R 2.67 S, R, C
8 24/M 2 2 0.844 ± 0.222 1.169 ± 0.268 0 - 0.5 C
Mean 21.9 ± 2.0 0.990 ± 0.302 1.058 ± 0.187 1.25 ± 1.21 1.31 ± 0.93
"Pairs of series" denotes each set of back-to-back series. The motion ratings are on a scale of 0 to 5, with 0 representing no detectable motion and 5 representing severe motion artifacts. Subj = subject; S = interseries motion or motion between the pair of series; R = respiratory motion; C = cardiac motion.
Bland-Altman plots comparing the myocardial perfusion data obtained by the two independent observers (MBF1 and MBF2) at 1.5 T (A) and 3.0 T (B)
Figure 5
Publish with BioMed Central and every scientist can read your work free of charge
"BioMed Central will be the most significant development for disseminating the results of biomedical researc h in our lifetime."
Sir Paul Nurse, Cancer Research UK
Your research papers will be:
available free of charge to the entire biomedical community
peer reviewed and published immediately upon acceptance
cited in PubMed and archived on PubMed Central
yours — you keep the copyright
Submit your manuscript here:
http://www.biomedcentral.com/info/publishing_adv.asp
BioMedcentral
Competing interests
The authors declare that they have no competing interests.
Authors' contributions
BEN participated in the study design, analyzed the data, and drafted the manuscript. KSM participated in the study design, carried out the computer simulations, and ana-lyzed the data. HZ and SR coordinated subject recruit-ment, carried out the CMR examinations, and analyzed the early data. PKW, RJG, and JZ conceived of the study, participated in its design, and supervised all aspects of the study.
References
1. Wei K, Kaul S: The coronary microcirculation in health and disease. Cardiol Clin 2004, 22(2):221-31.
2. Zhang H, Shea SM, Park V, Li D, Woodard PK, Gropler RJ, Zheng J:
Accurate myocardial T1 measurements: toward quantifica-tion of myocardial blood flow with arterial spin labeling.
Magn Reson Med 2005, 53(5):1135-42.
3. L'Abbate A, Sambuceti G: How to study coronary microvascular dysfunction and its clinical relevance. Ital Heart J 2002,
3(4):230-6.
4. Rahimtoola SH: Hibernating myocardium has reduced blood flow at rest that increases with low-dose dobutamine. Circu-lation 1996, 94:3055-61.
5. Belle V, Kahler E, Waller C, Rommel E, Voll S, Hiller KH, Bauer WR, Haase A: In vivo quantification of cardiac perfusion in rats
using a noninvasive MR spin-labeling method. J Magn Reson
Imaging 1998, 8(6):1240-5.
6. Kim SG: Quantification of relative cerebral blood flow change by flow-sensitive alternating inversion recovery (FAIR)
tech-nique: application to functional mapping. Magn Reson Med
1995, 34(3):293-301.
7. Waller C, Kahler E, Hiller KH, Hu K, Nahrendorf M, Voll S, Haase A, Ertl G, Bauer WR: Myocardial perfusion and intracapillary blood volume in rats at rest and with coronary dilatation: MR imaging in vivo with use of a spin-labeling technique. Radiology 2000, 215(1):189-197.
8. Waller C, Hiller KH, Kahler E, Hu K, Nahrendorf M, Voll S, Haase A, Ertl G, Bauer WR: Serial magnetic resonance imaging of microvascular remodeling in the infracted rat heart. Circula-tion 2001, 103(11):1564-9.
9. Bauer WR, Hiller KH, Galuppo P, Neubauer S, Köpke J, Haase A, Waller C, Ertl G: Fast high-resolution magnetic resonance imaging demonstrates fractality of myocardial perfusion in microscopic dimensions. Circ Res 2001, 88(3):340-346. 10. Wacker CM, Fidler F, Dueren C, Hirn S, Jakob PM, Ertl G, Haase A,
Bauer WR: Quantitative assessment of myocardial perfusion with a spin-labeling technique: preliminary results in patients
with coronary artery disease. J Magn Reson Imaging 2003,
18(5):555-560.
11. Bergmann SR, Fox KA, Rand AL, McElvany KD, Welch MJ, Markham J, Sobel BE: Quantification of regional myocardial blood flow in vivo with H215O. Circulation 1984, 70:724-733.
12. McCommis KS, Zhang H, Herrero P, Gropler RJ, Zheng J: Feasibility study of myocardial perfusion and oxygenation by noncon-trast MRI: comparison with PET study in a canine model.
Magn Reson Imaging 2008, 26:11-19.
13. Lotz J, Döker R, Noeske R, Schüttert M, Felix R, Galanski M, Gutber-let M, Meyer GP: In vitro validation of phase-contrast flow measurements at 3 T in comparison to 1.5 T: precision, accuracy, and signal-to-noise ratios. J Magn Reson Imaging 2005,
21:604-610.
14. Norris DG: High field human imaging. J Magn Reson Imaging 2003, 18:519-529.
15. Merkle EM, Dale BM: Abdominal MRI at 3.0 T: the basics revis-ited. AJR 2006, 186:1524-32.
16. Edelstein WA, Glover GH, Hardy CJ, Redington RW: The intrinsic signal-to-noise ratio in NMR imaging. Magn Reson Med 1986,
3:604-618.
17. Schindera ST, Merkle EM, Dale BM, DeLong DM, Nelson RC:
Abdominal magnetic resonance imaging at 3.0 T: what is the ultimate gain in signal-to-noise ratio? Acad Radiol 2006,
13(10):1236-43.
18. Edelman RR, Manning WJ, Burstein D, Paulin S: Coronary arteries: breath-hold MR angiography. Radiology 1991, 181(3):641-3. 19. Zheng J, Li D, Cavagna FM, Harris K, Klocke FJ, Maggioni F, Carr J,
Simonetti O, Laub G, Finn JP: Contrast-enhanced coronary MR angiography: relationship between coronary artery delinea-tion and blood T1. J Magn Reson Imaging 2001, 14:348-354. 20. Kim HW, Klem I, Kim RJ: Detection of myocardial ischemia by
stress perfusion cardiovascular magnetic resonance. Cardiol Clin 2007, 25(1):57-70.
21. Nitzche EU, Choi Y, Czermin J, Hoh CK, Huang S-C, Schelbert HR:
Noninvasive quantification of myocardial blood flow in
humans: a direct comparison of the [13N] ammonia and the
[15O] water techniques. Circulation 1996, 93:2000-2006. 22. Schepis T, Gaemperli O, Treyer V, Valenta I, Burger C, Koepfli P,
Namdar M, Adachi I, Alkadhi H, Kaufmann PA: Absolute
quantifi-cation of myocardial blood flow 13N-ammonia and
3-dimen-sional PET. J Nuc Med 2007, 48(11):1783-9.
23. Hsu LY, Rhoads KL, Holly JE, Kellman P, Aletras AH, Arai AE: Quan-titative myocardial perfusion analysis with a dual-bolus
con-trast-enhanced first-pass MRI technique in humans. J Magn
Reson Imaging 2006, 23(3):315-22.
24. Holm DA, Sidaros K: Slice profile optimization in arterial spin
labeling using presaturation and optimized RF pulses. Magn
Reson Imaging 2006, 24:1229-1240.
25. Buxton RB: Quantifying CBF with arterial spin labeling. J Magn Reson Imaging 2005, 22:723-726.
26. Pell GS, Lewis DP, Ordidge RJ, Branch CA: TurboFLASH FAIR imaging with optimized inversion and imaging profiles. Magn Reson Med 2004, 51:46-54.
27. Zhou J, van Zijl PCM: Effect of transit times on quantification of
cerebral blood flow by the FAIR T1-difference approach.
Magn Reson Med 1999, 42:890-4.
28. Kwong KK, Chesler DA, Weisskoff RM, Donahue KM, Davis TL, Ostergaard L, Campbell TA: MR perfusion studies with T1
-weighted echo planar imaging. Magn Reson Med 1995,
34:878-887.
29. Schwarzbauer C, Morrissey SP, Haase A: Quantitative magnetic resonance imaging of perfusion using magnetic labeling of water proton spin within the detection slice. Magn Reson Med 1996, 35:540-546.
30. Yang Y, Frank JA, Hou L, Ye FQ, McLaughlin AC, Duyn JH: Multislice imaging of quantitative cerebral perfusion with pulsed arte-rial spin labeling. Magn Reson Med 1998, 39:825-832.
31. Zhou J, Mori S, van Zijl PCM: FAIR excluding radiation damping (FAIRER). Magn Reson Med 1998, 40:712-9.
32. Helpern JA, Branch CA, Yongbi MN, Huang NC: Perfusion imaging by uninverted flow-sensitive alternating inversion recovery (UNFAIR). Magn Reson Imaging 1997, 15:135-139.
33. Zhou J, van Zijl PCM: Perfusion imaging using FAIR with a short predelay. Magn Reson Med 1999, 41:1099-1107.