D
E
V
E
LO
P
M
E
N
T
INTRODUCTION
The evidence for the hemangioblast, the common progenitor of endothelial and hematopoietic cells, has been elusive until recently. Studies utilizing the in vitro differentiation model of ES cells have demonstrated that a subset of individual Flk-1+(Kdr – Mouse Genome Informatics) cells isolated from differentiating ES cells can produce both hematopoietic and endothelial cells in culture, providing a compelling case for the hemangioblast (Choi et al., 1998; Nishikawa et al., 1998). In further determining molecular markers of the hemangioblast, we recently showed that Flk-1+Scl+ (Scl: Tal1 – Mouse Genome Informatics) cells derived from differentiating ES cells are enriched for the hemangioblast (Faloon et al., 2000; Chung et al., 2002). In the developing embryo, brachyury+Flk-1+cells readily displayed hemangioblast activity as defined by their in vitro potential to form Blast colonies (Huber et al., 2004). High hemangioblast activity was detected in the posterior primitive streak, whereas distal primitive streak, the anterior region, the lateral domains, and the yolk sac had little hemangioblast activity. These studies suggest that the hemangioblast in the developing embryo arises within the primitive streak and rapidly differentiates into its progeny, hematopoietic and endothelial precursors. Thus, the bi-potentiality of the hemangioblast to generate blood and endothelial cells appears to be rapidly lost once the hemangioblast is formed, implicating a transient nature for the hemangioblast. Consistent with this notion, the bipotentiality of the EB (embryoid body, in vitro differentiated ES cells)-derived BL-CFC is highest when analyzed from the earliest stages of BL-BL-CFC formation (Choi et al., 1998).
The mechanisms that regulate the development and differentiation of the hemangioblast are poorly understood. BMP signaling is crucial for hematopoietic and vascular development (Larsson and Karlsson, 2005; Miyazono et al., 2005; Moser and Patterson, 2005). Recently, we demonstrated that BMP4 was sufficient to generate Flk-1+mesoderm (Park et al., 2004). Specifically, BMP4 was able to induce Flk-1+cells from the brachyury+stage of EB cells in serum free conditions, suggesting that BMP4 specifies differentiation of Flk-1+mesoderm from brachyury+mesoderm. The downstream effectors that mediate BMP signaling are unknown. However, BMP4 signaling has been implicated in activating expression of Gata2, an important regulator of multipotent hematopoietic precursor cells. Utilizing Xenopusanimal cap assays, Maeno et al. (Maeno et al., 1996) showed that injection of bmp4mRNA directly into animal caps activated Gata2gene transcription. Furthermore, Friedle and Knochel (Friedle and Knochel, 2002) showed that the transcriptional activation of Gata2was translation independent, as cycloheximide did not block Gata2transcription. The identification of a Bmp4 response element (BRE) in the 5⬘promoter region of zebrafish gata2
that binds Smad1 and Oct-1 provides further evidence for BMP4 mediated activation of gata2 (Oren et al., 2005).
In the current report, we undertook a global gene expression profiling approach to identify BMP4 targets during hematopoietic and vascular development. We compared gene expression profiles between Flk-1+Scl+cells, a subset of Flk-1+mesoderm that contains the putative hemangioblast cell population, and their differentiated progeny, Blast cells (Choi et al., 1998). Based on bioinformatic analysis of patterns of gene expression, the BL-CFCs resembled other multipotential stem cell populations. At the individual gene level, we noted that Gata2 was enriched in BL-CFCs. Our present studies indicate that Gata2is rapidly induced by BMP4 and that enforced GATA2 upregulates Bmp4expression. Enforced Gata2
expression also induced Flk-1+and Scl+cells in the absence of any added factors. GATA2 occupied regulatory elements at the Bmp4
and Sclloci in differentiating EBs. Importantly, the increase in Flk-1+and Scl+cell generation resulted in an expansion of Blast as well as primitive erythroid and endothelial cell progenitors. Systematic
GATA2 functions at multiple steps in hemangioblast
development and differentiation
Jesse J. Lugus1,2, Yun Shin Chung1, Jason C. Mills1, Shin-Il Kim3, Jeffery A. Grass3, Michael Kyba4,
Jason M. Doherty1, Emery H. Bresnick3and Kyunghee Choi1,2,*
Molecular mechanisms that regulate the generation of hematopoietic and endothelial cells from mesoderm are poorly understood. To define the underlying mechanisms, we compared gene expression profiles between embryonic stem (ES) cell-derived
hemangioblasts (Blast-Colony-Forming Cells, BL-CFCs) and their differentiated progeny, Blast cells. Bioinformatic analysis indicated that BL-CFCs resembled other stem cell populations. A role for Gata2, one of the BL-CFC-enriched transcripts, was further
characterized by utilizing the in vitro model of ES cell differentiation. Our studies revealed that Gata2was a direct target of BMP4 and that enforced GATA2 expression upregulated Bmp4, Flk1and Scl. Conditional GATA2 induction resulted in a temporal-sensitive increase in hemangioblast generation, precocious commitment to erythroid fate, and increased endothelial cell generation. GATA2 additionally conferred a proliferative signal to primitive erythroid progenitors. Collectively, we provide compelling evidence that GATA2 plays specific, contextual roles in the generation of Flk-1+mesoderm, the Flk-1+Scl+hemangioblast, primitive erythroid and
endothelial cells.
KEY WORDS: Embryonic stem, Hemangioblast, BMP4, GATA2, Flk1(Kdr1), Scl, Cell cycle Development 134, 393-405 (2007) doi:10.1242/dev.02731
1Department of Pathology and Immunology and 2Molecular Cell Biology Program,
Washington University School of Medicine, St Louis, MO 63110, USA. 3Department
of Pharmacology, University of Wisconsin Medical School, Madison, WI, USA.
4Center for Developmental Biology, University of Texas Southwestern Medical
Center, Dallas, TX, USA.
*Author for correspondence (e-mail: [email protected])
D
E
V
E
LO
P
M
E
N
T
modulation of Gata2 provided strong evidence for the transient nature of the hemangioblast. Additionally, enforced Gata2
expression in the primitive erythroid progenitor revealed its essential role in promoting cell cycle progression. Collectively, we provide compelling evidence for GATA2 function in hemangioblast generation and differentiation.
MATERIALS AND METHODS Cell culture
R1, A2Lox, iGATA2, J1 and Gata2–/–ES cells were maintained on PMEF
cells (Specialty Media-Chemicon, NJ) in DMEM with 15% pre-selected fetal calf serum (FCS), 2% LIF, 1% L-glutamine, 1% NEAA and 4.5⫻10–4 M MTG. Differentiation of ES cells to EBs has been previously described (Park et al., 2004). Briefly, cells were differentiated in IMDM containing 15% differentiation-screened FCS, 1% L-glutamine, 50 g/ml ascorbic acid and 4.5⫻10–4M MTG. Serum-free conditions substituted KNOCKOUT SR (Gibco BRL) for FCS and contained 5% PFHM II (Gibco BRL). GATA2 was induced in iGATA2 cells with 0.3 g/ml doxycycline (Dox). BMP4 (R&D Systems) was added at 5 ng/ml. Noggin (R&D Systems) was used at
10 ng/ml. Blast colonies were generated by harvesting cells at the indicated day, dissociating in trypsin, passaging through a 20G needle four to six times and plating in the presence of VEGF (5 ng/ml), kit ligand (1% conditioned media) and D4T endothelial cell conditioned media (25%) and with or without Dox for iGATA2 cells. Erythroid cells were generated in methylcellulose in the presence of 10% plasma-derived serum (PDS, Antech, TX), 5% PFHM II, ascorbic acid (12.5 g/ml), L-glutamine (2 mM), transferrin (300 g/ml, Boehringer Mannheim) and 2 units/ml EPO (Amgen, Thousand Oaks, CA)
GeneChip analysis
GeneChip results were analyzed in dChip (Li and Wong, 2001; Zhong et al., 2003). Median chip intensity and percent present call were similar across all chips and were within normal ranges; gene expression differences were determined using a 90% confidence interval of >1.2-fold and above, and a baseline to experimental intensity difference of >50. Genes enriched in each cell population (Blast or BL-CFC) were functionally categorized using GOurmet to determine distribution of the Gene Ontology (GO) (http://www.geneontology.org/) terms associated with each gene in the list (Doherty et al., 2006). For Fig. 1A, all genes in either the BL-CFC- or
Blast-BL-CFC
Blast
-3.0 -2.0 -1.0+1.0+2.0+3.0
0.02 BLAST
BL_CFC Brain (2)
Chief Cell (3)
Marrow (2)
Marrow (1)
Hematopoietic SC (2)
HSC_EST (1)
Neural_SC (2)
Gastric SC (3)
HSC (1)
Neural_SC (1)
0.06
0.05
0.03 0.1
0.02
0.06
0.04
0.04 0.03 0.02
Progenitor Cells
Progeny
0 5 10 15 20 25 30 35
BL_CF C
HSC (1)
HS
C (2) Blast
Marrow ( 1)
Marrow (2)
%
of
ge
ne
s
w
it
h gi
v
e
n G
O
t
e
rm nucleus
DNA binding
regulation of transcription, DNA-dependent nucleic acid binding
RNA binding 104408_s_at SRY-box containing gene 18
103075_at POU domain, class 5, transcription factor 1 103532_at eomesodermin homolog (Xenopus laevis) 93941_at brachyury
102789_at GATA binding protein 2 101430_at SRY-box containing gene 4 104712_at myelocytomatosis oncogene 101959_r_at transcription factor Dp 1 93615_at pre B-cell leukemia transcription factor 3 104698_at GATA binding protein 6
94325_at 3-hydroxy-3-methylglutaryl-Coenzyme A synthase 1 101150_at ets related protein 71
101631_at SRY-box containing gene 11 97994_at expressed sequence AI465550 96940_at TEA domain family member 2
102788_s_at paired-like homeodomain transcription factor 2 160662_r_at GATA binding protein 6
103538_at T-box 3
98408_at hematopoietically expressed homeobox 102069_at metal response element binding transcription factor 2 104275_g_at transformation related protein 53
92487_at SRY-box containing gene 7 160901_at FBJ osteosarcoma oncogene 96593_at ELK1, member of ETS oncogene family 93425_at interferon regulatory factor 5 94229_at RIKEN cDNA 0610009M14 gene 100440_f_at ankyrin 1, erythroid 96109_at Kruppel-like factor 2 (lung) 98010_at nuclear factor, erythroid derived 2 161139_f_at development and differentiation enhancing 94521_at cyclin-dependent kinase inhibitor 2D (p19, inhibits CDK4) 101396_at transcription factor 2
92926_at myeloproliferative leukemia virus oncogene 98002_at interferon consensus sequence binding protein 1 104155_f_at activating transcription factor 3 99158_at osteoclast stimulating factor 1 102641_at SFFV proviral integration 1
A
B
[image:2.612.50.557.273.569.2]C
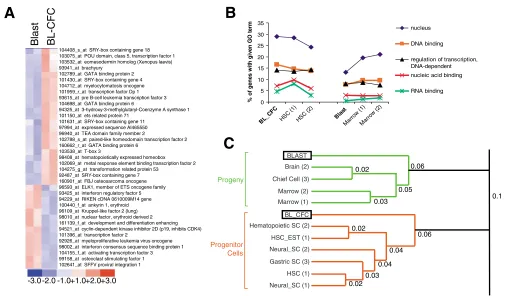
Fig. 1. Molecular profile of the hemangioblast and relationship to other stem cells.(A) The 37 genes representing the GO term ‘regulation of transcription, DNA-dependent’ were extracted from the list of 667 genes that were differentially expressed between BL-CFC and Blast and used to cluster the duplicate Blast and BL-CFC chips. The scale for relative enrichment of each transcript is depicted at the bottom: 3-fold or greater enrichment for a transcript on one chip relative to the other chips is depicted in dark red, whereas 3-fold less expression of that transcript is in dark
blue. (B) The five GO terms with the highest relative representation in the BL-CFC profile are graphed with respect to their fractional representation
among the genes of hematopoietic stem cells and their progeny, mature bone marrow cells, and also relative to the Blast profile. The
most-represented GO terms in the progenitor populations relate to nuclear functions, including synthesis of and binding to nucleic acids. (C) Expression
profiles (i.e.lists of genes enriched in a given cell population) from three previous analyses of progenitor and progeny gene expression were used to
D
E
V
E
LO
P
M
E
N
T
enriched lists that fell under the GO term ‘regulation of transcription, DNA-dependent’ were determined and a heat map of these genes was prepared using the Hierarchical Clustering feature of dChip. All GeneChip data will be uploaded to Gene Expression Omnibus (GEO) for archiving and sharing purposes.
GOurmet (Doherty et al., 2006) was also used to determine the distribution of all GO terms in a series of previously published expression profiles of stem cell populations with their paired differentiated progeny. In all cases, the lists of stem cell-enriched genes were determined by acquiring the original .DAT or .CEL chip files and simultaneously comparing replicate progenitor chips to replicate progeny chips using the same threshold criteria as for BL-CFC and Blast. GO distributions were determined for each cell population, and the lists were thereby hierarchically clustered (Fig. 1C). For further details of this approach see Mills et al. (Mills et al., 2002) and Doherty et al. (Doherty et al., 2006).
Gene expression analysis
RNA was purified using TRIzol (Invitrogen, CA), following the manufacturer’s protocol. Total RNA (1 g) was treated with DNase I and then annealed to 50 ng of random primers at 65°C. Reverse transcription was carried out with RNase H–Superscript II reverse transcriptase, 10 mM DTT, RNaseOUT (all from Invitrogen), and 1 mM dNTPs at 42°C for 1 hour. Reactions were diluted with DEPC-TE to 95 l followed by heat inactivation at 65°C for 15 minutes. Quantitative PCR (qPCR) reactions (15 l) contained 1 l cDNA, 7.5 l of iQ SYBR Green Supermix (BioRad), 0.15 l uracil DNA glycosylase (Invitrogen) and 200 nM each forward and reverse primers. Primer sequences are given in Table 1. The effect of BMP4 addition on Gata2expression was tested by growing R1 ES cells for 2 days in serum-free media (formulation as above). EBs were harvested on day 2. Cells were collected, washed once with 10 ml IMDM, resuspended in 1 ml IMDM, and incubated on ice for 20 minutes. Recombinant BMP4 (50 ng; R&D Systems) was added along with either 10 g/ml cycloheximide or DMSO as a vehicle control and cells were incubated for 5 minutes on ice before being transferred to 37°C
for the appropriate time period. After qRT-PCR, the expression level of Gata2in untreated EBs was normalized as 1, after being normalized against Gapdhvalues.
Chromatin immunoprecipitation
Chromatin immunoprecipitation (ChIP) assays were performed as previously described (Im et al., 2004). Day 4, 5 or 6 A2Lox EBs were harvested and crosslinked with 1% formaldehyde at room temperature for 10 minutes. Cells were lysed and chromatin slurry was incubated with Rabbit IgGs (PI) (Santa Cruz), GATA1, or GATA2 antibodies (Im et al., 2005). Genomic material was recovered for assessment by qPCR using the primers listed in Table 1.
Flow cytometry
For all FACS analyses, EBs were dissociated in 7.5 mM EDTA in PBS for 1.5 minutes at 37°C. Cells were then dissociated by passaging through a 20G needle 5-7 times prior to being resuspended in washing/staining buffer (4% FCS in PBS) and counted. Cells were resuspended at 5⫻106 cells/ml and plated into individual v-shaped wells of a 96-well plate at 5⫻105cells per well. Cells were incubated with primary antibodies for 15 minutes on ice, washed three times and then incubated on ice in the dark with secondary antibodies for 15 minutes. Cells were washed three times and analyzed using a Becton Dickinson FACS Caliber. For cell-sorting experiments, a MoFlo high speed flow cytometer (Dako, Fort Collins, CO) was used. The primary antibody was a biotinylated anti-human CD4 (Caltag, 1:500). Secondary antibodies include streptavidin-allophycocyanin (SP-APC, Pharmingen, 1:1000), anti-Flk-1-phycoerythrin (Flk-1-PE, Pharmingen, 1:200), anti-CD31-PE (CD31-PE, Pharmingen, 1:200), VE-Cadherin (Pharmingen, 1:200) and anti-Tie2-PE (anti-Tie2-PE, Pharmingen, 1:200).
Biochemical analysis of iGATA2 cells
[image:3.612.49.550.440.744.2]To examine the induction of GATA2 protein in iGATA2 cells, cells were differentiated in serum and the indicated amount of Dox was added at D2 of EB formation and cells were collected at D4 of EB formation.
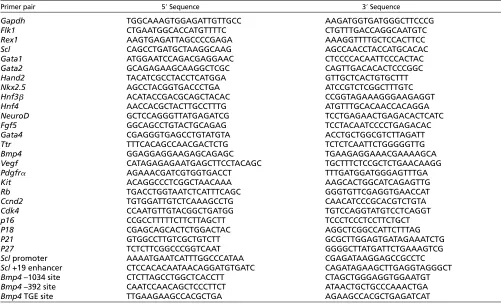
Table 1. Primers used for qRT-PCR and quantitative ChIP studies
Primer pair 5⬘Sequence 3⬘Sequence
Gapdh TGGCAAAGTGGAGATTGTTGCC AAGATGGTGATGGGCTTCCCG
Flk1 CTGAATGGCACCATGTTTTC CTGTTTGACCAGGCAATGTC
Rex1 AAGTGAGATTAGCCCCGAGA AAAGGTTTTGCTCCACTTCC
Scl CAGCCTGATGCTAAGGCAAG AGCCAACCTACCATGCACAC
Gata1 ATGGAATCCAGACGAGGAAC CTCCCCACAATTCCCACTAC
Gata2 GCAGAGAAGCAAGGCTCGC CAGTTGACACACTCCCGGC
Hand2 TACATCGCCTACCTCATGGA GTTGCTCACTGTGCTTT
Nkx2.5 AGCCTACGGTGACCCTGA ATCCGTCTCGGCTTTGTC
Hnf3 ACATACCGACGCAGCTACAC CCGGTAGAAAGGGAAGAGGT
Hnf4 AACCACGCTACTTGCCTTTG ATGTTTGCACAACCACAGGA
NeuroD GCTCCAGGGTTATGAGATCG TCCTGAGAACTGAGACACTCATC
Fgf5 GGCAGCCTGTACTGCAGAG TCCTACAATCCCCTGAGACAC
Gata4 CGAGGGTGAGCCTGTATGTA ACCTGCTGGCGTCTTAGATT
Ttr TTTCACAGCCAACGACTCTG TCTCTCAATTCTGGGGGTTG
Bmp4 GGAGGAGGAAGAGCAGAGC TGAAGAGGAAACGAAAAGCA
Vegf CATAGAGAGAATGAGCTTCCTACAGC TGCTTTCTCCGCTCTGAACAAGG
Pdgfr␣ AGAAACGATCGTGGTGACCT TTTGATGGATGGGAGTTTGA
Kit ACAGGCCCTCGGCTAACAAA AAGCACTGGCATCAGAGTTG
Rb TGACCTGGTAATCTCATTTCAGC GGGTGTTCGAGGTGAACCAT
Ccnd2 TGTGGATTGTCTCAAAGCCTG CAACATCCCGCACGTCTGTA
Cdk4 CCAATGTTGTACGGCTGATGG TGTCCAGGTATGTCCTCAGGT
p16 CCGCCTTTTTCTTCTTAGCTT TCCCTCCCTCCTTCTGCT
P18 CGAGCAGCACTCTGGACTAC AGGCTCGGCCATTCTTTAG
P21 GTGGCCTTGTCGCTGTCTT GCGCTTGGAGTGATAGAAATCTG
P27 TCTCTTCGGCCCGGTCAAT GGGGCTTATGATTCTGAAAGTCG
Sclpromoter AAAATGAATCATTTGGCCCATAA CGAGATAAGGAGCCGCCTC
Scl+19 enhancer CTCCACACAATAACAGGATGTGATC CAGATAGAAGCTTGAGGTAGGGCT
Bmp4–1034 site CTCTTAGCCTGGCTCACCTT CTAGCTGGGAGGTGGAATGT
Bmp4–392 site CAATCCAACAGCTCCCTTCT ATAACTGCTGCCCAAACTGA
D
E
V
E
LO
P
M
E
N
T
Subsequent steps were performed as previously described (Park et al., 2004). The GATA2 antibody used was the same as in the above ChIP experiments.
BrdU uptake assays
Assays were performed with the Cell Proliferation Biotrak ELISA System 2 (Amersham Biosciences). On day 2 or 3 of EryP formation, cells were recovered by cellulase treatment. Cells (3⫻103and 1⫻104) were labeled with BrdU and cultured overnight in media containing IMDM, 15% PDS and 2 units/ml EPO with or without Dox. Cells were prepared according to the manufacturer’s protocol for examination on a plate reader. A ‘no BrdU’ condition was set up to determine the background absorbance of the cells and subsequently subtracted from all values. ‘No Dox’ absorbance values were normalized to 1 and the absorbance of the Dox-treated cells was normalized against the control value to give a relative BrdU incorporation level.
EB sprouting assays
Assays were based upon aortic ring assays (Nicosia and Ottinetti, 1990a; Nicosia and Ottinetti, 1990b; Wang et al., 2004). Growth Factor Reduced Matrigel (BD Biosciences) was diluted 1:1 with IMDM containing 2% FCS and 50 l was plated into wells of a 96-well plate and allowed to polymerize for 40 minutes at 37°C. A single D6 EB was recovered from SR differentiation media and placed on the Matrigel bed, and an additional 50 l was then plated on top of the EB. The upper layer was incubated for 40 minutes at 37°C before media containing IMDM, 2%FCS and 30 ng/ml VEGF was added. EBs were cultured for an additional 6 days and the sprouting pattern was scored. For LDL uptake studies, the upper matrigel layer was omitted and DiL-Ac-LDL (Biomedical Technologies, Inc.) was added at 10 g/ml and incubated for 3 hours. Medium was removed and EBs washed three times with fresh media and then images captured.
RESULTS
Expression profiling of the hemangioblast
To identify genes involved in regulating the molecular pathway from mesoderm to hematopoietic and endothelial cells, we performed analyses of global gene expression in the in vitro hemangioblast (BL-CFC) cell population (i.e. Flk-1+Scl+cells from D2.75 EBs), and their differentiated progeny, Blast cells. Two independent hemangioblast and Blast cell populations were prepared and used to make parallel RNA samples and then each hybridized to Affymetrix U74Av2 GeneChips. The analyses of gene expression differences between the BL-CFC and Blast population resulted in 292 gene-symbol-annotated, unique transcripts that were enriched in the BL-CFC population, and 375 transcripts enriched in Blast cells. The 37 genes with transcription regulating functions that were enriched in the hemangioblast cell population are shown in Fig. 1A. We used a bioinformatic program that analyzes gene expression profiles based on the gene ontology (GO) terms representing the genes enriched in each profile (Doherty et al., 2006). This allowed us to define patterns across stem and differentiated cell datasets originating from several different investigators, each using different methods. Of the hemangioblast-enriched genes, about 30% were classified under the GO term ‘nucleus’, 15% each represented ‘DNA-binding’ and ‘regulation of transcription’, and 5-10% each were ‘nucleic acid-binding’ and ‘RNA-acid-binding’ genes (Fig. 1B). The enrichment in those GO terms caused the hemangioblast cell population to cluster with profiles of other stem cell populations including hematopoietic, neural and gastric stem cells (Fig. 1C). Thus, the analysis suggested considerable similarity in the types of genes expressed by stem cells of multiple tissues and, moreover, revealed the previously undescribed stem cell phenotype of the BL-CFCs.
Gata2 in differentiating ES cells
Our array data also provided us with potential targets that may be important for regulation of hemangioblast specification from mesoderm. We observed high expression of Gata2 in the
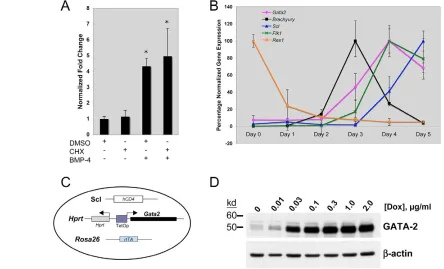
hemangioblast relative to its more committed progeny (Fig. 1A). Our previous data showed that BMP4 signals were able to induce Flk-1+as well as Scl+cells from ES cells in culture (Park et al., 2004). Thus, we tested if Gata2was a direct target of BMP4. To this end, we differentiated ES cells in serum-free [i.e. serum-replacement (SR)] media for 2 days, treated them with BMP4 and cycloheximide and then harvested EBs after an hour of stimulation to examine
Gata2expression. As shown in Fig. 2A, BMP4 treatment led to a
large increase in Gata2mRNA within 1 hour, and this increase was maintained in the presence of cycloheximide. This demonstrated that
Gata2was a direct target of BMP4 signaling. Importantly, Flk1and
Sclwere not upregulated following an hour of BMP4 treatment (not shown).
Next, we examined expression kinetics of Gata2in differentiating ES cells, in relationship to other key differentiation markers includingRex1(Zfp42– Mouse Genome Informatics), brachyury,
Flk1andScl. To this end, A2Lox ES cells, a derivative of E14Tg2a ES cells (see below), were differentiated for 5 days in serum-containing differentiation media and harvested at each day for qRT-PCR analysis. The ES gene Rex1 has been shown to be rapidly downregulated as ES cells begin to differentiate (Faloon et al., 2000). As expected, Rex1expression was rapidly downregulated after day 0 (D0) and expression was lost after D2 (Fig. 2B). Concurrently at D2 of differentiation, brachyury was detected and then peaked at D3. Shortly after the generation of brachyury+mesoderm, Gata2and
Flk1 were induced and their expression rapidly increased, peaking
at D4. Lastly, Sclexpression was detectable shortly after Flk1and peaked at D5 (Fig. 2B). Gata1and cKitbegan to be expressed at D4 and their expression increased at D5 and thereafter (not shown). These data indicate that as A2Lox ES cells differentiate and generate mesoderm, Gata2and Flk1are amongst the first genes expressed (Fig. 2B). Thus, consistent with previous reports from Xenopus
models, Gata2 is rapidly induced by BMP4 from brachyury+ mesoderm and precedes the generation of more committed hematopoietic genes in the ES/EB system.
The specification and differentiation of Flk-1+ mesoderm by GATA2
To determine if Gata2plays a role in hemangioblast development and differentiation, we utilized the ES/EB system. Given the expression kinetics of Gata2in differentiating EBs, we sought to induce GATA2 at specific stages of EB generation and differentiation to accurately address the role that GATA2 plays once ES cells have differentiated to mesoderm (brachyury+). To this end, we targeted the tet-responsive locus of A2Lox cells [an E14Tg2a-based ES cell line, similar to Ainv15 (Kyba et al., 2002), but with superior targeting efficiency (M.K., unpublished)] with the Gata2
cDNA. To facilitate detection of Scl-expressing cells, we also knocked-in a non-functional human CD4 (hCD4) into the Scllocus, as described previously (Chung et al., 2002) (Fig. 2C). Once the correct targeting event was confirmed by a tet-responsive locus/cDNA-vector-specific PCR, inducible Gata2expression was verified by adding doxycycline (Dox) to differentiating EB cells. As shown in Fig. 2D, exogenous GATA2 protein was readily detectable in day 4 EBs with Dox concentrations as low as 0.03 g/ml. For all subsequent studies with this inducible GATA2 (iGATA2) ES cell line, we applied 0.3 g/ml of Dox, at which concentration no cytotoxicity was observed (not shown).
D
E
V
E
LO
P
M
E
N
T
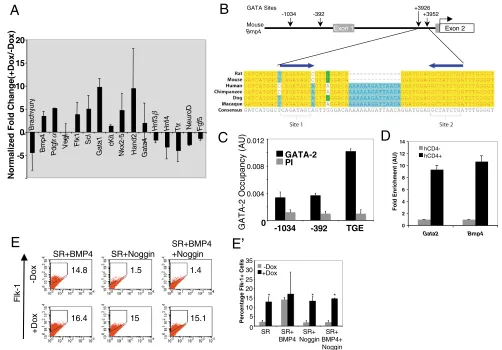
profile was examined. To assess the genetic program mediated by GATA2, we utilized a candidate gene approach to examine a number of specific cell types including mesoderm, hematopoietic, cardiogenic, endoderm and ectoderm (Fig. 3A). The expression of brachyury was downregulated in GATA2-induced cells as compared with non-induced control cells. As ES cells differentiated in SR media have a longer window of brachyury expression in the absence of differentiating cues such as BMP4 (Park et al., 2004), we reasoned that the expression of GATA2 accelerated the differentiation of brachyury+mesoderm into more-differentiated mesodermal derivatives. Accordingly, the expression of Bmp4and
Pdgfr␣ was increased, arguing that GATA2 promoted the
differentiation of mesoderm into its derivatives (Fig. 3A). We examined a set of genes that would provide insight into how GATA2 regulates the differentiation of Flk-1+mesoderm. Specifically, Flk1,
Scl, Gata1and Kit, were all expressed at higher levels when GATA2
was induced (Fig. 3A). Additionally, the cardiogenic genes Hand2,
Nkx2-5and Gata4were also upregulated upon GATA2 induction,
consistent with Flk-1+mesoderm giving rise to cardiac tissues (Iida et al., 2005; Kouskoff et al., 2005; Wang et al., 2006). Lastly, induction of GATA2 led to a marked reduction in the expression of the endodermal genes Hnf3(Foxa2– Mouse Genome Informatics),
Hnf4and Ttras well as the ectodermal genes Fgf5and Neurod1. In the context of mesoderm differentiation, GATA2 has a positive effect upon hematopoietic and cardiogenic mesoderm formation and suppresses endoderm and ectodermal lineages.
To analyze the mechanism whereby Bmp4 mRNA was
upregulated under GATA2 induction, we compared human BMP4
(Ensembl.org gene ENSG00000125378) and mouse Bmp4 loci (Ensembl ENSMUSG00000021835) utilizing the Vista web software (Frazer et al., 2004) (http://genome.lbl.gov/vista/ index.shtml) as well as the rVista program for identification of transcription factor-binding sites (Loots et al., 2002). We identified three conserved GATA-factor-binding sites (WGATAR, where W is A or T, and R is A or G) (Bresnick et al., 2005) between mouse and human: the first, 1034 bp upstream of the first exon (–1034 site); the second, 392 bp upstream of the first exon (–392 site); and an inverted repeat pair (Tandem GATA Enhancer, or TGE, site) located 3.9 kb into the first intron (Fig. 3B). This inverted repeat is similar to the pair seen in the Gata1locus capable of conferring Gata1activity in eosinophils (Yu et al., 2002). Moreover, this TGE site shows tremendous conservation amongst Mouse, Human, Rat, Dog, Monkey and Chimp (Fig. 3B). To examine whether these conserved sites were relevent in vivo, we used quantitative ChIP to measure GATA2-chromatin interactions in the parental A2Lox ES cell line. Specifically, A2Lox ES cells were differentiated for 4 days in serum and crosslinked to capture protein-DNA binding interactions. After immunoprecipitation with an anti-GATA2 antibody, the recovered genomic material was subjected to quantitative PCR. As shown in Fig. 3C, GATA2 occupied the TGE during stages of A2Lox ES cell differentiation. To confirm the relationship between GATA2 and
[image:5.612.53.497.363.632.2]Bmp4expression, we took advantage of the knock-in SclhCD4/+allele
Fig. 2. GATA2 in differentiating ES cells and the generation of inducible ES cells.(A) Rapid induction of Gata2upon short-term treatment
with BMP4. ES cells were differentiated for 2 days in the absence of serum, collected and treated with BMP4, or 10 g/ml cycloheximide (CHX), or
DMSO for 1 hour. Gata2expression was analyzed and normalized to Gapdh. The quantity of Gata2expressed in untreated cells was normalized as
1 and used to determine the Gata2quantity in BMP4-treated samples. Values indicate mean±s.e.m.; *, P<0.01 versus control. (B) Expression
kinetics of candidate genes in A2Lox ES cells. RNA from EBs differentiated in serum was utilized in qRT-PCR assays. Candidate genes were first
normalized against Gapdhand then the maximal expression for each gene was assigned 100% and the according value for each EB day
determined against this 100% value. (C) Schematic of the iGATA2 ES line used, with indicated loci carrying alterations allowing for production of
the rtTA, expression of the Gata2cDNA and generation of hCD4 as a surrogate marker for Scl. (D) Western blot of the iGATA2 ES line. Cells were
differentiated in serum for two days, treated with the indicated concentrations of Dox and differentiated for two additional days. EB lysates were
D
E
V
E
LO
P
M
E
N
T
in iGATA2 ES cells and reasoned that hCD4+cells generated by Dox addition (see below) could be used to isolate cells that expressed exogenous GATA2. As shown in Fig. 3D, in cells sorted as hCD4+, there was a large enrichment of both Gata2and Bmp4, indicating that the expression levels of Bmp4correlated toGata2expression. This suggests a unique regulatory mechanism whereby BMP4 is capable of inducing Gata2 expression and GATA2 in turn contributes to the direct activation of Bmp4.
To understand the relationship between BMP4 and GATA2 in the generation of Flk-1+ mesoderm, iGATA2 cells were differentiated in SR media. At D2, cells were treated with various combinations of BMP4, noggin and Dox to assess GATA2 function in generating Flk-1+cells (Fig. 3E,E⬘). As previously
reported (Park et al., 2004), the addition of BMP4 was sufficient to generate Flk-1+cells. More importantly, GATA2 alone could also generate Flk-1+cells. When GATA2 was induced in the presence of BMP4, the Flk-1+ cell generation was similar. Furthermore, GATA2 could still generate Flk-1+ cells when BMP4 was blocked by noggin. We compared the human KDRand mouse Flk1loci for regions of homology and discovered three conserved GATA-binding sites within 10 kb upstream of the Flk1
gene. However, ChIP assays did not indicate in vivo occupancy by either GATA2 or GATA1. Collectively, these data argue that GATA2 is a downstream component of BMP4-mediated signals that regulate Flk-1+mesoderm generation, but that such regulation is not mediated by the 10 kb proximal region of Flk1.
-10
-5 0 5 10 15 20
Brachyury
Bmp
4
Pdgfr
α
Vegf Flk1 Scl
Gat
a1 cKit
Nkx2-5
Hand2 Gata4
Hnf3
β
Hn
f4
Ttr NeuroD Fgf5
Normalized Fold Change(+
D
o
x
/-D
o
x
)
A
E’
0 0.004 0.008 0.012
-1034 -392 TGE
GATA-2 PI
C
B
-Dox
+D
o
x
14.8
15.1 15
1.4 1.5
16.4
SR+BMP4 SR+Noggin
SR+BMP4 +Noggin
Flk-1
E
0 5 10 15 20 25 30 35
SR SR+ BMP4
SR+ BMP4+ Noggin
P
e
rc
e
n
ta
g
e
Flk-1+
Cells +Dox-Dox
* * *
SR+ Noggin
+3926
Exon 1 Exon 2
2 5 9 3 + 2
9 3 -4 3 0 1 -GATA Sites
Mouse
Bmp4
0 2 4 6 8 10 12 14
Gata2 Bmp4
Fold Enrichment (AU)
hCD4-hCD4+
D
GATA-2 Occupancy
[image:6.612.53.555.62.412.2](AU)
Fig. 3. Enforced GATA2 results in an increase in mesodermal gene expression.(A) iGATA2 ES cells were differentiated for 2 days in SR and
treated with 0.3 g/ml Dox for an additional 2 days. RNA was then utilized for qRT-PCR to examine the genes indicated. Genes were normalized
against Gapdhand then the ratio of the gene quantity (+Dox) to gene quantity (–Dox) was determined to yield normalized fold change. (B) Upper
portion depicts the mouse Bmp4locus. Gray boxes are non-translated exons and the open box indicates the translated exon. Coordinates and
arrows indicate conserved, consensus GATA-factor-binding sites. Enlarged below is a section containing the TGE of a 5⬘to 3⬘alignment of highly
conserved, intronic regions of homologs of the Bmp4gene. GATA sites 1 and 2 are indicated by brackets; arrows above the alignment indicate
GATA site orientation. (C) ChIP analysis of GATA2 occupancy of the Bmp4locus in D4 EBs. A2Lox ES Cells were differentiated for 4 days in serum,
crosslinked with 1% formaldehyde and processed to examine GATA2 occupancy at the three conserved consensus GATA-factor-binding sites. (D)
Bmp4enrichment in Gata2-expressing cells. iGATA2 ES cells were differentiated in SR medium for 4 days and Dox added on D2. At D4, cells were
stained for hCD4 expression and sorted into hCD4–and hCD4+and then RNA generated for qRT-PCR to examine co-enrichment of Gata2and
Bmp4in hCD4+cells. (E) FACS analyses of Flk-1+cell generation by GATA2 and BMP4. Cells were differentiated in SR medium for 2 days and then
treated with combinations of Dox (0.3 g/ml), BMP4 (5 ng/ml) and noggin (10 ng/ml). Cells were utilized for FACS analyses on D3. Numbers
indicate percentage of Flk-1+cells generated. (E⬘) Summary data of four independent sets of FACS experiments showing the percentage of Flk-1+
D
E
V
E
LO
P
M
E
N
T
Hemangioblast, hematopoietic and endothelial cell generation by GATA2
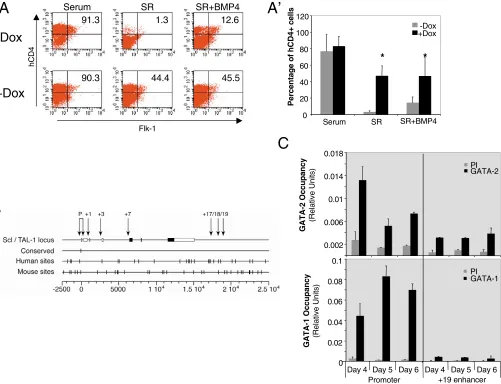
To determine the role of GATA2 in the generation of Scl+cells and their progeny, iGATA2 cells were differentiated in serum, SR, or SR containing BMP4 in the presence or absence of Dox (at D2 of culture), and hCD4+cells were assessed by FACS analyses on D4 or D5. Previous work has shown that BMP4 could generate a moderate level of hCD4+cells in the absence of serum but that a more robust level of hCD4+cells could be generated when BMP4 and vascular endothelial growth factor (VEGF) were added together (Park et al., 2004). Fig. 4A shows that the induction of GATA2 in the absence of serum resulted in a high level (~50%) of hCD4+cells at D5, whereas less than 3% of cells became hCD4+in SR media. Importantly, GATA2 induction did not increase the expression of Vegf, arguing that GATA2 induction of Scl+ cells is independent of VEGF signaling (Fig. 3A). Consistent with previous studies (Park et al.,
2004), the addition of BMP4 to the media was able to augment generation of hCD4+cells to ~13%. There was no additive effect between BMP4 and GATA2 on Scl expression, as the addition of BMP4 to cells with enforced GATA2 expression did not change the generation of hCD4+cells as compared with that of GATA2 alone (Fig. 4A,A⬘).
We analyzed the mechanism whereby GATA2 activated Scl
expression during early embryonic and hematopoietic development. Similar to the promoter analysis described above for the
BMP4/Bmp4loci, we compared more than 25 kb of the human SCL
(Ensembl: ENSG00000162367) and mouse Scl (Ensembl:
ENSMUSG00000028717) loci using the Vista and rVista programs. We first found consensus GATA-factor-binding sites (Bresnick et al., 2005) and then determined which of these sites were conserved between human and mouse. Strikingly, although there were abundant WGATAR sites in both species (27 in human, 33 in
hCD4
Flk-1
-Dox
+Dox
0 20 40 60 80 100 120
Serum SR SR+BMP4
Percentage of hCD4+ cells
-Dox +Dox
*
*
’
A
A
B
C
6 . 2 1 3
. 1 9
45.5 44.4
1.3
90.3
SR+BMP4 SR
Serum
0.002 0.006 0.01 0.014 0.018
GATA-2 Occupancy
(Relative Units)
PI GATA-2
GATA-1 Occupancy
(Relative Units)
0 0.02 0.04 0.06 0.08 0.1
Day 4 Day 5 Day 6 Day 4 Day 5 Day 6 Promoter +19 enhancer
[image:7.612.60.561.257.641.2]PI GATA-1
Fig. 4. GATA2 regulates Scl expression. (A) FACS data of hCD4+(Scl+) cell generation. Cells were grown in serum, SR, or SR+BMP4 as indicated,
were treated with or without Dox at D2, and FACS performed on D5 for Flk-1+and hCD4+cells. Numbers indicate total percentage of hCD4+cells
(Flk-1+hCD4+and Flk-1-hCD4+). (A⬘) Summary data of five independent sets of FACS experiments showing the percentage of hCD4+cells
generated in each condition. Values indicate mean±s.e.m.; *, P<0.01 versus untreated. (B) Comparison of human SCLand mouse Sclloci. P
indicates alternate promoters, and numbers indicate DNase I hypersensitive sites (Gottgens et al., 2002). Black boxes and white boxes indicate translated and untranslated exons, respectively. Vertical dashes indicate consensus (WGATAR) GATA-factor-binding sites. The bottom line indicates
general locus coordinates, where 1 is the start of transcription. (C) Quantitative ChIP assays for GATA-factor occupancy of the Scl loci. Upper panel
D
E
V
E
LO
P
M
E
N
T
mouse), only a single site was conserved between the two species (Fig. 4B). This site, identified in the human SCLgene as capable of binding GATA1 and GATA2, is 37 bp upstream of the transcriptional start site of SCL (Aplan et al., 1992). In the mouse locus, this site resides 34 bp upstream of the transcriptional start site. Importantly, the GATA site in the +19 enhancer region previously posited to confer hematopoietic specificity during development (Gottgens et al., 2002; Gottgens et al., 2004) was not a consensus WGATAR site in human. We examined the Scllocus during differentiation in the parental A2Lox ES line, reasoning that GATA-factor-binding may be developmentally dynamic in the control of Scl. To this end, we performed quantitative ChIP analyses using D4, D5 and D6 EBs and tested both GATA2 and GATA1 occupancy at the –34 promoter site as well as the +19 enhancer site (Fig. 4C). At D4 of EB formation, which is the early stage of Scl+ cell generation, GATA2 preferentially occupied the Sclpromoter. GATA1 was also detected
at the promoter at D4 and importantly, as differentiation progressed, GATA2 was displaced from the promoter and GATA1 was bound at higher levels at D5 and D6. During all stages of EB development, negligable signals were detected at the +19 enhancer (Fig. 4C).
Acquisition of Sclexpression within Flk-1+cells points to a differentiation cue for the hemangioblast (Chung et al., 2002; Park et al., 2005). To determine if GATA2 plays a role in the generation and differentiation of the hemangioblast, we first differentiated J1(WT) and Gata2–/–ES cells and replated these cells for Blast colonies. As shown in Fig. 5A, Gata2–/–cells generated far fewer
Blast colonies as compared with wild-type ES cells. Furthermore, the expression of Scland Gata1was signficantly lower in Gata2–/–
EBs, consistent with the upregulation of these genes in induced iGATA2 cells (Fig. 5B). Next, we performed assays for Blast colonies and primitive erythroid (EryP) cells as well as FACS analyses for cells expressing endothelial surface markers using
A
0 500 1000 1500 2000 2500 3000
WT Gata2
-/-Number of Blast colonies
per 2x10
5 cells
*
0 0.2 0.4 0.6 0.8 1 1.2
WT Gata2
-/-Normalized Gene
Expression *
Scl
0 0.2 0.4 0.6 0.8 1 1.2
WT Gata2
-/-Normalized Gene
Expression
* Gata1
0 1000 2000 3000 4000 5000
Number of EryP Colonies Generated
per 2x10
5 Cells -Dox +Dox D2 *
B
C
D
0 2000 4000 6000 8000 10000
D2.25 D2.5 D2.75 D3
Number of Colonies
per 2x10
5 cells
No Dox / No Dox No Dox / Dox Dox / No Dox Dox / Dox
** **
** **
**
[image:8.612.51.549.256.634.2]** ** *
Fig. 5. GATA2 specifies hemangioblast development.(A) Blast colony formation in wild-type (WT) (J1) or Gata2–/–ES cells. Values are
mean±s.e.m. for three independent experiments; *, P<0.05 versus WT. (B) qRT-PCR of Scl(left panel) and Gata1(right panel) in WT and Gata2–/–ES
cells. RNA was from D5 EBs and normalized against Gapdh. Values are mean±s.e.m., from qRT-PCR reactions perfomed in triplicate using two
independent RNA samples; *, P<0.05 versus WT. (C) GATA2 induction scheme in differentiating EBs and formation of Blast colonies. Above is the
D
E
V
E
LO
P
M
E
N
T
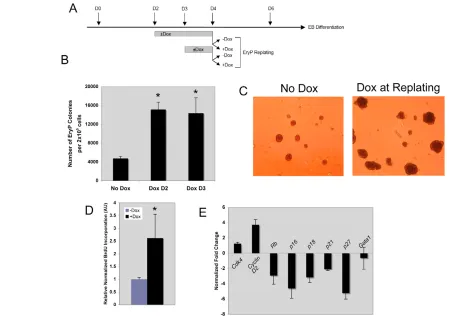
iGATA2 ES cells. In differentiating ES cells, the highest Blast colony number is typically obtained by replating D2.75 EB cells, as represented by the blue bars (No Dox/No Dox) in Fig. 5C. We first determined whether induction of GATA2 augments BL-CFC generation. To this end, Dox was added to differentiating EBs on D2 and EBs were replated on D2.75 for Blast colony assays. As shown in Fig. 5C, there was no increase in Blast colony number (Dox/No Dox). Rather, the number of Blast colonies was reduced when Dox was added on D2 (Fig. 5C, yellow bars). Even when we replated at earlier time points, specifically D2.25 and D2.5, we saw no significant increase in the number of Blast colonies generated (Fig. 5C, yellow bars). We reasoned that the induction of GATA2 from D2 may drive the hemangioblast to rapidly differentiate into its progeny. Thus, we evaluated the induction of GATA2 at the time of replating. As shown in Fig. 5C, the Blast colony number was greatly increased when Dox was added solely to the replating media (No Dox/Dox). This was true for all EB replating time points, i.e. D2.25, D2.5, D2.75 and D3 (Fig. 5C, orange bars). We saw no difference in the percentage of individual Blast colonies capable of generating both hematopoietic and endothelial cells between induced and control cells (not shown). Lastly, induction of GATA2 from D2 and in the
replating media (Dox/Dox, green bars in Fig. 5C) generated an increase in Blast colonies at early stages (D2.25-D2.5 replating), but resulted in no change in colony number, as compared with untreated control cells (Fig. 5C, blue bars), at later time points (D2.75 and D3 replating). The systemic modulation scheme of Gata2expression suggested a true transient nature of the hemangioblast. If the hemangioblast were truly transient, we reasoned that the induction of GATA2 from D2 would lead to the precocious emergence of EryP cells. To this end, D2.75 EBs that had been treated with Dox at D2 were replated for EryP colonies. Whereas a modest number of EryP colonies could be generated from untreated D2.75 EBs, GATA2 induction led to a significant increase in EryP colonies, similar to the number generated from untreated D4 EBs (the peak of EryP colony generation) (compare Fig. 5D with Fig. 6B).
[image:9.612.53.507.314.632.2]We next determined if GATA2 could directly affect the generation of EryP colonies independent of hemangioblast formation (i.e. at a time after the period when the transient hemangioblast is present). To this end, we compared the generation of EryP colonies in iGATA2 cells induced from D2 and D3. We discovered that the addition of Dox at D2 or D3 generated significantly higher numbers of EryP colonies as compared with non-induced cells (Fig. 6B).
Fig. 6. Augmented EryP generation and cell proliferation by GATA2.(A) GATA2 induction scheme in differentiating EBs and formation of EryP colonies. Above is the scheme used to generate Blast colonies. Uppermost numbers indicate EB day. Lower gray bars indicate duration of Dox
treatment and subsequent treatment of replated EBs. (B) EryP potential of D4 iGATA2 EBs treated with or without Dox at D2 or D3. Values are
mean±s.e.m., from four independent experiments; *, P<0.05 versus untreated. (C) Representative bright field images (100⫻) of EryP colonies from
D4 EBs replated in the absence (left) or presence (right) of Dox. (D) BrdU incorporation in EryP cells treated with or without Dox during replating.
Values are normalized by subtracting background absorbance and then the BrdU incorporation in untreated EryP cells is normalized to 1. Values are
mean±s.e.m. from six independent experiments; *, P<0.005 versus untreated. (E) Cell cycle gene expression profile of iGATA2 EryPs with or without
Dox during EryP colony formation. EryP cells from day 2 or 3 of EryP colony formation were harvested and RNA utilized for qRT-PCR assays. Genes
were normalized against Gapdhand then the ratio of +Dox to -Dox determined, where values <1 were assigned their inverse to give a negative fold
D
E
V
E
LO
P
M
E
N
T
When D4 cells were induced with Dox at replating, we saw that although this late-stage induction had a modest, albeit significant, effect upon the number of EryP colonies generated, the colonies themselves were bigger when Dox was added to the EryP replating media (Fig. 6C). The average cellularity of a non-induced EryP colony was 46.3±10 cells per colony, whereas the induction of GATA2 at replating resulted in EryP colonies with an average 82.1±10.7 cells per colony. The expansion of the EryP colonies under enforced GATA2 expression led us to reason that EryP cells were cycling at a higher rate than control cells.
To further validate this notion, we examined cell proliferation using BrdU labeling. During EryP formation, cells were recovered from their replating media by cellulase treatment and grown in the presence of BrdU, with or without Dox. On average, the BrdU uptake in Dox-treated cells was more than twice the uptake in untreated EryP cells, indicating greater proliferation in the presence of exogenous GATA2 (Fig. 6D). In examining previous reports investigating GATA1 (Rylski et al., 2003; Pan et al., 2005) as well as our own array data, we discovered that a small subset of cell cycle genes are relevent to this phenomenon, including the tumor suppressor Rb(Rb1 – Mouse Genome Informatics), the cyclin complex components Cdk4and Ccnd2(Cyclin D2) and the CDK inhibitors (CDKIs) p16INK4a, p18INK4c, p19ARF, p21WAF1and p27KIP1. These genes show altered expression dependent upon the status of GATA1 (Rylski et al., 2003; Pan et al., 2005). Specifically, the induction of GATA1 results in the suppression of Cdk4and Ccnd2
and the activation of the CDKI family members as well as of Rb. To examine the gene expression of EryP cells upon GATA2 induction, EryP cells were harvested and utilized for qRT-PCR assays. The results showed that cells with enforced GATA2 had lower expression levels of the negative regulators Rband CDKI family members, and increased expression levels of Cdk4 and Ccnd2 (Fig. 6E). Importantly, this alteration was unlikely to be due to a change in
Gata1expression, as the enforced expression of GATA2 led to only
a minor suppression of Gata1 (Fig. 6E).
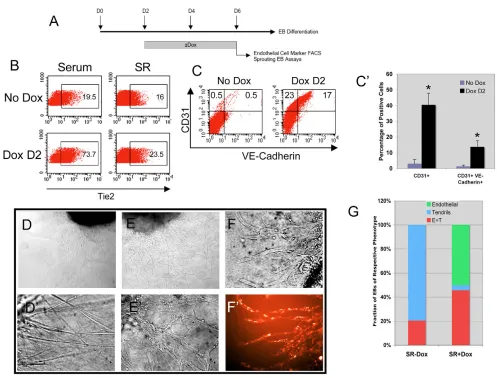
To examine the endothelial potential of iGATA2 ES cells, D2 EBs were induced and differentiated for four additional days and subjected to FACS analyses for endothelial cell surface markers. As shown in Fig. 7B, induction of GATA2 from D2 resulted in a dramatic increase in Tie2+cells. Additionally, GATA2 induction from D2 also led to an increase in the number of CD31+as well as of CD31+VE-Cadherin+cells, arguing for an increase in endothelial cells generated from D6 EBs (Fig. 7C,C⬘). In an effort to further validate an increase in generation of endothelial cells in the presence of GATA2, we modified the aortic ring assay (Nicosia and Ottinetti, 1990a; Nicosia and Ottinetti, 1990b) so as to use EBs in place of sections of adult aorta. D6 EBs grown in SR media with or without Dox from D2 were sandwiched in Matrigel and allowed to sprout for 6 days in the presence of VEGF. We observed a profound phenotypic variance in the nature of the sprouts that were generated based upon GATA2 status. In the absence of GATA2, EBs developed thin, tendril-like sprouting structures (Fig. 7D,D⬘,G), whereas EBs grown in the presence of Dox developed flat, heterogeneous-shaped cells that appeared to be endothelial cells (Fig. 7E,E⬘,G). We sought to verify the nature of these cells, and tested whether they could take up acetylated low-density lipoproteins, a characteristic of endothelial cells (Voyta et al., 1984). The sprouting cells generated from EBs grown in the presence of Dox were indeed able to take up the Dil-Ac-LDL (Fig. 7F,F⬘), whereas the tendril-like structures from EBs grown the absence of Dox were not Dil-Ac-LDL+(not shown). Collectively, these data argue that GATA2 regulates the generation of BL-CFC, hematopoietic and endothelial cells.
DISCUSSION
The gene expression profile of the hemangioblast The hemangioblast, through careful analyses, has been proven to be a single cell capable of giving rise to both hematopoietic and endothelial cells in culture (Choi et al., 1998; Nishikawa et al., 1998; Faloon et al., 2000; Chung et al., 2002; Ema et al., 2003; Huber et al., 2004). The present work sought to uncover a molecular signature of the hemangioblast and to define mechanisms that regulate hemangioblast development. The expression profile of the Flk-1+Scl+(hemangioblast) cells derived from D2.75 EB cells was most similar to the other stem cell populations, sharing with them the expression of a number of transcription factors as well as other genes with RNA- and DNA-binding functions. Additionally, the arrays identified a number of factors preferentially expressed in the hemangioblast. Certainly, genes that are common with other stem cells could be important for further determining whether a common pathway exists amongst different stem cell populations in maintaining ‘stem-ness’. Conversely, studying genes that are uniquely expressed in the hemangioblast cell population will be crucial for understanding how hematopoietic and vascular systems are established.
GATA2 and BMP4 in mesoderm differentiation The discovery of Gata2and characterization of its expression pattern (Minko et al., 2003), and the knockout phenotype of
Gata2–/–animals (Tsai et al., 1994), implicated Gata2as an ideal
candidate in molecular control of hemangioblast development and differentiation. A number of reports have implicated GATA factors as being downstream of BMP4 signaling, including Gata2
(Maeno et al., 1996; Friedle and Knochel, 2002) and Gata4 (Rojas et al., 2005). Here, we demonstrated that Gata2 was directly induced by BMP4 and that GATA2 activated Bmp4 expression. Although we discovered three conserved GATA-factor-binding sites in the Bmp4 locus (–1034, –392 and the TGE site), we showed that GATA2 occupies the TGE site more abundantly than either the –1034 or –392 sites. Previous work showed that GATA4 and GATA6 utilized the –392 GATA site and a non-canonical site
at –526 to transactivate the Bmp4 promoter during
cardiomyogenesis (Nemer and Nemer, 2003). Given the importance of BMP4 in mesodermal differentiation (Winnier et al., 1995), as well as the importance of the GATA factors in development, there may be differential control of Bmp4in early hematopoietic/endothelial tissues as compared with cardiomyocytes, and these differences may presumably account for different mechanisms conferred by GATA2 or GATA4/6, respectively. Specifically, our studies suggest that GATA2 occupies the TGE site of Bmp4and that BMP4 signals in turn activate Gata2 transcription, creating an autoregulatory mesodermal differentiation loop during early development. By contrast, the –392 (or –526) sites may be bound by GATA4/6 during later time points of cardiomyogenesis (Nemer and Nemer, 2003). Future experiments examining the in vivo occupancy of
Bmp4in different tissues, as well as loss-of-function studies with candidate trans-acting factors, will be required to discern the tissue-specific control of Bmp4during development.
Our studies indicate that cardiogenic genes including Hand2and
Nkx2-5were induced upon enforced GATA2 expression. Moreover,
Flk-D
E
V
E
LO
P
M
E
N
T
1+cells has recently been reported (Wang et al., 2006). Whether the augmentation of cardiogenic genes in iGATA2 cells is the result of direct trans-activation carried out by GATA2, or is a response to BMP4 signaling, is unclear and needs to be examined in the future.
GATA2 and Scl induction, hemangioblast specification and erythroid progenitors
The hemangioblast has long been considered to be transient. By enforcing GATA2 expression at different time points in differentiating ES cells, we demonstrate that the hemangioblast is indeed transient. Specifically, our Blast colony replating data demonstrated that if GATA2 is induced from day 2 and replated at D2.75 or D3, a decrease in Blast colony number is observed. This coincided with a precocious emergence of the hemangioblast’s progeny, i.e. erythroid colonies or endothelial cells, at D2.75.
[image:11.612.56.553.55.433.2]Consistently, when GATA2 was induced in situ upon Blast colony replating, there was a great increase in Blast colony formation. Intriguingly, our data show that under continued exogenous GATA2 expression, the Dox/Dox treatment scheme results in enhanced BL-CFC generation at early replating time points (D2.25, D2.5), but later replating (D2.75, D3) results in a similar number of BL-CFCs as in non-induced cells. We attribute this to the asynchronous differentiation of ES cells in the EB differentiation protocol. Specifically, BL-CFCs can be detected as early as D2.25, peak at D2.75, but are still present at D3 (blue bars in Fig. 5C). When GATA2 was induced from D2 and replated at D2.25, the BL-CFC generation was not affected (compare blue bar with yellow bar for D2.25 replating in Fig. 5C). Thus, the Dox/Dox scheme for D2.25 replating should generate similar effects as the No Dox/Dox scheme. When GATA2 was induced from D2 and cells replated at D2.75, the Fig. 7. Augmented endothelial generation by GATA2.(A) GATA2 induction scheme in differentiating EBs and formation of endothelial cells.
Uppermost numbers indicate EB day. Gray bar indicates duration of Dox treatment and subsequent analyses of D6 EBs. (B) Generation of Tie2+
endothelial cells by GATA2 expression in serum and SR conditions. Numbers in boxes indicate percentage of Tie2+cells. (C) Generation of CD31+
and CD31+VE-Cadherin+endothelial cells in SR media. Numbers in upper left and right quadrants indicate percentage of CD31+and CD31+
VE-Cadherin+cells, respectively. (C⬘) Quantification of CD31+and CD31+VE-Cadherin+cells generated with or without Dox. Values are mean±s.e.m.
from four independent experiments; *, P<0.001 versus untreated. (D-E⬘) Representative sprouting EB images. D and E show 100⫻magnification of
brightfield images of EBs generated in the absence (D) and presence (E) of Dox; D⬘and E⬘are 800⫻magnifications of D and E, respectively,
showing the tendril-like (D⬘) and endothelial (E⬘) cells generated in the two conditions. (F,F⬘) Brightfield (F) and fluorescence (F⬘) images of 800⫻
magnification of sprouting iGATA2 EBs demonstrating uptake of DiL-Ac-LDL by endothelial cells. (G) Fractional quantification of types of sprouting
D
E
V
E
LO
P
M
E
N
T
BL-CFC number was greatly decreased. However, it should be noted that within D2.75 EBs, some cells are still en route to becoming BL-CFCs (compare blue bar and red bar at D3 replating in Fig. 5C). Thus, we should still detect an increase in Blast colony number in the Dox/Dox scheme as compared with Dox/No Dox treatment for later time point replating, i.e. D2.75 and D3. Based on our previous study which showed that Flk-1+Scl+ cells are enriched for hemangioblasts (Chung et al., 2002), and on the current study which showed that GATA2 mediates Scl expression, we propose that GATA2 expression confers rapid differentiation of Flk-1+mesoderm through Flk-1+Scl+ hemangioblasts into hematopoietic or endothelial cells by modulating Scl.
We have previously shown that BMP4 alone could generate a modest level of Scl+cells and that synergistic signaling by BMP4 and VEGF robustly generated Scl+cells (Park et al., 2004). Here, we have demonstrated that activation of GATA2 robustly yields Scl+ cells. Importantly, activation of GATA2 did not augment Vegf
expression, arguing that this effect was independent of VEGF signaling. Given the importance of Sclduring development as well as in leukemogenesis, efforts have been invested into trying to elucidate the mechanism whereby Sclis regulated (Aplan et al., 1992; Bockamp et al., 1997; Gottgens et al., 1997; Gottgens et al., 2002; Gottgens et al., 2004). Here, we have shown in vivo occupancy of the Scllocus by GATA2 and then GATA1 in a system that recapitulates developing embryos. Only the conserved GATA site in the promoter region of Scl was occupied by GATA2 or GATA1 in developing EBs. In our ES/EB model, we did not see either GATA factor occupying the +19 enhancer site previously posited to confer hematopoietic specificity to Sclexpression in leukemic cells (Gottgens et al., 2002; Gottgens et al., 2004). We argue that during embryogenesis, the +19 enhancer is not occupied, and whether the GATA occupancy of this enhancer is cell-type-dependent should be determined in the future. Our data demonstrate that Scl regulation by GATA2 and GATA1 during ES/EB development is distinctive, such that at the hemangioblast stage Scl
is regulated by GATA2, whereas at the erythroid stage GATA1 displaces GATA2 to become the dominant GATA factor to sustain
Scl expression. This dynamic occupancy mimics that seen at the
Gata2locus during erythroid differentiation (Grass et al., 2003;
Martowicz et al., 2005). Appreciation of such developmental control of Sclby different GATA factors should be crucial for further elucidating Sclregulation in hematopoietic development.
We have demonstrated that GATA2 can function independently within the primitive erythroid progenitor when induced from D3 and beyond. This induction of GATA2 within primitive erythroid progenitors increases the number of EryP cells and the size of EryP colonies. Through BrdU-uptake assays and examination of cell cycle genes we established that GATA2 confers a proliferative signal to EryP progenitor cells. The absence of Gata2during embryogenesis leads to embryonic lethality due to a unique anemia wherein all fetal hematopoietic organs develop properly yet are entirely barren of hematopoietic cells (Tsai et al., 1994). A subsequent study, examining the role that GATA2 plays in the proliferation of primitive hematopoietic cells, showed that a loss of the tumor suppressor p53
was capable of partially rescuing the defect associated with Gata2–/–
cells (Tsai and Orkin, 1997). Other studies of GATA2 have revealed that GATA2 may have discrete functions in different tissues. Intriguingly, during neural development, GATA2 has been shown to negatively regulate the cell cycle, allowing for neural differentiation at the expense of proliferation (El Wakil et al., 2006). Additionally, when GATA2 is induced at later stages of hematopoietic differentiation in the ES-EB system, it is capable of redirecting
macrophages into other hematopoietic cells (Kitajima et al., 2006). Collectively, GATA2 may have broader, cell-type-dependent roles in development and differentiation.
We thank Stuart Orkin (Children’s Hospital, Boston) for the kind gift of the J1
and Gata2–/–ES cells; William Eades and Jacqueline Hughes of the Siteman
Cancer Center High Speed Sorter Core Facility for performing cell-sorting; Jikun Zha for assistance with BrdU labeling analyses; and members of the K.C. lab for help with FACS analyses and critical discussions. The Siteman Cancer Center is supported in part by NCI Cancer Center Support Grant # P30 CA91842. This work was supported by grants from the National Institutes of Health, NHLBI, HL63736 and HL55337 to K.C., and by a predoctoral grant from the American Heart Association to J.J.L. J.J.L. is a fellow of the Lucille P. Markey Pathway in Human Pathobiology.
References
Aplan, P. D., Nakahara, K., Orkin, S. H. and Kirsch, I. R.(1992). The SCL gene
product: a positive regulator of erythroid differentiation. EMBO J. 11, 4073-4081.
Bockamp, E. O., McLaughlin, F., Gottgens, B., Murrell, A. M., Elefanty, A. G.
and Green, A. R.(1997). Distinct mechanisms direct SCL/tal-1 expression in
erythroid cells and CD34 positive primitive myeloid cells. J. Biol. Chem. 272, 8781-8790.
Bresnick, E. H., Martowicz, M. L., Pal, S. and Johnson, K. D.(2005).
Developmental control via GATA factor interplay at chromatin domains.J. Cell.
Physiol. 205, 1-9.
Choi, K., Kennedy, M., Kazarov, A., Papadimitriou, J. C. and Keller, G.(1998).
A common precursor for hematopoietic and endothelial cells. Development 125, 725-732.
Chung, Y. S., Zhang, W. J., Arentson, E., Kingsley, P. D., Palis, J. and Choi, K.
(2002). Lineage analysis of the hemangioblast as defined by FLK1 and SCL expression. Development 129, 5511-5520.
Doherty, J. M., Carmichael, L. K. and Mills, J. C.(2006). GOurmet: a tool for
quantitative comparison and visualization of gene expression profiles based on gene ontology (GO) distributions. BMC Bioinformatics 7, 151.
El Wakil, A., Francius, C., Wolff, A., Pleau-Varet, J. and Nardelli, J.(2006). The
GATA2 transcription factor negatively regulates the proliferation of neuronal progenitors. Development 133, 2155-2165.
Ema, M., Faloon, P., Zhang, W. J., Hirashima, M., Reid, T., Stanford, W. L.,
Orkin, S., Choi, K. and Rossant, J.(2003). Combinatorial effects of Flk1 and
Tal1 on vascular and hematopoietic development in the mouse. Genes Dev. 17, 380-393.
Faloon, P., Arentson, E., Kazarov, A., Deng, C. X., Porcher, C., Orkin, S. and
Choi, K.(2000). Basic fibroblast growth factor positively regulates
hematopoietic development. Development 127, 1931-1941.
Frazer, K. A., Pachter, L., Poliakov, A., Rubin, E. M. and Dubchak, I.(2004).
VISTA: computational tools for comparative genomics. Nucleic Acids Res. 32, W273-W279.
Friedle, H. and Knochel, W.(2002). Cooperative interaction of Xvent-2 and
GATA-2 in the activation of the ventral homeobox gene Xvent-1B. J. Biol. Chem.
277, 23872-23881.
Gottgens, B., McLaughlin, F., Bockamp, E. O., Fordham, J. L., Begley, C. G.,
Kosmopoulos, K., Elefanty, A. G. and Green, A. R.(1997). Transcription of
the SCL gene in erythroid and CD34 positive primitive myeloid cells is controlled by a complex network of lineage-restricted chromatin-dependent and chromatin-independent regulatory elements. Oncogene 15, 2419-2428.
Gottgens, B., Nastos, A., Kinston, S., Piltz, S., Delabesse, E. C., Stanley, M.,
Sanchez, M. J., Ciau-Uitz, A., Patient, R. and Green, A. R.(2002).
Establishing the transcriptional programme for blood: the SCL stem cell enhancer is regulated by a multiprotein complex containing Ets and GATA factors. EMBO J. 21, 3039-3050.
Gottgens, B., Broccardo, C., Sanchez, M. J., Deveaux, S., Murphy, G., Gothert, J. R., Kotsopoulou, E., Kinston, S., Delaney, L., Piltz, S. et al.
(2004). The scl +18/19 stem cell enhancer is not required for hematopoiesis: identification of a 5⬘bifunctional hematopoietic-endothelial enhancer bound by Fli-1 and Elf-1. Mol. Cell. Biol. 24, 1870-1883.
Grass, J. A., Boyer, M. E., Pal, S., Wu, J., Weiss, M. J. and Bresnick, E. H.
(2003). GATA-1-dependent transcriptional repression of GATA-2 via disruption of positive autoregulation and domain-wide chromatin remodeling. Proc. Natl.
Acad. Sci. USA 100, 8811-8816.
Huber, T. L., Kouskoff, V., Fehling, H. J., Palis, J. and Keller, G.(2004).
Haemangioblast commitment is initiated in the primitive streak of the mouse embryo. Nature 432, 625-630.
Iida, M., Heike, T., Yoshimoto, M., Baba, S., Doi, H. and Nakahata, T.(2005).
Identification of cardiac stem cells with FLK1, CD31, and VE-cadherin expression during embryonic stem cell differentiation. FASEB J. 19, 371-378.