AN EMPIRICAL INVESTIGATION ON THE FACTORS THAT
INFLUENCE THE USE OF AUDIENCE RESPONSE SYSTEM
MANTIKAYAN JONATHAN1, ABDULLAH LILI1, AYU MEDIA2, ADAMU ABUBAKAR1, ABDULGANI MONTADZAH1
1
Department of Information Systems, International Islamic University Malaysia, Kuala Lumpur, Malaysia 2Universitas Siswa Bangsa International, Jl. MT Haryono Kav 58-60, Jakarta Selatan 12780
E-mail: [email protected]
ABSTRACT
Majority of the earlier studies regarding the use of audience response systems have been devoted to higher educational level, with less attention given to secondary or high school level, and there is a dearth of research done on secondary education. To address the gap in the research literature, a study using quantitative survey has been used to explore and document the secondary students’ result outcomes on using the Audience Response System (ARS) vis-à-vis the traditional method, and to further explore if utilizing an ARS affects student performance outcome. In the end, the research examines the impact of ARS on student active learning, performance outcome and the task-technology fit of ARS in secondary level education. The major finding from this study shows that ARS add to a pre-existing active learning in secondary level education as well as the student’s performance. Above all, the task-technology fit affects the implementation of this system as regards the learning style of secondary school level.
Keywords: Audience Response System, Active learning, Performances Outcomes Task, Technology-fit
1. INTRODUCTION
Studies by other researchers on ARS indicate that it is not adequate to conduct ARS for its own sake and use it without an organized structure, citing that technology is only secondary while effective teaching is of paramount consideration [1]. As the ARS is simply a tool for improving interactivity in teaching methodology, the core of ARS is geared towards active teaching rather than technology, lest ARS will lead into a passive engagement between teacher and student. Judson and Sawada [2] emphasize thus: ‘Interactivity means far more than a lecture hall full of students pressing buttons in response to questions. A highly interactive classroom implies students are interacting with several ideas and several individuals all at once” (p.36). Martyn [3] and Rodriguez [1] suggest that an ideal situation in understanding ARS is to provide students various opportunities to practice with ARS in low-key activities and opinion-based surveys to evaluate student understanding or conduct assessments, before they are used for more advanced questions.
Since ARS fit requires the necessary training to use the system, it is considered that training and preparation for ARS are important in order to use the technology productively.
The use of the ARS as information tool is considered critical in this research. As a result this
research attempts to explore its effect on secondary school students since previous researches concentrate more on higher institution of learning. The study uses quantitative survey research approach and obtained its reliable sample respondents from Malaysia and Philippines. However, the multicultural nature of the respondents (Malaysians and Filipinos) and the identical survey questions handed to the respondents may impact on their pedagogical approaches, and may become biased in favor of one nationality over the other. As it is, the format of the questionnaire and the questions themselves do not pose any culture mismatch as the questions merely state the objective set-up of individual opinions on such factors as reactions on the use of ARS which do not present a challenge on cultural sensitivities.
and the responses are distributed so as to show that students can compare their own understanding with others.
2. IMPACT OF AUDIENCE RESPONSE SYSTEM IN SECONDARY SCHOOL
The study extracted three major constructs to examine the impact of ARS in secondary school level from [6-8]. These constructs are: active learning, performance outcome and fit. A quantitative evaluation based on survey approach
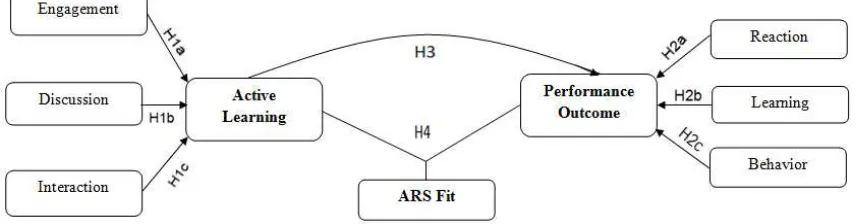
[image:2.612.93.523.233.345.2]has been carried out. The evaluation is designed in order to gain statistical valid quantitative results. It is a hypothesis-testing evaluation with the aim of generalizing the outcomes to the general population on active learning, performance outcome and fit of ARS technology in the classroom. This research formulates hypothesis and proposes to test a model deemed to be suitable for understanding the state of ARS in secondary school. Figure 1, shows the propose hypothesized model.
Figure 1. The Hypothesized Model
The following hypotheses are tested:
H1a: ARS is associated with engagement as a form of active learning in the classroom.
H1b: ARS is associated with discussion as a form of active learning in the classroom.
H1c: ARS is associated with interaction as a form of active learning in the classroom.
H2a: ARS has a positive effect on student reaction outcome in the classroom.
H2b: ARS has a positive effect on student learning outcome in the classroom.
H2c: ARS has a positive effect on student behavior outcome in the classroom.
H3: There is a significant effect of active learning on performance outcome in the classroom. H4: ARS Fit has an impact on active learning and performance outcome in classroom.
2.1 Data Collection
The data collection strategies used in this study lie within the following: the target population, sampling and instrumentation.
2.1.2 Population
This study targets the entire population of the secondary schools in Malaysia and the Philippines. There are many private and public secondary schools in both Malaysia and the Philippines. In Malaysia, there is a total of 2,452 of both private
and public secondary schools (UNESCO, 2011) [9], whereas in the Philippines, there is a total of 8,532 private and public secondary schools (UNESCO, 2009) [10]. Unfortunately very few, if not all, were found to be implementing the ARS in teaching despite a huge potential of success the system provides.
2.1.2 Sampling
the population size is almost irrelevant and a sample size of 400 will be adequate [12]. However, considering a given confidence level, the larger the sample size, the smaller the confidence interval. That is, the relationship is not linear, doubling the sample size does not give half the confidence interval [13]. In this study only the treatment group was asked in the survey because they utilize ARS in their classroom. As a result a sample of 1,000 responses was projected.
2.1.3 Instrumentation
The instrumentation used in this research is based on questionnaires. The survey questionnaires were adopted from previous study and modified to suit the level of student in secondary environment. The outlines of the questionnaire are of Likert scale type with seven (7) response ranges. Respondents were required to evaluate agreement to the statements from the questions starting with (1) Strongly disagree, (2) Disagree, (3) Slightly disagree, (4) Neutral, (5) Slightly agree, (6) Agree and (7) Strongly agree. The adoption of the seven Likert scale measure of the respondents’ responses comes from the fact that it gives room to a wider scope and range of respondents’ responses which significantly affect the data analysis [14]. The validation of the questionnaires was undertaken through pilot study from a single institution. The validation of questionnaires allowed the research to identify ambiguity in the wording of items and identify new items that needed to be added. The feedbacks obtained are consequently included in the revised questionnaire. About 1,550 survey questionnaires were put out for distribution to collect data through self-administered techniques.
2.2 Responses and profile of the respondent
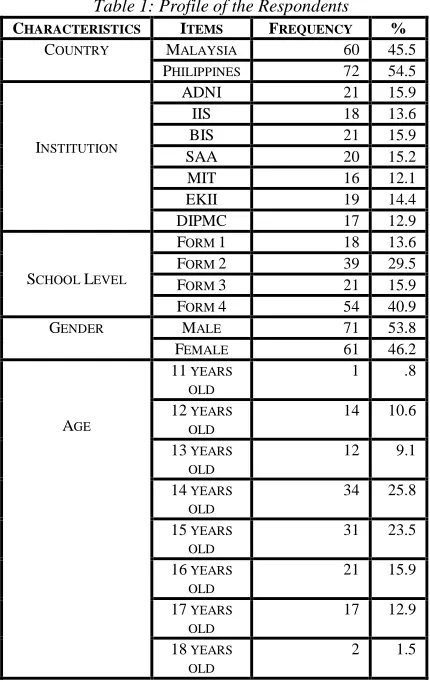
The survey responses rate is presented in Table 1. The estimated numbers of population intended for the survey are within the range of 1,000 to 1,550 randomly in and around Selangor Malaysia and Mindanao, Philippines. This is because the survey is focused to extract data from 5 secondary learning institutions in Malaysia as well as 5 secondary schools in the Philippines. As a result, 1,550 questionnaires were prepared for distribution; out of these a total of 575 respondents returned their answered questionnaires within 7 months. The researcher only managed to get three learning institution in Malaysia and four schools in the Philippines.
The usable responses from the 575 returned questionnaires were 132; the non-usable responses resulted from double ticking a single question, not answering of more than sixty percent of the
[image:3.612.307.522.165.506.2]questions, and answering of only a single option throughout the questionnaires. The demographic information of the respondents in the survey is given in Table 1. Out of 132 respondents, about 46% were female and 54% were male.
Table 1: Profile of the Respondents CHARACTERISTICS ITEMS FREQUENCY %
COUNTRY MALAYSIA 60 45.5
PHILIPPINES 72 54.5
INSTITUTION
ADNI 21 15.9
IIS 18 13.6
BIS 21 15.9
SAA 20 15.2
MIT 16 12.1
EKII 19 14.4
DIPMC 17 12.9
SCHOOL LEVEL
FORM 1 18 13.6
FORM 2 39 29.5
FORM 3 21 15.9
FORM 4 54 40.9
GENDER MALE 71 53.8
FEMALE 61 46.2
AGE
11 YEARS OLD
1 .8
12 YEARS OLD
14 10.6
13 YEARS OLD
12 9.1
14 YEARS OLD
34 25.8
15 YEARS OLD
31 23.5
16 YEARS OLD
21 15.9
17 YEARS OLD
17 12.9
18 YEARS OLD
2 1.5
2.2.2 Analysis of factors influencing the use of ARS for engagement, discussion and interaction
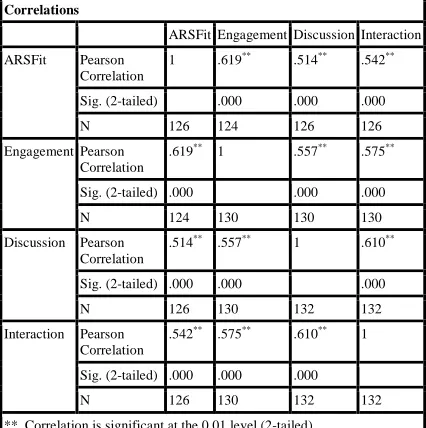
This concept is described as a summated scale, where several items are combined to measure a single variable in an attempt to increase the reliability of the measurement [15]. The results of the correlation among the variables are presented in Table 2.
Table 2: Correlation Analysis Among The Factors Influencing The Use Of Audience Response System For
Engagement, Discussion And Interaction
Correlations
ARSFit Engagement Discussion Interaction
ARSFit Pearson Correlation
1 .619** .514** .542**
Sig. (2-tailed) .000 .000 .000
N 126 124 126 126
Engagement Pearson Correlation
.619** 1 .557** .575**
Sig. (2-tailed) .000 .000 .000
N 124 130 130 130
Discussion Pearson Correlation
.514** .557** 1 .610**
Sig. (2-tailed) .000 .000 .000
N 126 130 132 132
Interaction Pearson Correlation
.542** .575** .610** 1
Sig. (2-tailed) .000 .000 .000
N 126 130 132 132
**. Correlation is significant at the 0.01 level (2-tailed).
The values of the Pearson’s correlation coefficient (r) range from r = .514 to .619. The highest correlation coefficient was obtained from the relationship between ARS Fit and Engagement which shows that there is significant strong positive correlation relationship between them. However, there is also a relationship between ARS fit, Discussion and Interaction. In order get in-depth in the analysis, standard multiple regression analysis (Table 3) was conducted to evaluate how well a set of predictors predicted the use of ARS for active learning in the classroom. The predictors were engagement, discussion and interaction as a form of active learning in the computer studies class. The linear combination of engagement, discussion and interaction was significantly related to ARS Fit for active learning. F(3,120) = 33.797, p=.000 at .05 alpha level.
Given an R-squared of 45.8%, this only means that there is a probability of 45.8% that the results can be predicted from the Regression analysis. Engagement, discussion and interaction are factors that are contributing significantly to the dependent variable.
Table 3.Standard Multiple Regression Analysis Of The Active Learning Variables
Model Summary
Model R
R Square
Adjusted R Square
Std. Error of the Estimate
1 .677a .458 .444 5.57363
a. Predictors: (Constant), Interaction, Engagement, Discussion
The sample multiple correlation coefficients is .677 indicating that approximately 46% of the variance in ARS Fit in the classroom for active learning can be explained by a set of predictors (Engagement, Discussion and Interaction). The descriptive statistics and Pearson correlation between each is presented in Table 2.
Based on coefficient result, two of the independent variables are making statistically significant contribution to the prediction on ARS Fit in the classroom for active learning. Engagement (Beta = .40, p = .001 at .05 alpha level) makes the strongest contribution to the ARS Fit for active learning. The next is Interaction (Beta = .23, p = .01 at .05 alpha level) and Discussion (Beta = .16, p = .07 at .05 alpha level) which is not statistically significant as predictor for ARS Fit in the classroom for active learning.
The tolerance is the percentage of the variance in a given predictor that cannot be explained by the other predictors. Thus, the small tolerances show that 70%-90% of the variance in a given predictor can be explained by the other predictors. When the tolerances are close to 0, there is high multicollinearity and the standard error of the regression coefficients will be inflated. A variance inflation factor greater than 2 is usually considered problematic, thus the largest tolerance in this case is .60 while the highest (Variance Inflation Factor (VIF) in the table is 1.8. Therefore the multiple regression result suggests that the Audience Response System Fit in the computer studies classroom in secondary learning environment influences active learning. Thus the result of correlation and regression analysis (see Table 2 and Table 3) supports the following hypothesized relationships (H1a, H1b and H1c):
i. (H1a) ARS is associated with engagement as a form of active learning in the classroom.
iii. (H1c) ARS is associated with interaction as a form of active learning in the classroom.
These findings lend support that ARS can trigger engagement and interaction as a form of active learning in the classroom.
2.2.3 Analysis of factors influencing the use of ARS for performance outcome
Correlation analysis and regression analysis were used to answer the question two “What are the performance outcomes of utilizing ARS in secondary level education?” The Independent variables are; performance outcome (reaction, learning and behavior). The dependent variable is ARS Fit (Task-technology Fit). The numbers of survey items measuring these variables are 11 and 9 respectively. In order to measure the relationship among them, the averages of the items on each variable were computed. Thus this is the same items that were ensured to fit for measuring those variables during factor analysis and reliability test..
Table 4: Correlation Analysis Among The Factors Influencing The Use Of Audience Response System For
Reaction, Learning Behavior. Correlations
ARSFit Reaction Learning Behavior
ARSFit Pearson
Correlation
1 .633** .601** .461**
Sig.
(2-tailed)
.000 .000 .000
N 126 124 116 124
Reaction Pearson Correlation
.633** 1 .744** .366**
Sig.
(2-tailed)
.000 .000 .000
N 124 130 122 130
Learning Pearson Correlation
.601** .744** 1 .512**
Sig.
(2-tailed)
.000 .000 .000
N 116 122 122 122
Behavior Pearson Correlation
.461** .366** .512** 1
Sig.
(2-tailed)
.000 .000 .000
N 124 130 122 130
**. Correlation is significant at the 0.01 level (2-tailed).
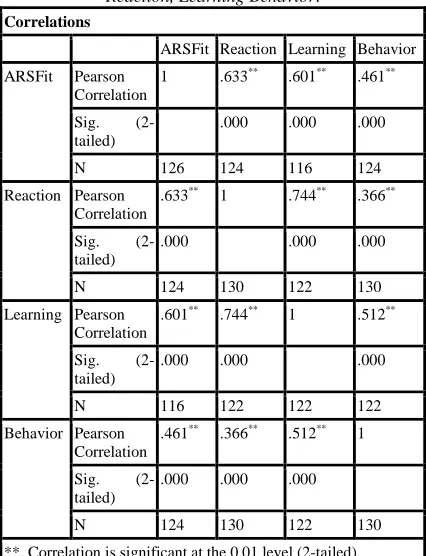
This concept is described as a summated scale, where several items are combined to measure a single variable in an attempt to increase the
reliability of the measurement [15]. The results of the correlation among the variables are presented in Table 4.
[image:5.612.88.301.398.676.2]The values of the Pearson’s correlation coefficient (r) range from r = .366 to .744. The highest correlation coefficient was obtained from the relationship between reaction and learning which shows that there is significant strong positive correlation relationship between them. However, there is also relationship between ARS fit, reaction, learning and behavior. In order get in-depth in the analysis, standard multiple regression analysis (Table 5) was conducted to evaluate how well a set of predictors predicted the impact of ARS performance outcome in the classroom. The predictors were reaction, learning and behavior. The linear combination of reaction, learning and behavior was significantly related to ARS Fit. F(3,112) = 34.791, p=.001 at .05 alpha level. Given an R-squared of 48.2%, this only means that there is a probability of 48.2% that the results can be predicted from the Regression analysis equation. Behavior and Reaction are the factors that are significantly affecting the dependent variable.
Table 5: Standard Multiple Regression Analysis Of The Performance Outcome Variables
Model Summary
Model R
R Square
Adjusted R Square
Std. Error of the Estimate
1 .695a .482 .469 5.30590
a. Predictors: (Constant), Behavior, Reaction, Learning
The sample multiple correlation coefficients is .695 indicating that approximately 47% of the variance in ARS Fit in the classroom for performance outcome can be explained by a set of predictors (reaction, learning and behavior). The descriptive statistics and Pearson correlation between each is presented in Table 4.
Fit in the computer studies classroom in secondary learning environment influences performance outcome. Thus the result of correlation and regression analysis supports the hypothesis (H2a, H2b and H2c):
i. (H2a) ARS has a positive effect on student reaction outcome in the classroom. ii. (H2b) ARS has a positive effect on student
learning outcome in the classroom. iii. (H2c) ARS has a positive effect on student
behavior outcome in the classroom.
These findings support that ARS Fit has positive significant effect on reaction, learning and behavior outcome in the classroom.
2.2.4 Analysis of impact of active learning on performance outcome
Correlation analysis and regression analysis were used to answer the question three “What is the impact of active learning on performance outcome in secondary learning environment?” The Independent variables is active learning while performance outcome is dependent variable.
The numbers of survey items measuring these variables are 10 and 11 respectively. In order to measure the relationship among them, the averages of the items on each variable were computed. This concept is described as a summated scale as mentioned before, where several items are combined to measure a single variable in an attempt to increase the reliability of the measurement [15] The results of the correlation among the variables are presented in Table 6.
Table 6: Correlation Analysis Between Active Learning and Performance Outcome.
Correlations
ActiveLearning Outcome
ActiveLearning Pearson Correlation
1 .659**
Sig. (2-tailed) .000
N 130 120
Outcome Pearson
Correlation
.659** 1
Sig. (2-tailed) .000
N 120 122
**. Correlation is significant at the 0.01 level (2-tailed).
The value of the Pearson’s correlation coefficient (r) is both .659. In order to get in-depth in the analysis, standard multiple regression analysis (Table 7) was conducted to evaluate how
well a set of predictors predicted the impact of active learning on performance outcome in the classroom. The predictor is performance outcome. The linear combination of active learning was significantly related to performance outcome F(1,118) = 90.432, p=.000 at .05 alpha level. Given an R-squared of 43.4%, this only means that there is a probability of 43.4% that the results can be predicted from the Regression analysis equation. Active learning is a factor that is significantly affecting the dependent variable performance outcome.
Table 7: Standard Multiple Regression Analysis of Active Learning and Performance Outcome Variables
Model Summary
Model R
R Square
Adjusted R Square
Std. Error of the Estimate
1 .659a .434 .429 6.49803
a. Predictors: (Constant), Active Learning
The sample multiple correlation coefficients is .659 indicating that approximately 43% of the variance in active learning in the classroom can be explained by a predictor performance outcome. The Pearson correlation between each is presented in Table 6. Based on coefficient result, the independent variables are making statistically significant contribution to the prediction on performance outcome in the classroom. Active learning (Beta = .66, p = .000 at .05 alpha level). Thus, the multiple regression result suggests that active learning influences performance outcome. Furthermore, the result of correlation and regression analysis (see Table 6 and Table 7) supports the hypothesis 3 (H3):
H3: There is a significant effect of active learning on performance outcome in the classroom.
These findings support that active learning has positive significant effect on performance outcome in the classroom.
2.2.5 Analysis of impact of ARS on active learning and performance outcome
dependent variable is ARS Fit (Task-technology Fit). The numbers of survey items measuring these variables are 11, 10 and 9, respectively. In order to measure the relationship among them, the averages of the items on each variable were computed. The results of the correlation among the variables are presented in Table 8.
Table 8: Correlation Analysis Among The Factors
Influencing The Use Of Audience Response System.
Correlations
ARSFit ActiveLearning Outcome
ARSFit Pearson
Correlation
1 .677** .693**
Sig.
(2-tailed)
.000 .000
N 126 124 116
ActiveLearning Pearson Correlation
.677** 1 .659**
Sig.
(2-tailed)
.000 .000
N 124 130 120
Outcome Pearson
Correlation
.693** .659** 1
Sig.
(2-tailed)
.000 .000
N 116 120 122
**. Correlation is significant at the 0.01 level (2-tailed).
[image:7.612.89.300.209.418.2]The values of the Pearson’s correlation coefficient (r) range from r = .659 to .693. The highest correlation coefficient was obtained from the relationship between ARS Fit and Outcome which shows that there is significant strong positive correlation relationship between them. However, there is also a relationship between ARS fit and active learning. In order get in-depth in the analysis, standard multiple regression analysis (Table 9) was conducted to evaluate how well a set of predictors predicted the impact of ARS Fit on active learning and performance outcome in the classroom. The predictors were active learning and outcome. The linear combination of active learning and outcome was significantly related to ARS Fit. F(2,111) = 74.171, p=.000 at .05 alpha level. Given an R-squared of 57.2%, this only means that there is a probability of 57.2% that the results can be predicted from the Regression analysis equation. Active learning and outcome are the factors that are significantly affecting the dependent variable ARS Fit.
Table 9: Standard Multiple Regression Analysis Of The Active Learning And Performance Outcome Variables Model Summary
Model R R Square
Adjusted R
Square
Std. Error of the Estimate
1 .756a .572 .564 4.81468
a. Predictors: (Constant), Outcome, ActiveLearning
The sample multiple correlation coefficients is .756 indicating that approximately 56% of the variance in ARS Fit in the classroom can be explained by a set of predictors (active learning and performance outcome). The Pearson correlation between each is presented in Table 8.
Based on coefficient results, the two independent variables are making statistically significant contribution on the prediction on ARS Fit in the classroom. Active Learning (Beta = .38, p = .001 at .05 alpha level) and performance outcome (Beta = .45, p = .001 at .05 alpha level). Therefore, the multiple regression result suggests that the Audience Response System Fit in the computer studies classroom in secondary learning environment influences both active learning and performance outcome.
These findings support that ARS Fit has positive significant effect on active learning and performance outcome in the classroom.
3. DISCUSSION
The focus of this research has been to fulfill the following objectives: (i) To explore the effects of audience response system on active learning. (ii) To investigate the impact of audience response system on students’ performance outcome. (iii) To determine the impacts of active learning on performance outcome. (iv) To examine the relationship of ARS Fit into active learning and performance outcome in secondary learning environment.
Based on the findings of this research study, it can be argued that the use of Audience Response System can enable the students to actively engage, discuss and interact with the teacher and fellow students to attain useful reaction, learning and behavior that improve their knowledge as individuals and as a member of a classroom community [16-18]. In this study, suggestions and recommendations on ARS usage have been provided as useful tool for future student, teacher and researchers on the subject.
provide an answer to the issues and difficulties faced by schools that are trying to create a learning atmosphere which engages the students to participate and become active members of the learning community.
The research illuminates our understanding of the nature of the active learning, performance outcome and the fit of the audience response system to deliver the desired results as well as the interrelationship of these factors in cultivating knowledge in the classroom. Moreover, the research provides the rationale to motivate teachers and schools to design and implement ARS-supported lectures to enhance student’s learning and improve the quality of teaching especially in secondary schools in Malaysia and the Philippines. In light of the limitations of the study, more research is called upon to explore and develop innovative instructional use of ARS that engage the students to collaboratively improve their learning in knowledge building environments.
The findings from the present study showed that the effectiveness of using ARS to support active learning and knowledge building in classroom setting is dependent upon how the teacher or school administration utilizes and manages the system, ranging from the kind of inquiry that is directed to the students to the methods that ARS are used to shape discussions and structure the classroom activities. In this study, the researcher offers recommendations on the feasible methods to improve the use of ARS as viewed from the perspectives of students and teachers. However, security is one of the major successes of implementation; therefore the issue of pattern of safety analysis should be investigated using an approach like that found in [19-20].
4. CONCLUSION
This research conducts a quantitative survey to investigate the factors influencing the use of Audience Response System in secondary schools. It was discovered that active engagement, discussion and interaction drive positive performance outcome. A well-organized discussion can promote student learning by motivating and encouraging students to have a deeper exchange and a more robust dialogue about each other’s unique ideas, opinions, and values. Consistent with our research finding on performance outcome and active learning, Thomas and Orthober [21] state that interaction among group members, with different skills, ideas and talents, functions as a type of peer amplifier that provides various outlets, resources and aid to advance the individual’s and group’s
learning. As indicated in the questionnaire, productive discussions can be linked with ARS as the former promote the advancement of common knowledge and could be further enhanced with the use of ARS as administered by the teacher.
By offering more opportunities to work on different ideas through the method of questioning and discussion, the level of students’ engagement, interaction with peer and student-instructor interaction could be further improved. By integrating more discussion with ARS use, students can consider themselves a part of a greater community where members work in collaboration to further their knowledge. Findings from this study further reinforce the idea that the greater the interaction, discussion and engagement of the students within the classroom, the higher they impact the level of performance outcome.
REFRENCES:
[1] L., Rodriguez. Adult English Language Learners’ Perceptions of Audience Response Systems (Clickers) as Communication Aides. 2010 (doctoral dissertation). Walden
University Retrieved from
http://gradworks.umi.com/3419769.pdf
[2] E. Judson, & Sawada, D. Audience response systems: insipid contrivances or inspiring tools? in Banks, D.A. (ed.) Audience Response Systems in Higher Education: Applications and Cases. Hershey, PA & London: 2006, Information Science Publishing, 26-39. [3] M. Martyn. Clickers in the classroom: An
active learning approach. EDUCAUSE Quarterly, 2007, Retrieved from: ttp://net.educause.edu/ir/library/pdf/EQM0729. pdf, 2, 71-74.
[4] J. E. Caldwell. Clickers in the large classroom: Current research and best-practice tips. Life Sciences Education, 6(1), 2007, 9–20.
[5] R. K.. Morgan. Exploring the Pedagogical Effectiveness of Clickers. InSight: A Journal of Scholarly Teaching, 3, 2008, 31-36.
[6] J.M. Mantikayan, M.A Ayu. Exploring audience response system: Impacts in learning institutions. Information and Communication Technology for the Muslim World (ICT4M), 2010, A13- A17.
[8] J.M. Mantikayan, M.A. Ayu, T. Mantoro, H. Mohammed. The Effects of Audience Response Systems on Active Learning. Proceedings of International Conference on Active Learning (ICAL 2012), Melaka, Malaysia.
[9] UNESCO. 2011. Secondary education regional information base: country profile – Malaysia. UNESCO Asia and Pacific Regional Bureau for Education Retrieved 17 September 2013 from
http://www.uis.unesco.org/Library/Documents/ secondary-education-malaysia-2011-en.pdf [10]UNESCO. 2009. Secondary Education
Regional Information Base: Country Profile – Philippines. UNESCO Asia and Pacific Regional Bureau for Education Retrieved 17
September 2013 from
http://www.uis.unesco.org/Library/Documents/ Philippines.pdf.
[11]A.I. Abubakar, T. Mantoro, M. Mahmud, 2011. Exploring end-user preferences of 3D mobile interactive navigation design, Proceedings of the 9th International Conference on Advances in Mobile Computing and Multimedia, 289-292.
[12]L.R. Gay, G.E. Mills, P. Airasian, Education research: Competencies for analysis and application. (9th Edition.). Person Prentice Hall, 2009, Upper Saddle River, New Jersey. [13]L. Lyberg, P. Biemer, M. Collins, deLeeuw, E.,
Dippo, C., Schwarz, N., et al. Survey Measurement and Process Quality (1st edition). 1997, Wiley-Interscience; New York, 808.
[14]R.F. Devellis. Scale development: Theory and applications (2nd edition). 2003, Thousand Oaks, California: Sage, 184.
[15]J.F. Hair, W.C. Black, B.J. Babin, & R.E. Anderson, Multivariate Data Analysis. A global perspective. Pearson Education, Inc., 2010, Upper saddle River, New Jersey.
[16]A. Abdullah, M.A. Embi, N. Nordin. The Role of Students in the Development of a Collaborative Learning Community through Networked Learning: A Malaysian Perspective. The International Journal of Learning, 18(1), 2011, 347-360.
[17]M.A. Embi, A. Hamat, A.H. Sulaiman, The Use of Learning Management Systems Among Malaysian University Lecturers. The International Journal of Learning, 18(4), 2011 61-70.
[18]I. Hamzah, A. Ismail, A.H. Tamuri, Embi, M. A., & Maimun, A. L. 2011. The Emergence of New Technology in Malaysian Smart Schools: Views of Islamic Education Teachers and Students. The International Journal of Learning, 16(4), 249-262.
[19]L.M. Abdullah, J. M. Verner. Outsourced Strategic IT Systems Development Risk. RCIS, 2009, 275-286.
[20]L.M. Abdullah, J.M. Verner. Analysis and application of an outsourcing risk framework. Journal of Systems and Software, 85(8), 2012, 1930-1952.