ORIGINAL RESEARCH
ADULT BRAIN
Predicting Genotype and Survival in Glioma Using Standard
Clinical MR Imaging Apparent Diffusion Coefficient Images:
A Pilot Study from The Cancer Genome Atlas
XC.-C. Wu,XR. Jain,XA. Radmanesh,XL.M. Poisson,X W.-Y. Guo,XD. Zagzag,XM. Snuderl,X D.G. Placantonakis,XJ. Golfinos, andXA.S. Chi
ABSTRACT
BACKGROUND AND PURPOSE: Few studies have shown MR imaging features and ADC correlating with molecular markers and survival in patients with glioma. Our purpose was to correlate MR imaging features and ADC with molecular subtyping and survival in adult diffuse gliomas.
MATERIALS AND METHODS:Presurgical MRIs and ADC maps of 131 patients with diffuse gliomas and available molecular and survival data from The Cancer Genome Atlas were reviewed. MR imaging features, ADC (obtained by ROIs within the lowest ADC area), and mean relative ADC values were evaluated to predictisocitrate dehydrogenase(IDH) mutation, 1p/19q codeletion status,MGMTpromoter methylation, and overall survival.
RESULTS:IDHwild-type gliomas tended to exhibit enhancement, necrosis, and edema;⬎50% enhancing area (P⬍.001); absence of a cystic area (P⫽.013); and lower mean relative ADC (median, 1.1 versus 1.6;P⬍.001) thanIDH-mutant gliomas. By means of a cutoff value of 1.08 for mean relative ADC,IDH-mutant andIDHwild-type gliomas with lower mean relative ADC (⬍1.08) had poorer survival than those with higher mean relative ADC (median survival time, 24.2 months; 95% CI, 0.0 –54.9 months versus 62.0 months;P⫽.003; and median survival time, 10.4 months; 95% CI, 4.4 –16.4 months versus 17.7 months; 95% CI, 11.6 –23.7 months;P⫽.041, respectively), regardless of World Health Organization grade. Median survival of those withIDH-mutant glioma with low mean relative ADC was not significantly different from that in those withIDHwild-type glioma. Other MR imaging features were not statistically significant predictors of survival.
CONCLUSIONS: IDHwild-type glioma showed lower ADC values, which also correlated with poor survival in bothIDH-mutant andIDH wild-type gliomas, irrespective of histologic grade. A subgroup withIDH-mutant gliomas with lower ADC had dismal survival similar to that of those withIDHwild-type gliomas.
ABBREVIATIONS:IDH⫽isocitrate dehydrogenase; max⫽maximum; min⫽minimum; rADC⫽relative ADC; rADCmean⫽mean relative ADC; TCGA⫽The Cancer
Genome Atlas; WHO⫽World Health Organization
G
liomas are a heterogeneous group of tumors, and the clinical aggressiveness and prognoses are diverse among different histopathologic grades and molecular subtypes. Previous studies have shown that histopathologic classification of diffuse gliomashas high interobserver variation and correlates imperfectly with clinical outcomes.1,2Nevertheless, molecular markers,
particu-larlyisocitrate dehydrogenase(IDH) mutational status, have been demonstrated to be significant and more robust prognostic mark-ers3and have been incorporated into the classification of diffuse
gliomas in the latest update of the World Health Organization (WHO) classification in 2016.4IDHmutation, a powerful
prog-nostic marker of improved survival in diffuse glioma, is found mainly in lower grade gliomas (WHO grades II and III), but also in glioblastoma (WHO grade IV), though at much lower frequency.5,6
Preoperative and noninvasive determination of molecular subtyping is of great value in the clinical management of patients with glioma. However, studies correlating MR imaging features withIDH-mutation status and patient survival in diffuse gliomas are scarce. Recently, we showed that the “T2-FLAIR mismatch sign,” detectable using conventional MR imaging, is a highly spe-Received April 25, 2018; accepted after revision July 2.
From the Department of Radiology (C.-C.W., W.-Y.G.), Taipei Veterans General Hospital, Taipei, Taiwan, Republic of China; School of Medicine (C.-C.W., W.-Y.G.), National Yang-Ming University, Taipei, Taiwan, Republic of China; Departments of Radiology (C.-C.W., R.J., A.R.), Neurosurgery (R.J., D.P., J.G.), and Pathology (D.Z., M.S.), NYU School of Medicine, New York, New York; Department of Public Health Sciences and Hermelin Brain Tumor Center (L.M.P.), Henry Ford Hospital, Detroit, Michigan; and Neuro-Oncology Program (A.S.C.), Laura and Isaac Perlmut-ter Cancer CenPerlmut-ter, NYU School of Medicine and Langone Health, New York, New York.
Chih-Chin Wu and Rajan Jain contributed equally to the article.
Please address correspondence to Rajan Jain, MD, Department of Radiology, NYU School of Medicine, 660 First Ave, 2nd Floor, New York, NY 10016; e-mail: [email protected]
http://dx.doi.org/10.3174/ajnr.A5794
cific imaging biomarker for theIDH-mutant, 1p/19q noncode-leted molecular subtype in lower grade gliomas.7 Wang et al8
demonstrated that the absence of contrast enhancement was as-sociated with longer progression-free and overall survival in patients withIDH1-mutated anaplastic gliomas. MR spectroscopy could de-tect 2-hydroxyglutarate, a metabolite that accumulates inIDH -mu-tant gliomas but did not discover a survival difference.9 Blood
volume estimates obtained by MR perfusion have also provided po-tential markers for noninvasive assessment ofIDHstatus.10
ADC can be calculated from DWI, and tumors with more freely mobile water molecules and lesser cellularity have higher ADC values.11ADC has been shown to be a valuable imaging
marker in the diagnosis of intracranial lesions as well as in grading brain tumors.11-15Therefore, we hypothesized that ADC values
obtained from conventional MR imaging could correlate with molecular subtype and patient survival in adult diffuse gliomas.
MATERIALS AND METHODS
This was a retrospective study using data from the publicly avail-able National Institutes of Health/National Cancer Institute– approved databases of The Cancer Genome Atlas (TCGA; https://cancergenome.nih.gov) and The Cancer Imaging Archive (http://www.cancerimagingarchive.net/),16-18from which all 461
cases with imaging data were reviewed, and only cases of treatment-naı¨ve diffuse gliomas (WHO grades II–IV) with available DWI and ADC maps were included. WHO grade, the status of 3 validated molecular prognostic markers (IDHmutation, 1p/19q codeletion,
MGMTpromoter methylation), and survival data were retrieved from The Cancer Genome Atlas. MR images were reviewed, in con-sensus, by 2 board-certified neuroradiologists (with 8 and 17 years of experience) who were blinded to pathologic and molecular diagno-sis. The order of cases viewed was randomized to avoid bias.
Each tumor was scored for 9 MR imaging features according to the following criteria modified from the Visually Accessible Rem-brandt Images MR imaging feature set19: T2 signal intensities
(higher than gray matter or mixed [the presence equal to or darker than that of gray matter part]); T2 homogeneity (homogeneous or heterogeneous); margin (well-defined or not well-defined [ei-ther infiltrative or irregular]); edema (none to minimal or mild to marked); enhancing pattern (non-/minimally enhancing or en-hancing); portion of enhancing area (⬍50% orⱖ50%); the pres-ence of cystic areas (prespres-ence or abspres-ence); and the prespres-ence of necrotic areas (presence or absence). We investigated the rela-tionship among 9 different MR imaging features and 3 molecular markers (IDH mutation, 1p/19q codeletion, andMGMT pro-moter methylation) as well as WHO grade and overall survival.
Diffusion-weighted images were analyzed using OsiriX Imag-ing Software (http://www.osirix-viewer.com). ADC measure-ments were generated by manually drawing 3 nonoverlapping ROIs ranging from 40 to 60 mm2within the region of lowest ADC values within the solid component of each tumor on ADC maps. The ADC value was also calculated from contralateral normal-appearing white matter by drawing a single ROI with a size similar to that of a tumoral ROI. We obtained mean, minimum (min), and maximum (max) ADCs of each tumor, respectively, by aver-aging the 3 ROIs; and relative ADC (rADCmean, rADCmin, and
rADCmax) was calculated by dividing the tumor ADC by the ADC of the contralateral normal-appearing white matter.
Statistical Analysis
The Kolmogorov-Smirnov test was used to determine whether the numeric data (age and relative ADC values) for each group were normally distributed. Independent variables (clinical pa-rameter and MR imaging features) were compared using the2 test among different molecular groups. Normally distributed continuous variables (eg, age) were compared using the indepen-dentttest or ANOVA test, and non-normally distributed contin-uous variables (rADCmean, rADCmin, and rADCmax) were com-pared using the Mann-WhitneyUtest among different molecular groups. The intraobserver reliability of ADC value measuring was tested using intraclass correlation coefficients. The optimal cutoff value of each rADC was obtained from receiver operating charac-teristic curve analysis when the Youden index reached a maxi-mum. Survival curves were estimated and plotted by the Kaplan-Meier method with log-rank tests to compare Kaplan-Kaplan-Meier curves among groups. Variables were first analyzed by the univar-iate model. MR imaging features and clinical and molecular parameters (including age, sex, WHO grade,MGMTpromoter methylation status,IDHmutation status, and 1p/19q codeletion status) with statistical significance in univariate analysis (P⬍.05) were entered into a Cox proportional hazards ratio model for multivariate analysis. Statistical significance was defined as
P⬍.05 for all tests. The statistical analyses were performed using the statistical software package SPSS 23.0 (IBM, Ar-monk, New York) and R statistical and computing software, Version 3.3.2 (http://www.r-project.org).
RESULTS
A total of 131 (59 [45%]IDHwild-type and 72 [55%]IDH -mu-tant) gliomas were included in this study. Of the 72IDH-mutant tumors, 26 (36%) were 1p/19q codeleted and 46 (64%) were non-1p/19q codeleted. Patients in theIDHwild-type group (mean, 60⫾12.2 years) were significantly older than those in theIDH -mutant group (mean, 45.1⫾13.9 years), and patients withIDH -mutant, 1p/19q codeleted gliomas (mean, 50.7⫾13.9 years) were older than those withIDH-mutant, non-1p/19q codeleted glio-mas (mean, 41.9⫾12.9 years) (P⫽.01).
Correlation between Conventional MR Imaging Features and Molecular Subtypes
Among the conventional MR imaging characteristics,IDH wild-type gliomas were more likely to exhibit enhancement (P⬍.001),
⬎50% enhancing area (P⬍.001), absence of cystic area (P⫽
.013), the presence of necrosis (P⬍.001), and the presence of edema (P⬍.001). Within theIDH-mutant group, there were no MR imaging characteristics to differentiate 1p/19q codeletion sta-tus using the features tested (Table 1).
Correlation between rADC Values and Molecular Subtypes
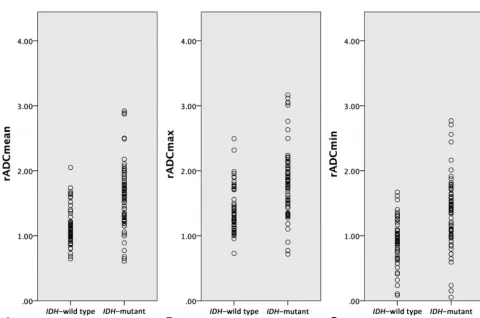
Median rADCmean, rADCmin, and rADCmaxvalues ofIDH wild-type gliomas were significantly lower than those ofIDH-mutant gliomas (P⬍.001) (Fig 1andTable 1). Within theIDH-mutant
FIG 1. Boxplot representation of rADCmeanvalues by gliomaIDHgenotype.
Table 1: MR imaging features andIDH-mutation and 1p/19q codeletion status
IDH
Wild-Type IDH-Mutant P
IDH-Mutant, Non-1p/19q Codeleted
IDH-Mutant,
1p/19q Codeleted P
MR imaging features (No.) (%) T2 signal intensitiesa
⬎Gray matter 13 (22.4%) 30 (43.5%) .012c 21 (48.8%) 9 (34.6%) .248 ⬎Mixed 45 (77.6%) 39 (56.5%) 22 (51.2%) 17 (65.4%)
T2 homogeneitya
Homogeneous 6 (10.3%) 14 (20.3%) .125 10 (23.3%) 4 (15.4%) .544 Heterogeneous 52 (89.7%) 55 (79.7%) 33 (76.7%) 22 (84.6%)
Margin
Well-defined 32 (54.2%) 27 (38.0%) .065 20 (44.4%) 7 (26.9%) .143
Mixed 27 (45.8%) 44 (62.0%) 25 (55.6%) 19 (73.1%)
Edema
No-to-minimal 20 (33.9%) 57 (79.2%) ⬍.001c 38 (82.6%) 19 (73.1%) .339 Mild-to-marked 39 (66.1%) 15 (20.8%) 8 (17.4%) 7 (26.9%)
Enhancing patternb
None/minimally enhancing 4 (7.0%) 30 (42.3%) ⬍.001c 19 (41.3%) 11 (44.0%) .826 Enhancing 55 (93.2%) 41 (56.9%) 27 (58.7%) 14 (56.0%)
Proportion of enhancing areab
⬍50% 14 (23.7%) 63 (88.7%) ⬍.001c 40 (87.0%) 23 (92.0%) .704
ⱖ50% 45 (76.3%) 8 (11.3%) 6 (13.0%) 2 (8.0%)
Cystic area
Presence 5 (8.5%) 28 (39.4%) .013c 26 (56.5%) 17 (65.4%) .461
Absence 54 (91.5%) 43 (59.7%) 20 (43.5%) 9 (34.6%)
Necrotic areab
Presence 49 (83.1%) 16 (22.5%) ⬍.001c 38 (82.6%) 17 (68.0%) .159
Absence 10 (16.9%) 55 (77.5%) 8 (17.4%) 8 (32.0%)
rADCmean(median) 1.1 1.6 ⬍.001c 1.7 1.5 .071
rADCmin(median) 0.9 1.4 ⬍.001c 1.4 1.3 .178
rADCmax(median) 1.3 1.8 ⬍.001c 1.9 1.7 .106
a
There were 4 cases lacking T2 MR images. b
One case in theIDH-mutant group lacked postcontrast studies. c
Statistically significant (P⬍.05).
[image:3.594.53.534.396.714.2]glioma cohort, rADC values trended lower in 1p/19q codeleted gliomas than in noncodeleted gliomas; however, this trend did not reach statistical significance. Receiver operating characteristic analysis identified an rADCmeanof 1.2 as the optimal cutoff value to differentiateIDHwild-type andIDH-mutant gliomas irrespec-tive of WHO grade, with the best combination of sensitivity (81.9%) and specificity (74.6%) and area under the curve (0.790; 95% CI, 0.707– 0.869;P⬍.001). In the analysis of intraobserver reliability, the intraclass correlation coefficients indicated a good correlation of the first evaluator (intraclass correlation coefficient, 0.951; 95% CI, 0.829 – 0.987;P ⬍.001) and the second evaluator (intraclass correlation coefficient, 0.926; 95% CI, 0.785– 0.975;P⬍.001).
Correlation between rADC and Overall Survival
Median overall survival was 25.4 months (95% CI, 19.0 –31.7 months), and overall cumulative survival rates were 79% at 1 year, 59% at 2 years, 42% at 3 years, and 36% at 5 years in all 131 cases. Univariate survival analysis found survival to be significantly re-lated to 6 MR imaging features, including T2 homogeneity, enhancing pattern, enhancing areas, presence of necrosis, rADCmean, and rADCminvalues, in addition to age, WHO grade,
MGMTpromoter methylation status,IDH-mutation status, and 1p/19q codeletion status.
Multivariate analysis identifiedIDHstatus and rADCmeanas the only prognostic factors that independently impacted overall survival after considering the WHO grade, MGMT promoter methylation, and 1p/19q codeletion status and adjusting for pa-tient age. Specifically,IDH-mutant gliomas had significantly lon-ger overall survival (median, 62.0 months) thanIDHwild-type gliomas (median, 14.7 months) (P⬍.001 by log-rank test; age-adjusted hazard ratio, 13.5; 95% CI, 4.8 –38.4;P⬍.001 by multi-variate Cox analysis). Overall cumulative survival rates were 97% at 1 year, 71% at 3 years, and 61% at 5 years inIDH-mutant gliomas, and 76% at 1 year and 13% at 3 years inIDHwild-type gliomas. Gliomas with higher rADCmeanhad longer overall sur-vival compared with those with lower rADCmean(P⫽.001 by univariate regression; age-adjusted hazard ratio, 0.17; 95% CI, 0.1– 0.6;P⫽.004 by multivariate Cox analysis). No statistically significant differences were noted for the remaining MR imaging features, WHO grade,MGMTpromoter methylation status, and 1p/19q codeletion status in multivariate analysis.
By means of the area under a time-dependent receiver operat-ing characteristic curve for prediction of survival at 12 months,
the optimal cutoff value of 1.08 for rADCmean could differentiate survival differences within bothIDH-mutant and
IDHwild-type gliomas. Patients having
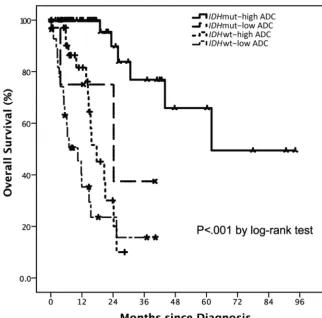
IDH-mutant gliomas with an rADCmean below the cutoff value of 1.08 had poorer survival than those with an rADCmean above 1.08 (P⬍.001). In addition, me-dian survival associated withIDH -mu-tant gliomas with a low rADCmeanwas very poor. Survival time for this group was similar to that of those with IDH
wild-type gliomas with either high or low rADCmean(Table 2andFig 2). Fi-nally, the rADCmeancutoff value of 1.08 could also distinguish a survival difference withinIDHwild-type gliomas (P⬍.041).
DISCUSSION
Mutations in theIDHgenes are among the most important diag-nostic and progdiag-nostic markers of diffuse gliomas.20Patients with IDH-mutant gliomas have significantly longer survival compared with those withIDHwild-type gliomas, and management of these 2 molecular subgroups differs significantly. Previous studies have investigated the potential of various conventional and advanced MR imaging characteristics, including perfusion, diffusion ten-sor, and MR spectroscopy, in identifying genetic subtypes of dif-fuse gliomas.10,21,22Here, our results indicate that rADC values
correlate withIDHmutation status as well as survival in both
IDH-mutant andIDHwild-type diffuse gliomas, independent of their WHO grade. Additionally, using rADC, we could identify a particularly poor prognosis subset ofIDH-mutant gliomas, with outcomes similar to those in patientsIDHwild-type disease. Most important, determining the rADC value is a simple approach that requires no specialized software; hence, our findings potentially have immediate clinical impact.
The mechanism by whichIDH-mutant and IDHwild-type gliomas differ in terms of the rADC is not clear; however, it may be related to tumor cellularity. In many previous studies, DWI has shown utility for preoperative grading and outcome of gliomas and for evaluating the response to therapy in patients with glioblastoma.13,23-27ADC values provide quantitative
informa-tion that reflects Brownian moinforma-tion of water molecules within a scanned area and are determined by many factors. Mainly, differ-ences in ADC have been attributed to tumor cellularity but also to the presence of necrosis or cysts and water content in interstitial space.11,13,28ADC has been shown to correlate inversely with
tu-mor cellularity on histologic examination, one of the main fea-tures of the WHO classification of brain tumors. Our results dem-onstrate that mostIDH-mutant gliomas exhibit higher rADCmean values and MR imaging features accordant with their low-grade features, while mostIDHwild-type gliomas show necrosis and a lower rADCmeanin solid portions, likely representing higher cel-lularity, which is associated with higher grade features.
[image:4.594.51.379.55.172.2]Previous studies have observed an association between ADC andIDHstatus in gliomas. One study of 37 anaplastic astrocyto-mas showed that the minimum ADC (cutoff point, 0.95⫻10⫺3 mm2/s) had acceptable discrimination (area under the curve,
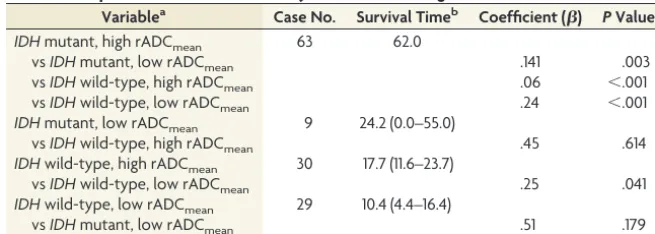
Table 2: Comparison of overall survival by relative ADC and gliomaIDH-mutation status
Variablea Case No. Survival Timeb Coefficient () PValue IDHmutant, high rADCmean 63 62.0
vsIDHmutant, low rADCmean .141 .003 vsIDHwild-type, high rADCmean .06 ⬍.001 vsIDHwild-type, low rADCmean .24 ⬍.001 IDHmutant, low rADCmean 9 24.2 (0.0–55.0)
vsIDHwild-type, high rADCmean .45 .614 IDHwild-type, high rADCmean 30 17.7 (11.6–23.7)
vsIDHwild-type, low rADCmean .25 .041 IDHwild-type, low rADCmean 29 10.4 (4.4–16.4)
vsIDHmutant, low rADCmean .51 .179
a
High rADCmean: rADCmeanvaluesⱖ1.08; low rADCmean: rADCmeanvalues⬍1.08. b
Survival time is expressed as median (95% CI) (months).
0.711; 95% CI, 0.534 – 0.887) to predict theIDHstatus.29Another
retrospective study of 112 cases by Tan et al30demonstrated that
fractional anisotropy and ADC from diffusion tensor imaging can detectIDH1mutation in astrocytomas, with the ratio of ADCmin being the best metric for detectingIDHmutation, regardless of the WHO grade. We found that rADCmeancan differentiateIDH wild-type fromIDH-mutant gliomas with excellent discrimina-tion, regardless of WHO grade. Our study also emphasizes MR imaging and ADC values correlating well with molecular subtype. The main novel finding of our study is that preoperative rADC values can distinguish favorable and unfavorable prognosis within bothIDH-mutant andIDHwild-type glioma subgroups. WhileIDH-mutant gliomas generally behave less aggressively and have a better prognosis compared with theirIDHwild-type coun-terparts, we identified a small subset (12.5%) ofIDH-mutant glio-mas with low rADCmeanvalues and poor overall survival, which was only slightly better (24 months) than that ofIDHwild-type gliomas but was not statistically significant. Concordantly, a study by Jiao et al31revealed that a small subgroup (11.7%) of patients
withIDH-mutant gliomas across all grades had a dismal progno-sis (median survival of 22 months), more similar toIDHwild-type gliomas and glioblastomas in their cohort. These tumors had dis-tinct genetic characteristics, lacking the typical concurrent genetic alterations observed inIDH-mutant gliomas. In addition, a recent study of The Cancer Genome Atlas identified a small subset (5.5%) of IDH-mutant gliomas with markedly worse survival than otherIDH-mutant gliomas, and these tumors were
associ-ated with relatively decreased global DNA methylation.32
To-gether, these data clearly indicate that a subgroup ofIDH-mutant gliomas behaves as aggressively as theirIDHwild-type counter-parts. Although whether the malignant subgroups across these datasets represent the same biology is unknown, our results sug-gest that rADC values can potentially identify this aggressively behavingIDH-mutant subgroup.
Furthermore, our study highlights how detection of robust imaging-phenotype correlations can be significantly improved by analyzing glioma datasets by molecular subtype rather than by histopathologic classification. We evaluated MR imaging features and prognosis in diffuse gliomas across lower and higher grades in the current study and demonstrated the power of rADCmeanto differentiate IDH-mutation status and discrete survival sub-groups beyond WHO grade. While many previous studies have demonstrated an inverse relationship between ADC and astrocy-toma grade,12,13,28other studies have shown substantial overlap
of ADC values between high-versus-low-grade gliomas3,24,33,34
and no significant differences between grade II versus III35or
grade III versus IV.36,37These observed variations of ADC in
pre-dicting tumor grade are likely due to limitations that make the exact histopathologic classification challenging, with high inter-observer variability2and molecular constituent and clinical
be-havior being likely different in tumors with the same histopatho-logic grade.3,4,38,39Similar to a recent meta-analysis by Zulfiqar et
al,27which showed that low ADC values correlate independently
with poor survival in malignant astrocytomas (grades III and IV),
FIG 2. Kaplan-Meier survival curve subclassification for the present study by relative ADC andIDHgenotype. Censored patients are annotated by a asterisks or plus signs. Results of the analysis are provided inTable 2.IDHmut indicatesIDH-mutant;IDHwt,IDHwild-type.
[image:5.594.132.455.44.362.2]we found an inverse relationship between rADCmeanvalues and prognosis for bothIDH-mutant andIDHwild-type tumors inde-pendent of WHO grade.
One limitation of our study is its retrospective design, which was necessary to include a relatively large number of patients and to correlate with survival, which is relatively long in patients with
IDHmutation. A second limitation is that the studied patients had been scanned on different MR imaging magnet types, and ADC maps were generated by diffusion-weighted imaging or dif-fusion tensor imaging of all collected data. However, a previous study has verified that ADC datasets from 3-directional DWI and 6-directional diffusion tensor imaging could be analyzed to-gether.40We calculated the rADC to minimize the differences
among absolute ADC values across platforms. Third, the treat-ment regimen applied to each patient was not available to us in many cases. This issue might have potentially impacted the out-come and survival in each case. However,IDHstatus has been repeatedly shown to be an independent marker of prognosis in independent datasets.4Finally, the ADC value has previously been
reported to predict 1p/19q codeletion status, a marker of oligo-dendroglioma, in lower grade gliomas.35,41In the study by
John-son et al,41the ADC values were calculated from sampling both
the highest and lowest ADC areas. However, we did not detect a significant correlation between rADC values and 1p/19q codele-tion status. Further investigacodele-tion of the optimal methods of mea-suring ADC and physiology correlates of ADC values in geneti-cally defined oligodendroglioma is needed.
Our results require independent confirmation, incorporating emerging molecular markers and accounting for different treat-ment strategies. However, our results expand on and refine the existing correlation between DWI and tumor genetic markers and highlight its potential role as an independent imaging biomarker that can aid in substratification of patients with gliomas, both
IDH-mutant andIDHwild-type. Here, we were able to identify a subset of aggressiveIDH-mutant gliomas using ADC values easily obtained from common clinical MR images. Ongoing accumula-tion of tumorigenesis knowledge, together with imaging studies stratified by molecular subgroup rather than histopathologic fea-tures, will likely identify additional robust genetic-imaging-clini-cal phenotype correlations that will improve early detection of clinically meaningful glioma molecular subtypes.
CONCLUSIONS
We demonstrate that ADC values obtained from DWI correlate withIDH-mutation status and overall survival in adult diffuse gliomas.IDH wild-type gliomas showed low ADC values and poor survival compared withIDH-mutant gliomas. Within
IDH-mutant gliomas, a small subgroup with lower ADC values had dismal survival, similar to that inIDHwild-type gliomas. ADC values correlated with survival in patients withIDH-mutant and
IDHwild-type gliomas regardless of WHO grade. Preoperative ADC estimates may corroborate with molecular subtypes as a prognostic marker and potentially enhance risk stratification, es-pecially withinIDH-mutant gliomas.
Disclosures: Dimitris Placantonakis—UNRELATED:Grants/Grants Pending: National Institutes of Health, R01 NS102665, NY State Stem Cell Program -
DOH01-STEM5-2016-00221//C32595GG*;Patents (Planned, Pending or Issued): method for treating high-grade gliomas*. *Money paid to the Institution.
REFERENCES
1. Coons SW, Johnson PC, Scheithauer BW, et al.Improving diagnostic accuracy and interobserver concordance in the classification and grad-ing of primary gliomas.Cancer1997;79:1381–93CrossRef Medline
2. van den Bent MJ.Interobserver variation of the histopathological diagnosis in clinical trials on glioma: a clinician’s perspective.Acta Neuropathol2010;120:297–304CrossRef Medline
3. Cancer Genome Atlas Research Network; Brat DJ, Verhaak RG, Al-dape KD, et al.Comprehensive, integrative genomic analysis of dif-fuse lower-grade gliomas.N Engl J Med2015;372:2481–98CrossRef Medline
4. Louis DN, Perry A, Reifenberger G, et al.The 2016 World Health Organization Classification of Tumors of the Central Nervous System: a summary.Acta Neuropathol2016;131:803–20CrossRef Medline
5. Vigneswaran K, Neill S, Hadjipanayis CG.Beyond the World Health Organization grading of infiltrating gliomas: advances in the mo-lecular genetics of glioma classification.Ann Transl Med2015;3:95
CrossRef Medline
6. Turkalp Z, Karamchandani J, Das S.IDH mutation in glioma: new insights and promises for the future.JAMA Neurol2014;71:1319 –25
CrossRef Medline
7. Patel SH, Poisson LM, Brat DJ, et al.T2-FLAIR mismatch, an imag-ing biomarker for IDH and 1p/19q status in lower grade gliomas: a TCGA/TCIA project.Clin Cancer Res2017;23:6078 – 85CrossRef Medline
8. Wang YY, Wang K, Li SW, et al.Patterns of tumor contrast enhance-ment predict the prognosis of anaplastic gliomas with IDH1 muta-tion.AJNR Am J Neuroradiol2015;36:2023–29CrossRef Medline
9. Natsumeda M, Igarashi H, Nomura T, et al.Accumulation of 2-hy-droxyglutarate in gliomas correlates with survival: a study by 3.0-Tesla magnetic resonance spectroscopy.Acta Neuropathol Commun
2014;2:158CrossRef Medline
10. Kickingereder P, Sahm F, Radbruch A, et al.IDH mutation status is associated with a distinct hypoxia/angiogenesis transcriptome sig-nature which is non-invasively predictable with rCBV imaging in human glioma.Sci Rep2015;5:16238CrossRef Medline
11. Gupta RK, Cloughesy TF, Sinha U, et al.Relationships between cho-line magnetic resonance spectroscopy, apparent diffusion coeffi-cient and quantitative histopathology in human glioma.J Neuroon-col2000;50:215–26CrossRef Medline
12. Yamasaki F, Kurisu K, Satoh K, et al.Apparent diffusion coefficient of human brain tumors at MR imaging.Radiology2005;235:985–91
CrossRef Medline
13. Lee EJ, Lee SK, Agid R, et al.Preoperative grading of presumptive low-grade astrocytomas on MR imaging: diagnostic value of mini-mum apparent diffusion coefficient.AJNR Am J Neuroradiol2008; 29:1872–77CrossRef Medline
14. Hilario A, Ramos A, Perez-Nun˜ez A, et al.The added value of appar-ent diffusion coefficiappar-ent to cerebral blood volume in the preopera-tive grading of diffuse gliomas.AJNR Am J Neuroradiol2012;33: 701– 07CrossRef Medline
15. Zhang L, Min Z, Tang M, et al.The utility of diffusion MRI with quantitative ADC measurements for differentiating high-grade from low-grade cerebral gliomas: evidence from a meta-analysis.
J Neurol Sci2017;373:9 –15CrossRef Medline
16. TCGA-GBM collection from The Cancer Imaging Archive (TCIA). https://wiki.cancerimagingarchive.net/display/Public/TCGA-GBM. Accessed April 01, 2016
17. TCGA-LGG collection from The Cancer Imaging Archive (TCIA). https://wiki.cancerimagingarchive.net/display/Public/TCGA-LGG. Accessed April 01, 2016
18. Clark K, Vendt B, Smith K, et al.The Cancer Imaging Archive (TCIA): maintaining and operating a public information reposi-tory.J Digit Imaging2013;26:1045–57CrossRef Medline
19. Wiki for the VASARI feature set The National Cancer Institute Web site. https://wikicancerimagingarchivenet/display/Public/VASARI⫹ Research⫹Project. Updated July 25, 2016
20. Eckel-Passow JE, Lachance DH, Molinaro AM, et al.Glioma groups based on 1p/19q, IDH, and TERT promoter mutations in tumors.
N Engl J Med2015;372:2499 –508CrossRef Medline
21. Xiong J, Tan W, Wen J, et al.Combination of diffusion tensor im-aging and conventional MRI correlates with isocitrate dehydroge-nase 1/2 mutations but not 1p/19q genotyping in oligodendroglial tumours.Eur Radiol2016;26:1705–15CrossRef Medline
22. Leu K, Ott GA, Lai A, et al.Perfusion and diffusion MRI signatures in histologic and genetic subtypes of WHO grade II-III diffuse glio-mas.J Neurooncol2017;134:177– 88CrossRef Medline
23. Murakami R, Hirai T, Kitajima M, et al.Magnetic resonance imaging of pilocytic astrocytomas: usefulness of the minimum apparent dif-fusion coefficient (ADC) value for differentiation from high-grade gliomas.Acta Radiol2008;49:462– 67CrossRef Medline
24. Higano S, Yun X, Kumabe T, et al.Malignant astrocytic tumors: clinical importance of apparent diffusion coefficient in prediction of grade and prognosis.Radiology2006;241:839 – 46CrossRef Medline
25. Murakami R, Sugahara T, Nakamura H, et al.Malignant supraten-torial astrocytoma treated with postoperative radiation therapy: prognostic value of pretreatment quantitative diffusion-weighted MR imaging.Radiology2007;243:493–99CrossRef Medline
26. Yamasaki F, Sugiyama K, Ohtaki M, et al.Glioblastoma treated with postoperative radio-chemotherapy: prognostic value of apparent diffusion coefficient at MR imaging.Eur J Radiol2010;73:532–37
CrossRef Medline
27. Zulfiqar M, Yousem DM, Lai H.ADC values and prognosis of ma-lignant astrocytomas: does lower ADC predict a worse prognosis independent of grade of tumor? A meta-analysis.AJR Am J Roent-genology2013;200:624 –29CrossRef Medline
28. Sugahara T, Korogi Y, Kochi M, et al.Usefulness of diffusion-weighted MRI with echo-planar technique in the evaluation of cellularity in glio-mas.J Magn Reson Imaging1999;9:53– 60CrossRef Medline
29. Wasserman JK, Nicholas G, Yaworski R, et al.Radiological and path-ological features associated with IDH1–R132H mutation status and early mortality in newly diagnosed anaplastic astrocytic tumours.
PLoS One2015;10:e0123890CrossRef Medline
30. Tan WL, Huang WY, Yin B, et al.Can diffusion tensor imaging noninvasively detect IDH1 gene mutations in astrogliomas? A
ret-rospective study of 112 cases.AJNR Am J Neuroradiol 2014;35: 920 –27CrossRef Medline
31. Jiao Y, Killela PJ, Reitman ZJ, et al.Frequent ATRX, CIC, FUBP1 and IDH1 mutations refine the classification of malignant gliomas. On-cotarget2012;3:709 –22CrossRef Medline
32. Ceccarelli M, Barthel FP, Malta TM, et al.Molecular profiling reveals biologically discrete subsets and pathways of progression in diffuse glioma.Cell2016;164:550 – 63CrossRef Medline
33. Lam WW, Poon WS, Metreweli C.Diffusion MR imaging in glioma: does it have any role in the pre-operation determination of grading of glioma?Clin Radiol2002;57:219 –25CrossRef Medline
34. Murakami R, Hirai T, Sugahara T, et al.Grading astrocytic tumors by using apparent diffusion coefficient parameters: superiority of a one- versus two-parameter pilot method.Radiology2009;251: 838 – 45CrossRef Medline
35. Khayal IS, Vandenberg SR, Smith KJ, et al.MRI apparent diffusion coefficient reflects histopathologic subtype, axonal disruption, and tumor fraction in diffuse-type grade II gliomas.Neuro Oncol2011; 13:1192–201CrossRef Medline
36. Kang Y, Choi SH, Kim YJ, et al.Gliomas: histogram analysis of ap-parent diffusion coefficient maps with standard- or high-b-value diffusion-weighted MR imaging– correlation with tumor grade.
Radiology2011;261:882–90CrossRef Medline
37. Kitis O, Altay H, Calli C, et al.Minimum apparent diffusion coeffi-cients in the evaluation of brain tumors.Eur J Radiol2005;55:393– 400Medline
38. Olar A, Wani KM, Alfaro-Munoz KD, et al.IDH mutation status and role of WHO grade and mitotic index in overall survival in grade II-III diffuse gliomas.Acta Neuropathol2015;129:585–96CrossRef Medline
39. Reuss DE, Mamatjan Y, Schrimpf D, et al.IDH mutant diffuse and anaplastic astrocytomas have similar age at presentation and little difference in survival: a grading problem for WHO.Acta Neuro-pathol2015;129:867–73CrossRef Medline
40. Khayal IS, McKnight TR, McGue C, et al.Apparent diffusion coeffi-cient and fractional anisotropy of newly diagnosed grade II glio-mas.NMR Biomed2009;22:449 –55CrossRef Medline
41. Johnson DR, Diehn FE, Giannini C, et al.Genetically defined oligo-dendroglioma is characterized by indistinct tumor borders at MRI.
AJNR Am J Neuroradiol2017;38:678 – 84CrossRef Medline