• No results found

A Flexible Bay Structure Representation and Ant Colony System for Unequal Area Facility Layout Problems

N/A
N/A
Protected

Academic year: 2020

Share "A Flexible Bay Structure Representation and Ant Colony System for Unequal Area Facility Layout Problems"

Copied!
6
0
0

Loading.... (view fulltext now)

Full text

(1)

Abstract—In this study, an ant colony system (ACS) algorithm with local search is proposed for solving the unequal area facility layout problem using a flexible bay structure (FBS) representation. Eight international benchmark problems are used to test the performance of the proposed meta-heuristics.

Compared with the previously best known solutions, ACS can obtain the same or better solutions to some benchmark problems.

Index Terms—Unequal-area facility layout, ant colony system, flexible bay structure, constrained combinatorial optimization.

I. I NTRODUCTION

Facility layout problems (FLP) occur in many organizations, including manufacturing cell design, hospital design, and service center design. One of the most critical and difficult design tasks, FLP aims to find the optimal arrangement of a given number of non-overlapping departments with unequal area requirements within a facility, so as to minimize the costs associated with projected interactions between departments. The common objective is to minimize the total material handling costs among departments. The department areas do not have to be same, but each department should follow certain ratio constraints or minimum length constraints. The problem was originally formalized by [1].

FLP can be represented by many schemes that define how departments can be arranged within the facility area. The flexible bay structure (FBS), first defined by [2], is a continuous layout representation assuming rectangular departmental shapes placed in bays and allowing the departments to be located only in parallel bays with varying widths. Therefore, the problem complexity is reduced into determining the department placement order and the total number of departments that each bay will contain. The width of a bay is adjusted by the number of departments contained.

In addition, FBS has an advantage in that the bay structure can be regarded as candidates for aisles that are necessary in

This work was supported in part by the National Science Council, Taiwan, under Grants NSC 99-2410-H-033-025-MY2.

Mei-Shiang Chang is with the Civil Engineering Department, Chung Yuan Christian University, Taoyuan 32023, Taiwan (phone: +886-3-2654210;

fax: +886-3-2654299; email: [email protected]).

Hsin-Yi Lin is with the Civil Engineering Department, Chung Yuan Christian University, Taoyuan 32023, Taiwan (email:

[email protected]).

the consideration of an actual facility design [3]. FBS has received much attention from researchers [3-14].

Due to the computational intractability of the FLP, only the FLP with fewer than 14 departments can be optimally solved.

Therefore, the majority of research on the FLP has focused on heuristic approaches to find good solutions. Metaheuristic approaches such as simulated annealing (SA) [15], genetic algorithms (GAs) [5], [16-18], tabu search (TS) [8, 19-21], the ant system (AS) [11, 22], ant colony optimization (ACO) [12], particle swarm optimization (PSO) [13], and the artificial immune system (AIS) [14] have been previously applied to FLPs.

II. M ETHODOLOGY

The Ant Colony Optimization (ACO) algorithm mimics the foraging behavior of the ant species for combinatorial optimization problem solving. In 1996, Dorigo et al. [23]

developed the first ACO algorithm, called the ant system (AS). The AS was introduced using the travelling salesperson problem (TSP) as an example application. Thereafter, AS was applied to solve various kinds of discrete optimization problems including quadratic assignment problems, vehicle routing problems, sequential ordering problems, job-scheduling problems, and resource constrained project scheduling problems.

Numerous variations of ACO have been studied, including the ant system (AS), elitist ant system (EAS), rank-based ant system (RAS), max-min ant system (MMAS) and ant colony system (ACS). ACS differs AS by introducing the state transition rule and local pheromone update as well as by using the best-so-far solution update rule [24]. In general, ACS produces better efficiency than AS.

Recently, various ACO approaches have been used to solve different FLPs. Most of them formulate FLP as a quadratic assignment problem (QAP), such as the static equal area FLP [25], [26] and the dynamic equal area FLP [27], [28]. A hybrid approach is used to solve the discrete FLP [25].

This algorithm combines an ACO algorithm and the extended great deluge local search technique. The performance of the proposed algorithm is compared to construction and improvement heuristics as well as to other ant colony implementations for QAP. The experimental results indicate that the proposed meta-heuristic offers advantages in terms of solution quality. In [26], they propose a hybrid ACO approach coupled with a guided local search to solve a train maintenance facility layout problem modeled as a QAP.

A Flexible Bay Structure Representation and Ant Colony System for Unequal Area Facility Layout

Problems

Mei-Shiang Chang and Hsin-Yi Lin

(2)

Experimental results show that this algorithm performs better for small examples, but its performance is also acceptable for large examples.

The ACO algorithm has been applied to solve the DLP with budget constraints [27]. Hybrid ant systems (HAS) were developed to solve the dynamic FLP [28]. Local search techniques, pairwise exchange, and simulated annealing are individually combined with AS. Both of these approaches also formulate the FLP as a QAP and obtain promising solutions to several test problems.

Recently, an AS, the first algorithm among ACO approaches, was presented to solve the unequal FLP [22].

This algorithm uses slicing tree representation to easily represent the FLP and can create layouts that are impossible to achieve by the FBS. In addition, nine types of local search are incorporated to improve the search performance. Overall, the proposed algorithm shows encouraging results in solving UA-FLPs.

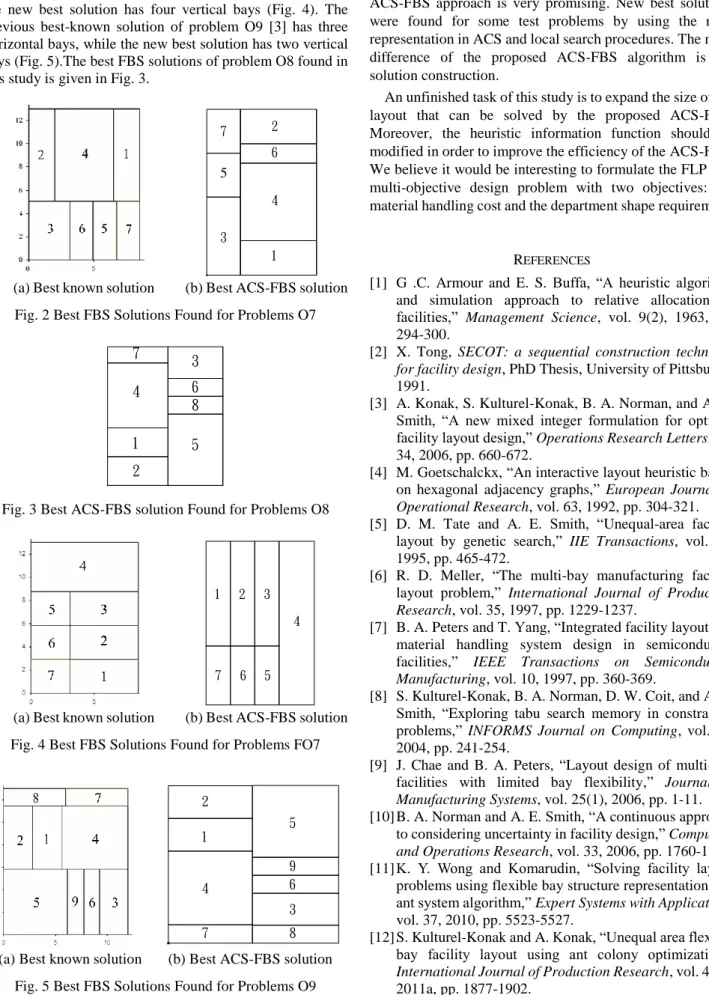
An ACO approach is proposed to solve the unequal area FLP with FBS [12]. Compared with metaheuristics such as GA, TS, and AS as well as with exact methods from the literature, this ACO approach is shown to be very effective in finding previously known best solutions and making notable improvements.

As mentioned above, the previous ACO approaches based on QAP can be extended for solving the continuous FLP. An ACS approach to the FLP with the FBS has not been reported in the literature. In this study, we propose an ant colony system to solve the unequal area FLP with the FBS.

III. S OLUTION A LGORITHM A. Solution Representation

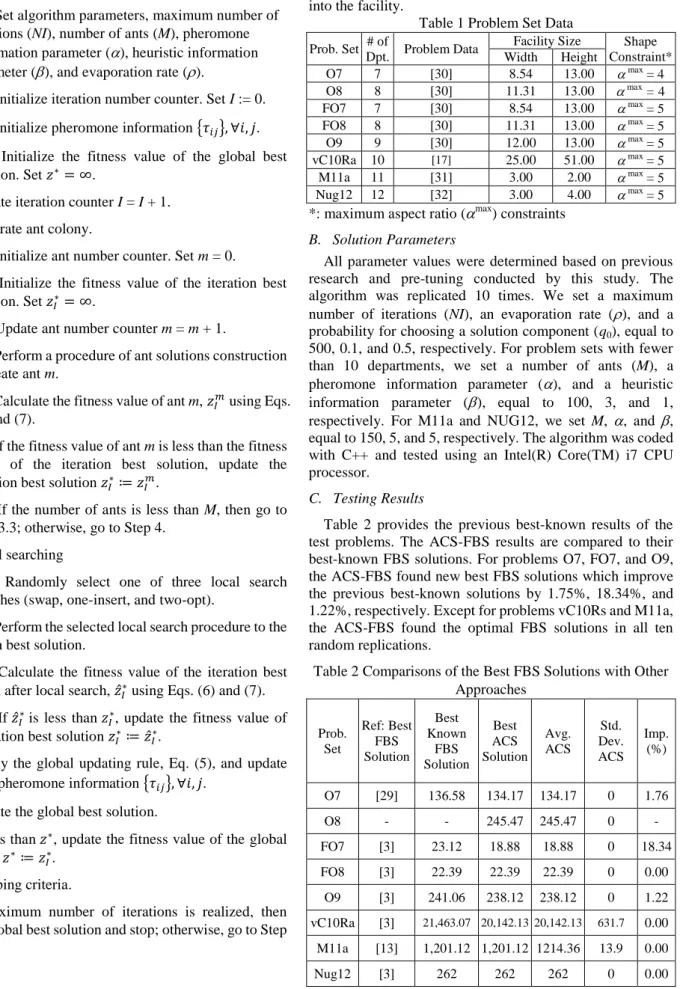
The proposed ACS algorithm uses a flexible bay structure (FBS) to represent an FLP. Without loss of generality, the facility is divided vertically. The bay width is flexible, depending on the departments that it contains. We adopt the ant solution representation proposed by [29] for solving FLPs.

Each ant solution consists of two parts: the department sequence codes and the bay break codes. The former represents the order of n departments, which will be placed into the facility. The latter is n-1 binary numbers. Here, 1 represents a bay break and 0 otherwise. The bay width is adjusted by dividing the sum of department areas contained in this bay by the facility length.

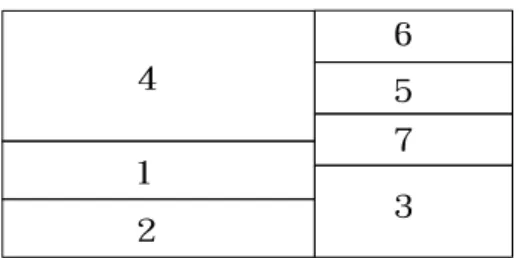
For example, a FLP with seven departments is shown in Figure 1. There are two bays: the first bay contains departments {2, 1, 4}, and the second bay contains departments {3, 7, 5, 6}. Thus, the bay break codes are 0-0-1-0-0-0. Furthermore, bays run vertically; the departments are placed from bottom to top and left to right.

The department sequence codes are 2-1-4-3-7-5-6 accordingly. We use the ant solution (2-1-4-3-7-5-6)-(0-0-1-0-0-0) to represent this layout solution.

Fig. 1 A Layout Example Using a FBS Representation B. Ant Solutions Construction

The proposed algorithm employs the pheromone information and heuristic information for constructing ant solutions. Note that the two parts of an ant solution are not constructed concurrently. First, the department sequence codes are constructed based on pheromone information and heuristic information. The bay break codes are generated based on the proposed space filling heuristic.

Space Filling Heuristic

Step 1: Randomly generate a number of bay breaks, B.

Step 2: Calculate the initial value of each bay width. Set , where W is the width of a facility.

Step 3: Apply parallel sweep method to generate facilities layout according to the department sequence codes and initial bay widths.

Step 3.1: Initialize the bay counter. Set l = 1.

Step 3.2: Gradually place unassigned departments into the l-th bay of the facility until there is not enough space to contain the oncoming department.

Step 3.3: If the available space of this bay is more than 50% of total area of the oncoming department, locate this department at bay l.

Step 3.4: Update the bay counter. Set l := l+1.

Step 3.5: If l equals to B, all of the unassigned departments are located in the last bay; go to Step 4. Otherwise, go to Step 3.2.

Step 4: Generate the bay breaks codes of ant m to present the implementations of Step 3.

Step 5: Calculate bay widths of ant m, that is, H

a l

iBl

i

b

,

where a

i

is the required area of department i; 𝐵 is the subset of departments which are placed at bay l; and H is the height of a facility.

The main procedures of the proposed ant solution construction are given below:

Step 1: Based on a state transition rule, generate the department sequence for ant m until the complete department sequence codes have been built.

Step 2: Perform the proposed space filling heuristic to generate the corresponding bay breaks codes of ant m.

Step 3: Perform the local pheromone update and update the heuristic information.

2 1 4

3 7 5 6

2 1 4

3

7

5

6

(3)

C. State Transition Rule and Heuristic Information Definition

The state transition rule is given by Eq. (1), which shows how the ant k in department i chooses the j-th position of the department sequence to move to

   

 



 

  

otherwise ,

if , max

arg 0

S

q q

s ij ij

 

(1)

where q is a random number uniformly distributed in [0, 1];

q

0

is a fixed parameter (0  q

0

 1); s is a probability to locate department i to the j-th position of the positioning order of departments;  is a parameter which determines the relative weight of pheromone information;  is a parameter which determines the relative weight of heuristic information; 

ij

is the pheromone value defined as the relative desirability of assigning department i to the j-th position of the department sequence; and is the heuristic information related to assigning department i to the j-th position of the department sequence.

In [29], the following intuitive rule is presented: “A department with higher material flow should be located nearer to the center of the facility.” In this study, the heuristic information function is defined by Eq. (2).

 

 

     

 2 2 2 2

y W W x H

m i H j j

ij (2)

where m

i

is the sum of material flow from and to department i;

x

j

is the x-coordinate of the centroid of the department which is located at the j-th position of the department sequence; and y

j

is the y-coordinate of the centroid of the department which is located at the j-th position of the department sequence.

If q is greater than q

0

, every position of the department sequence has a probability to be chosen by an ant k located in department i equal to

   

   

 

 

 

 

otherwise ,

0

if ,

i

N q

iq iq

ij ij k

ij

N j P

S

i

(3)

where is a probability of the j-th position of the department sequence to be chosen by an ant k located in department i and N

i

is available positions of the department sequence to be chosen by the corresponding ant located in department i.

D. Pheromone Updating Rules

There are two pheromone updating rules. Local updating rule is as follows:

 1  0

:    

ij    ij   (4) where 0 <  < 1 is the evaporation parameter, and represents the initial level of pheromone.

The global updating rule is denoted by Eq. (5).

 1  0

:    

ij    ij    (5)

where Δ represents the initial level of pheromone on the best trail found so far.

Note that the local updating rule does not modify the pheromone trail until a global update has been performed. On the other hand, this modification allows the ants to choose different paths in the subsequent iterations.

E. Evaluating the Fitness of Solutions

At each iteration of ACS, S solutions are generated using the procedure of ant solutions construction described in the previous section. An ant solution s is feasible if its aspect ratio is less than the maximum allowable aspect ratio for each department. Infeasible solutions are penalized by a penalty function as follows [13]:

 

      

 

 

 

  

i h i i

h i i

w i

i

i w i

i j

ij ij

h Lb h

Ub w

Lb

w Ub WH

c f P

, 0 max ,

0 max ,

0 max

, 0 max 10

(6) where Lb i h is the lower height limit of department i and

w i i h

i Ub

Lba ; Lb i w is the lower width limit of i and

h i w i

i Ub

Lba ; Ub i h is the upper height limit of i and

 

  

a W

Ub i w min ii max , ; Ub i w is the upper width limit of

i and

 

  

a H

Ub i h min ii max , ; 𝑐 is the cost per unit distance from i and j; 𝑓 is the workflow from i and j;

h

i

is the height of i; w

i

is the width of i; and 𝛼 max is the maximum aspect ratio of i.

In this study, we define the fitness value of each ant solution as the sum of material handling costs and penalty costs, denoted by Eq. (2):

d dP

c f

z ij x ij y

i j

ij

ij  

  (7)

where is the rectilinear distance of the centroids from departments i and j on the x-axis and is the rectilinear distance of the centroids from i and j on the y-axis.

F. Local Search Procedures

In order to enhance the search performance, three types of local search are applied to the best solution of the iteration to further improve it:

1. Swap between a department sequence, which exchanges the positions of departments i and j in the department sequence for all possible department pairs;

2. One-insert procedure on department sequence, which randomly chooses one department and moves it to a new position in the department sequence for all possible combinations; and

3. Two-opt procedure on department sequence, which

randomly chooses a subset chain of the department

(4)

sequence and rearranges it in the opposite direction for all possible combinations.

G. Overall Algorithm

The overall procedure of the ACS-FBS is given below:

Step 1: Parameter Setting and Initialization

Step 1.1: Set algorithm parameters, maximum number of iterations (NI), number of ants (M), pheromone information parameter (  ), heuristic information parameter (  ), and evaporation rate (  ).

Step 1.2: Initialize iteration number counter. Set I := 0.

Step 1.3: Initialize pheromone information { } . Step 1.4: Initialize the fitness value of the global best

solution. Set .

Step 2: Update iteration counter I = I + 1.

Step 3: Generate ant colony.

Step 3.1: Initialize ant number counter. Set m = 0.

Step 3.2: Initialize the fitness value of the iteration best solution. Set .

Step 3.3: Update ant number counter m = m + 1.

Step 3.4: Perform a procedure of ant solutions construction to create ant m.

Step 3.5: Calculate the fitness value of ant m, using Eqs.

(6) and (7).

Step 3.6: If the fitness value of ant m is less than the fitness value of the iteration best solution, update the iteration best solution .

Step 3.7: If the number of ants is less than M, then go to Step 3.3; otherwise, go to Step 4.

Step 4: Local searching

Step 4.1: Randomly select one of three local search approaches (swap, one-insert, and two-opt).

Step 4.2: Perform the selected local search procedure to the iteration best solution.

Step 4.3: Calculate the fitness value of the iteration best solution after local search, ̂ using Eqs. (6) and (7).

Step 4.4: If ̂ is less than , update the fitness value of the iteration best solution ̂ .

Step 5: Apply the global updating rule, Eq. (5), and update the pheromone information { } .

Step 6: Update the global best solution.

If is less than , update the fitness value of the global best solution .

Step 7: Stopping criteria.

If the maximum number of iterations is realized, then output the global best solution and stop; otherwise, go to Step 2.

IV. C OMPUTATIONAL RESULTS A. Data and Implementation

The proposed algorithm was tested using several problem sets, as listed in Table 1. Note that M11a was modified to allow the use of FBS representation. The fixed size department becomes the last department that will be assigned into the facility.

Table 1 Problem Set Data Prob. Set # of

Dpt. Problem Data Facility Size Shape Constraint*

Width Height

O7 7 [30] 8.54 13.00 

max

= 4

O8 8 [30] 11.31 13.00 

max

= 4 FO7 7 [30] 8.54 13.00 

max

= 5 FO8 8 [30] 11.31 13.00 

max

= 5 O9 9 [30] 12.00 13.00 

max

= 5 vC10Ra 10 [17] 25.00 51.00 

max

= 5 M11a 11 [31] 3.00 2.00 

max

= 5 Nug12 12 [32] 3.00 4.00 

max

= 5

*: maximum aspect ratio ( 

max

) constraints B. Solution Parameters

All parameter values were determined based on previous research and pre-tuning conducted by this study. The algorithm was replicated 10 times. We set a maximum number of iterations (NI), an evaporation rate (  ), and a probability for choosing a solution component (q

0

), equal to 500, 0.1, and 0.5, respectively. For problem sets with fewer than 10 departments, we set a number of ants (M), a pheromone information parameter (  ), and a heuristic information parameter (  ), equal to 100, 3, and 1, respectively. For M11a and NUG12, we set M,  , and  , equal to 150, 5, and 5, respectively. The algorithm was coded with C++ and tested using an Intel(R) Core(TM) i7 CPU processor.

C. Testing Results

Table 2 provides the previous best-known results of the test problems. The ACS-FBS results are compared to their best-known FBS solutions. For problems O7, FO7, and O9, the ACS-FBS found new best FBS solutions which improve the previous best-known solutions by 1.75%, 18.34%, and 1.22%, respectively. Except for problems vC10Rs and M11a, the ACS-FBS found the optimal FBS solutions in all ten random replications.

Table 2 Comparisons of the Best FBS Solutions with Other Approaches

Prob.

Set

Ref: Best FBS Solution

Best Known

FBS Solution

Best ACS Solution

Avg.

ACS

Std.

Dev.

ACS Imp.

(%)

O7 [29] 136.58 134.17 134.17 0 1.76

O8 - - 245.47 245.47 0 -

FO7 [3] 23.12 18.88 18.88 0 18.34

FO8 [3] 22.39 22.39 22.39 0 0.00

O9 [3] 241.06 238.12 238.12 0 1.22 vC10Ra [3] 21,463.07 20,142.13 20,142.13 631.7 0.00 M11a [13] 1,201.12 1,201.12 1214.36 13.9 0.00

Nug12 [3] 262 262 262 0 0.00

(5)

The previous best-known solution of problem O7 [29] has two horizontal bays, while the new best solution in this study has two vertical bays (Fig. 2). The previous best-known solution of problem FO7 [3] has four horizontal bays, while the new best solution has four vertical bays (Fig. 4). The previous best-known solution of problem O9 [3] has three horizontal bays, while the new best solution has two vertical bays (Fig. 5).The best FBS solutions of problem O8 found in this study is given in Fig. 3.

(a) Best known solution (b) Best ACS-FBS solution Fig. 2 Best FBS Solutions Found for Problems O7

Fig. 3 Best ACS-FBS solution Found for Problems O8

(a) Best known solution (b) Best ACS-FBS solution Fig. 4 Best FBS Solutions Found for Problems FO7

(a) Best known solution (b) Best ACS-FBS solution Fig. 5 Best FBS Solutions Found for Problems O9

V. C ONCLUSION

In this study, an ACS-FBS algorithm is proposed to solve unequal area FLP. The comparative results show that the ACS-FBS approach is very promising. New best solutions were found for some test problems by using the right representation in ACS and local search procedures. The main difference of the proposed ACS-FBS algorithm is the solution construction.

An unfinished task of this study is to expand the size of the layout that can be solved by the proposed ACS-FBS.

Moreover, the heuristic information function should be modified in order to improve the efficiency of the ACS-FBS.

We believe it would be interesting to formulate the FLP as a multi-objective design problem with two objectives: the material handling cost and the department shape requirement.

R EFERENCES

[1] G .C. Armour and E. S. Buffa, “A heuristic algorithm and simulation approach to relative allocation of facilities,” Management Science, vol. 9(2), 1963, pp.

294-300.

[2] X. Tong, SECOT: a sequential construction technique for facility design, PhD Thesis, University of Pittsburgh, 1991.

[3] A. Konak, S. Kulturel-Konak, B. A. Norman, and A. E.

Smith, “A new mixed integer formulation for optimal facility layout design,” Operations Research Letters, vol.

34, 2006, pp. 660-672.

[4] M. Goetschalckx, “An interactive layout heuristic based on hexagonal adjacency graphs,” European Journal of Operational Research, vol. 63, 1992, pp. 304-321.

[5] D. M. Tate and A. E. Smith, “Unequal-area facility layout by genetic search,” IIE Transactions, vol. 27, 1995, pp. 465-472.

[6] R. D. Meller, “The multi-bay manufacturing facility layout problem,” International Journal of Production Research, vol. 35, 1997, pp. 1229-1237.

[7] B. A. Peters and T. Yang, “Integrated facility layout and material handling system design in semiconductor facilities,” IEEE Transactions on Semiconductor Manufacturing, vol. 10, 1997, pp. 360-369.

[8] S. Kulturel-Konak, B. A. Norman, D. W. Coit, and A. E.

Smith, “Exploring tabu search memory in constrained problems,” INFORMS Journal on Computing, vol. 16, 2004, pp. 241-254.

[9] J. Chae and B. A. Peters, “Layout design of multi-bay facilities with limited bay flexibility,” Journal of Manufacturing Systems, vol. 25(1), 2006, pp. 1-11.

[10] B. A. Norman and A. E. Smith, “A continuous approach to considering uncertainty in facility design,” Computers and Operations Research, vol. 33, 2006, pp. 1760-1775.

[11] K. Y. Wong and Komarudin, “Solving facility layout problems using flexible bay structure representation and ant system algorithm,” Expert Systems with Applications, vol. 37, 2010, pp. 5523-5527.

[12] S. Kulturel-Konak and A. Konak, “Unequal area flexible bay facility layout using ant colony optimization,”

International Journal of Production Research, vol. 49(7), 2011a, pp. 1877-1902.

[13] S. Kulturel-Konak and A. Konak, “A new relaxed flexible bay structure representation and particle swarm 3

1 7

5

4 6 2

2 1 5 4 7

8 6 3

7 1

6 5

2 3

4

O9 a=4 252.9 O9 a=5 238.115

2 6 9 5

4

8 7 8

1

7 3

4 1 2

3 6 5

9

(6)

optimization for the unequal area facility layout problem,” Engineering Optimization, vol. 43, 2011b, pp.

1-25.

[14] B. Haktanirlar Ulutas and S. Kulturel-Konak, “An artificial immune system based algorithm to solve unequal area facility layout problem,” Expert Systems with Applications, vol. 39, 2012, pp. 5384-5395.

[15] R. D. Meller and Y. A. Bozer, “A new simulated annealing algorithm for the facility layout problem,”

International Journal of Production Research. vol. 34(6), 1996, pp. 1675-1692.

[16] P. Banerjee, Y. Zhou, and B. Montreuil, “Genetically assisted optimization of cell layout and material flow path skeleton,” IIE Transactions, vol. 29 (4), 1997, pp.

277-291.

[17] K. Y. Gau and R. D. Meller, “An iterative facility layout algorithm,” International Journal of Production Research, vol. 37(16), 1999, pp. 3739-3758.

[18] B. A. Norman, R. A. Arapoglu, and A. E. Smith,

“Integrated facilities design using a contour distance metric,” IIE Transactions, vol. 33(4), 2001, pp. 337-344.

[19] S. Kulturel-Konak, A. E. Smith, and B. A, Norman,

“Bi-objective facility expansion and relayout considering monuments,” IIE Transactions, vol. 39(7), 2007, pp. 747-761.

[20] R. Logendran and T. Kriausakul, “A methodology for solving the unequal area facility layout problem using distance and shape-based measures,” International Journal of Production Research, vol. 44(7), 2006, pp.

1243-1272.

[21] D. Scholz, A. Petrick, and W. Domschke, “STaTS: a Slicing Tree And Tabu Search based heuristic for the unequal area facility layout problem,” European Journal of Operational Research, vol. 197(1), 2009, pp. 166-178.

[22] Komarudin and K. Y. Wong, “Applying ant system for solving unequal area facility layout problems,”

European Journal of Operational Research, vol. 202(3), 2010, pp. 730-746.

[23] M. Dorigo, “Ant system: optimization by a colony of cooperating agents,” IEEE Transaction on Systems, vol.

26(1), 1996, pp. 29-41.

[24] M. Dorigo and L. M. Gambardella, “Ant colony system:

a cooperative learning approach to the traveling salesman problem,” IEEE Transactions on Evolutionary Computation, vol. 1(1), 1997, pp. 53-66.

[25] M. Nourelfath, N. Nahas, and B. Montreuil, “Coupling ant colony optimization and the extended great deluge algorithm for the discrete facility layout problem,”

Engineering Optimization, vol. 39(8), 2007, pp.

953-968.

[26] Y. Hani, L. Amodeo, F. Yalaoui, H. Chen, “Ant colony optimization for solving an industrial layout problem,”

European Journal of Operational Research, vol. 183(2), 2007, pp. 633-642.

[27] A. Baykasoglu, T. Dereli, and I. Sabuncu, “An ant colony algorithm for solving budget constrained and unconstrained dynamic facility layout problems,”

Omega, vol. 34(4), 2006, pp. 385-396.

[28] A. R. Mckendall Jr and J. Shang, “Hybrid ant systems for the dynamic facility layout problem,” Computers &

Operations Research, vol. 33(3), 2006, pp. 790-803.

[29] Komarudin, An improved ant system algorithm unequal area facility layout problems, Master Thesis, Universiti Teknologi Malaysia, 2009.

[30] R. D. Meller, V. Narayanan, and P. H. Vance, “Optimal facility layout design,” Operations Research Letters, vol.

23, 1998, pp. 117-127.

[31] Y. A. Bozer, R. D. Meller, and S. J. Erlebacher, “An improvement-type layout algorithm for single and multiple floor facilities,” Management Science, vol. 40, 1994, pp. 18-932.

[32] D. J. van Camp, A nonlinear optimization approach for

solving facility layout problem, Thesis, Department of

Industrial Engineering, University of Toronto, Canada,

1989.

Figure

Fig. 1 A Layout Example Using a FBS Representation  B.  Ant Solutions Construction
Table 1 Problem Set Data  Prob. Set  # of
Fig. 3 Best ACS-FBS solution Found for Problems O8

References

Related documents

A non dominated ranking Multi Objective Genetic Algorithm and electre method for unequal area facility layout problems.. Mathematical modeling and multi-start search simulated

Keywords: Flexible job-shop scheduling problem; Hybrid algorithm; Artificial bee colony algorithm; Local search technique; Swarm

Unmanned vehicle path planning using a novel ant colony algorithm RESEARCH Open Access Unmanned vehicle path planning using a novel ant colony algorithm Longwang Yue1 and Hanning

KEYWORDS Facility layout; Articial neural network; Discrete-event simulation; Non-dominated sorting genetic

[3] Zar Chi Su Su Hlaing and May Aye Khine, Member, IACSIT, Solving Traveling Salesman Problem by Using Improved Ant Colony Optimization Algorithm, International

Abstract: This research aimed to study the Improved Differential Evolution (IDE) for solving the Multi-floor Facility Layout Problem (MFLP) with the target of minimize the

Simulated Annealing Based Algorithms for the Facility Layout Problem,” European Journal of Operational Re- search , Vol. Lin, “A Heuristic Procedure for the Single Row

Abstract: This paper deals with Ant Colony Optimization, a heuristic algorithm with strong robustness and the ability of finding the optimal solution which has been applied to