Overfitting and Diversity in Classification Ensembles
based on Feature Selection
Pádraig Cunningham Department of Computer Science
Trinity College Dublin [email protected]
TCD-CS-2000-07
Abstract
This paper addresses Wrapper-like approaches to feature subset selection and the production of classifier ensembles based on members with different feature subsets. The paper starts with the observation that if an insufficient amount of data is used to guide the Wrapper search then the feature selection will overfit the data. If the objective of the feature selection exercise is to build a better predictor, rather than identify important features for data mining reasons, then ensembles offers a solution. Overfitting may be used to provide diversity in ensembles provided the overfitted members have variety. The paper concludes with an assessment of entropy as a measure of diversity in classifier ensembles. A tentative conclusion is that diversity is not such a problem where a large number of features is involved but needs to be monitored for problems with smaller numbers of features – say less than 25.
1. Introduction
Recent research supports the view that the Wrapper approach to feature subset selection produces better results than alternative approaches (Aha & Bankert, 1994; Kohavi & John, 1998). In the Wrapper approach the induction algorithm for which the feature subset is required is itself the evaluation mechanism in the feature selection process – the induction algorithm is wrapped in the search process. This has the obvious advantage that the inductive bias of the selection process is the same as that of the target induction process. This advantage comes at a considerable computational cost since the induction mechanism must be built and tested at each step in the search process.
In advocating that this approach to feature selection Kohavi and John (1998) introduce the caveat the Wrapper approach may overfit the data used in the evaluation mechanism. They say that this is less likely to be a problem when there is plenty of data available for use in evaluation. This may be a considerable problem in practice since in many real-world scenarios there will not be enough data available to avoid overfitting. This issue is discussed in more detail in section 2.
In a recent paper we have proposed that entropy is a good measure of diversity in classification ensembles (Cunningham & Carney, 2000). In this paper we present a comparative evaluation of that measure of diversity in two medical domains and show how it can be used to monitor the trade-off between accuracy and diversity in constructing ensembles. The underlying classifiers are Nearest Neighbour based. We also show that there is a significant problem with overfitting in these medical domains when the Wrapper approach is used for feature subset selection. To a great extent the ensemble removes this overfitting problem in building a good prediction system. However, it does not result in a single feature subset that describes the problem under consideration.
In the next section we present a brief discussion on overfitting in the context of the amount of training data available. Then we review the Entropy measure of diversity already introduced in Cunningham & Carney (2000). In section 4 we assess the insight this diversity measure provides in two medical classification domains. In this evaluation two methods for producing ensemble members are used, one selects feature subsets at random (after Ho, 1998), the other uses a search approach. This evaluation concludes with an assessment of the overfitting that is occurring in the Wrapper-like feature selection process.
2. Overfitting
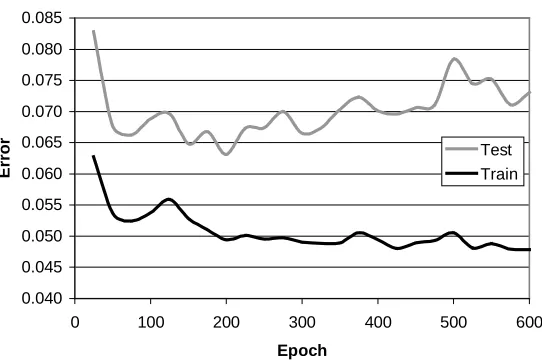
If small changes in training data can have significant influence on the outcome of a machine learning exercise then models will have high variance. There is a risk that individual models will overfit their training data and not generalise well to other data. This is a recognised problem in machine learning and several solutions exist that are appropriate for the different types of learning exercise. Most techniques involve the use of a validation set and performance on that set is used as a proxy for generalisation error. In decision tree induction this set can be used to guide pruning to improve generalisation performance. In neural networks the validation set can be used for early stopping where training is stopped when accuracy on the validation data starts to drop; an example of this is shown in Figure 1. This example clearly illustrates the overfitting problem where good generalisation performance is at odds with good performance on the training data.
Average Train & Test Error
0.040 0.045 0.050 0.055 0.060 0.065 0.070 0.075 0.080 0.085
0 100 200 300 400 500 600
Epoch
Error
[image:2.595.168.439.541.721.2]Test Train
Figure 1. This graph shows overfitting where error on unseen test data rises after 200 training epochs while
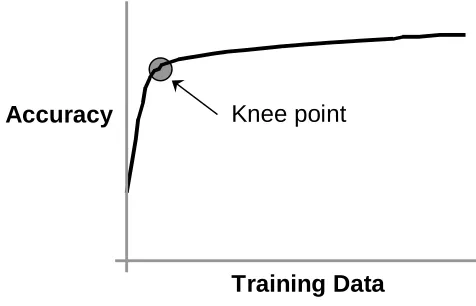
The very name ‘overfitting’ indicates that the problem stems from the learning mechanism fitting to peculiarities in the training data at the cost of generalisation performance. This implies that the training data does not adequately represent the problem domain. The graph in Figure 2 shows a classic learning curve showing how accuracy increases strongly with training data until an adequate amount of training data has been observed and the improvement tails off.
A reasonable conjecture would be that overfitting might be expected to be a problem to the left of the knee point in the graph. Whereas the amount of data available to the right of the knee point provides adequate problem coverage and a good fit to the training data is also a good fit in general. The location of this knee point will vary from problem to problem. For problems with little complexity or variety a few hundred examples may provide good domain coverage. Whereas more complex problems may require thousands of examples – the IVF data evaluated here appears to be in the latter category. In the context of the Wrapper approach to feature selection, Kohavi & John (1998) appear to endorse this conjecture – they say that overfitting is not a problem when training data is readily available. However, this issue has two serious implications for the Wrapper approach. The first is that in real feature selection problems an adequate amount of data is often not available – the two medical data-sets described here are in this category. The second is that, in order to avoid overfitting, large data sets will be needed in the Wrapper evaluation process and may prove computationally prohibitive.
Accuracy
Training Data
[image:3.595.189.427.381.534.2]Knee point
Figure 2. A typical learning curve plotting accuracy against data – the ‘knee point’ indicates where improvements in accuracy with increases in data starts to tail off (taken from (Smyth & Cunningham, 1996).
In the evaluation in section 4 the extent of the overfitting in a Wrapper-like feature selection process for the IVF and Hepatitis data-sets is illustrated. First we provide some detail on how diversity is actually an advantage in ensembles of classifiers.
3. Diversity
conditional entropy of predictions on a test set then the ambiguity even better predicts the improvement in accuracy due to the ensemble. This is not surprising since these metrics are used in a similar way by statisticians in bootstrapping. Tibshirani (1996) suggests that entropy is a good measure of dispersion in bootstrap estimation in classification.
For convenience we will present these metrics again here. For a test set containing M cases in a classification problem where there are K categories the entropy measure of ambiguity is:
∑∑
= = − = M x K k x k x k P P M A 1 1 ) log( 1 ~ (1)where Pkx is the frequency of the kth class for sample x – the more dispersion or randomness in the predictions the more ambiguity. Associated with this entropy-based measure of diversity is a Conditional Entropy-based measure of error (loss function).
) ) ( ) ( ˆ ( log )) ( ), ( ˆ ( ) ( , ) ( ˆ x c x c P x c x c P E K x c K x c CEnt
∑
∈ ∈ = (2)where cˆ x( )is predicted category for sample x and c(x) is the correct category.
In the evaluation in the next section the entropy measure of ambiguity is used but not the conditional entropy measure of error. Instead a simple count of correct classifications on the test set is used since this is a more meaningful measure of accuracy from an application perspective. The correlation between error count and conditional entropy at over 0.97 is very strong for the Hepatitis data evaluated here. It is less strong for the IVF data as reported in Cunningham & Carney (2000) – typically 0.85.
This difference reflects the non-linear relationship between the conditional entropy (CE) measure of error and the count of correct classifications. The CE measure assesses how well the classifier organises the test data. Some examples of CE values for a simple binary classification problem are shown in Table 1. In this example the test data has 60 positive cases and 40 negative. In Table 1 (b) the predictions are poor with 60 of 100 correct (35+25) and the CE is 0.97. The highest CE value occurs when there are as many incorrect classifications as correct ones and the CE value will be 1. It can be seen in Table 1 (c) where there are more errors than correct classifications that the CE value is again less than 1. In fact the CE measure will be 0 for 100% correct classifications and also for 100% misclassifications (for binary data).
Table 1. Some sample Conditional Entropy measures for a simple binary classification problem
(a) CE=0.61 Actual (b) CE=0.97 Actual (c) CE=0.93 Actual
(+) (-) (+) (-) (+) (-)
60 40 60 40 60 40
(+) 55 50 5 (+) 55 35 15 (+) 55 20 25
Pre
d
ic
te
d
(-) 45 10 35 Pre
d
ic
te
d
(-) 45 25 25 Pre
d
ic
te
d
(-) 45 40 15
4. Evaluation
In this section we evaluate two techniques for producing feature subsets on two different data-sets. The IVF data is introduced in (Cunningham, Carney & Jacob, 1999). It consists of 1355 cases 290 of which have positive outcomes. In the representation used here the cases are described by 53 numeric features. The Hepatitis data is taken from the UCI Machine Learning Repository1; there are 155 cases with 32 in the minority class. The data is described by 19 numeric features. The underlying classifiers are k-Nearest Neighbour with k set to 3. The evaluation shows, as might be expected, that this difference in the number of features in the data-sets seems to have implications for diversity in the production of ensembles.
4.1 Producing feature subsets
In the evaluation process we consider two alternatives for producing feature subsets. For a classification task with p possible input features there are 2 possible subsets of thisp feature set and each subset can be represented as a feature mask of 1s and 0s. Masks of this type representing different feature subsets can easily be produced using a random number generator. These masks should score high on diversity because there has been no attempt to learn good quality feature sets. However, because of this, they cannot be expected to have very good scores for E , the average error. Ho (1998b) has shown that ensembles of masks of this type can produce very good results – presumably because the lack of quality in the ensemble members is compensated for by the diversity.
We also evaluate better quality feature subsets (masks) produced by hill-climbing search. A mask is produced randomly as above and evaluated on a test set. Then each feature in the mask in turn is flipped (on or off) to see if the resulting mask produces better performance on the test set – if it does that change is kept. This process is continued until no further improvements are possible. The search usually terminates after three or four passes through the feature set. This mask is a local maximum in the feature subset space – there are no adjacent masks (one feature flip away) that has better performance on the test data. This algorithm is described in detail in Cunningham & Carney (2000) and is similar in spirit if not in sophistication to the genetic algorithm approach to finding good feature subsets described by Guerra-Salcedo & Whitley (1999a, 1999b). We will show in section 4.3 that when the test set is small these feature subsets produced using search seriously overfit the training data used to guide the search.
In the next section we show how the Entropy measure of diversity predicts the improvements due to the ensemble.
4.2 Entropy and Diversity
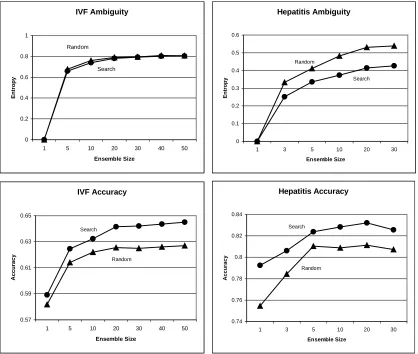
In the evaluation of the Entropy measure of diversity reported in (Cunningham & Carney, 2000) We showed that the entropy in the outcomes of the ensemble members predicted the improvements in accuracy due to the ensemble. We also found that two different approaches described above for producing masks did not significantly affect the entropy of the ensemble (see Figure 3 (top right)). A reasonable conjecture is that this is due to the large number of features and consequent huge feature subset space. Therefore the approach that produced the best feature subsets (highest average accuracy) produced the
best ensembles. The search approach produces average accuracies of almost 1% better than the random approach and since there is no appreciable loss of diversity it produces the best ensembles.
By contrast the search process on the Hepatitis data-set appears to produce some convergence and the resulting ensembles have less diversity that those based on random feature subsets. Again it seems reasonable to suppose that this is due to the relatively small number of features and the smaller search space (approx. half a million). The advantage in individual accuracy that the search based ensemble members have is not maintained in the resulting ensembles because of the loss of diversity. The search-based masks still produce the best ensembles but the lesson is that performance might be improved by focusing on maximising diversity in these good quality ensemble members.
IVF Ambiguity
0 0.2 0.4 0.6 0.8 1
1 5 10 20 30 40 50
Ensemble Size
En
tr
o
p
y
Random
Search
Hepatitis Ambiguity
0 0.1 0.2 0.3 0.4 0.5 0.6
1 3 5 10 20 30
Ensemble Size
E
n
tropy
Random
Search
IVF Accuracy
0.57 0.59 0.61 0.63 0.65
1 5 10 20 30 40 50
Ensemble Size
Accu
racy Random
Search
Hepatitis Accuracy
0.74 0.76 0.78 0.8 0.82 0.84
1 3 5 10 20 30
Ensemble Size
A
ccu
racy
Search
[image:6.595.94.512.258.612.2]Random
Figure 3. Measures of accuracy and ambiguity for classification ensembles on the IVF and Hepatitis data.
4.3 Overfitting in the feature selection search
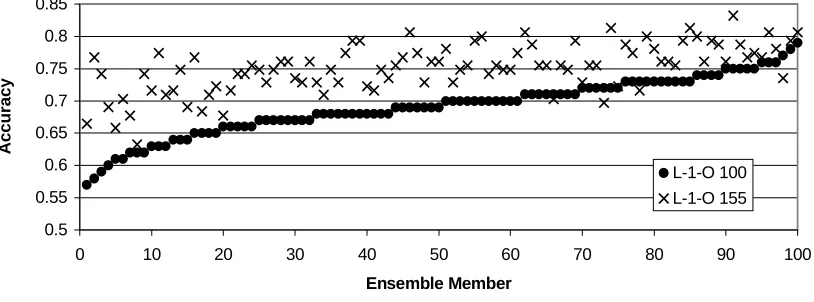
set of 155 points is also shown. It is clear that the accuracy on the larger data set is not predicted well by the accuracy on the set used to guide the search process – this is due to overfitting. The correlation between the two sets of figures is 0.55.
0.72 0.74 0.76 0.78 0.8 0.82 0.84 0.86 0.88
0 20 40 60 80 100
Ensemble Member
Accu
racy
[image:7.595.94.499.136.295.2]L-1-O 100 L-1-O 155
Figure 4. Measures of accuracy on data-sets of size 100 and 155 of masks produced using search for the
Hepatitis data.
The situation is even worse that appears from the graph in Figure 4. If the same figures are produced for the random feature subsets (see Figure 5) the correlation is better at 0.61, presumably because there has been no overfitting. More important that that is fact that it is clear that the average accuracy with Leave-One-Out testing should be higher for the larger data-set because more training data is available. This happens with the random masks but not with the search based ones – presumably because overfitting on the smaller dataset is hurting performance on the larger one.
0.5 0.55 0.6 0.65 0.7 0.75 0.8 0.85
0 10 20 30 40 50 60 70 80 90 100
Ensemble Member
Accur
acy
L-1-O 100 L-1-O 155
Figure 5. Measures of accuracy on data-sets of size 100 and 155 of random for the Hepatitis data.
5. Conclusions
The main message from this evaluation is that Wrapper-like approaches to feature selection face serious problems of overfitting if the training data-set is not sufficiently large to provide good coverage of the problem domain.
[image:7.595.91.498.457.608.2]the ensemble members are diverse and entropy is an excellent measure of this diversity for ensembles of classifiers.
If the feature set is large then managing diversity will not be such a problem because of the huge search space. It will be more of an issue with smaller feature sets, e.g. the 19 features in the Hepatitis data.
In the future we plan to evaluate these metrics on other data-sets. There is also a need to address this overfitting problem in Wrapper-like systems.
6. References
Aha, D. W., & Bankert, R. L. (1994). Feature selection for case-based classification of cloud types: An empirical comparison. In D. W. Aha (Ed.) Case-Based Reasoning:
Papers from the 1994 Workshop (Technical Report WS-94-01). Menlo Park, CA: AAAI
Press. (NCARAI TR: AIC-94-011).
Cunningham, P., Carney, J., (2000) Diversity versus Quality in Classification Ensembles Based on Feature Selection, Trinity College Dublin, Computer Science Technical Report: TCD-CS-2000-02, submitted to ECML-2000.
Cunningham, P., Carney, J., Jacob, S., (1999) Stability Problems with Artificial Neural Networks and the Ensemble Solution, Trinity College Dublin, Computer Science Technical Report: TCD-CS-1999-52, submitted to AI in Medicine.
Guerra-Salcedo, C., Whitley, D., (1999a). Genetic Approach for Feature Selection for Ensemble Creation. in GECCO-99: Proceedings of the Genetic and Evolutionary
Computation Conference, Banzhaf, W., Daida, J., Eiben, A. E., Garzon, M. H., Honavar,
V., Jakiela, M., & Smith, R. E. (eds.). Orlando, Florida USA, pp236-243, San Francisco, CA: Morgan Kaufmann.
Guerra-Salcedo, C., Whitley, D., (1999b). Feature Selection Mechanisms for Ensemble Creation: A Genetic Search Perspective, in Data Mining with Evolutionary Algorithms:
Research Directions. Papers from the AAAI Workshop. Alex A. Freitas (Ed.) Technical
Report WS-99-06. AAAI Press, 1999.
Ho, T.K., (1998b) Nearest Neighbours in Random Subspaces, Proc. Of 2nd International Workshop on Statistical Techniques in Pattern Recognition, A. Amin, D. Dori, P. Puil, H.
Freeman, (eds.) pp640-648, Springer Verlag LNCS 1451.
Kohavi, R. & John, G.H., (1998) The Wrapper Approach, in Feature Selection for
Knowledge Discovery and Data Mining, H. Liu & H. Motoda (eds.), Kluwer Academic
Publishers, pp33-50.
Krogh, A., Vedelsby, J., (1995) Neural Network Ensembles, Cross Validation and Active Learning, in Advances in Neural Information Processing Systems 7, G. Tesauro, D. S. Touretsky, T. K. Leen, eds., pp231-238, MIT Press, Cambridge MA.
Tibshirani, R., (1996) Bias, variance and prediction error for classification rules, University of Toronto, Department of Statistics Technical Report, November 1996 (also available at www-stat.stanford.edu/~tibs).