Trust and Technology Transfers
By María García-Vega and Elena Huergo*
Abstract
Research and development is largely done by multinationals (MNEs) that transfer technology to their foreign subsidiaries. Trust might be an important determinant of the governance of technology transfers because trust can reduce the dependence of the subsidiary on the headquarters. We empirically investigate how widely held perceptions of the trustworthiness of the host economy influence international technology transfers that subsidiaries receive from their business group or from other international providers. We use firm-level data on R&D imports from foreign subsidiaries operating in Spain for the period 2005 to 2012, and a Eurobarometer measure of trust between citizens of European countries. We find that subsidiaries that belong to MNEs from countries with higher trust in Spaniards have fewer technology transfers within the business group and more from international market channels than subsidiaries from countries with lower trust in Spaniards. Our results support predictions of transaction cost economics about how technology transfers are organized.
JEL Classification: D23, L14, L24, O30
Keywords: Trustworthiness, technology transfers, R&D imports, heterogeneous firms.
* García-Vega: School of Economics, University of Nottingham, University Park, Nottingham NG7 2RD, United Kingdom and GEP (email: [email protected]); Huergo: Department of Economic Analysis. Universidad Complutense de Madrid 28223, Spain (email: [email protected]).
1. Introduction
There is ample evidence on the positive effect of trust on economic growth and development (La Porta et al., 1999; Knack and Keefer, 1997; Zak and Knack, 2001; Dearmon and Grier, 2009; Guiso et al., 2008). One mechanism for the positive effect of trust on growth is that trust positively influences international transfers of technology, which in turn can enhance productivity and growth in the host economy (Eaton and Kortum, 1996; Keller, 2004). In this paper, we investigate this mechanism. We focus on the international technology transfers that subsidiaries receive from their business group and from other foreign providers. Multinationals (MNEs) are key drivers of innovations and are responsible for a large number of technology transfers (Markusen, 1984; Branstetter et al., 2006; Bertrand, 2009; Criscuolo et al., 2010). Therefore, understanding the nature of technology transfers from MNEs is of great economic relevance.
Our specific contribution is to examine whether the trustworthy environment in which multinationals and their foreign subsidiaries operate impacts the intensity of within-group and through-market international technology transfers. The hypothesis that trust might reduce within-firm transactions and increase market channel flows goes back to Williamson (1971). According to Williamson, “vertical integration would be more complete in a low-trust than a high-trust culture, ceteris paribus” (p. 122). There is evidence that subsidiaries that operate in environments perceived as less trustworthy might be more dependent on the headquarters than subsidiaries operating in highly trusted environments (Bloom et al., 2012). And as a consequence, they will receive more technology transfers from within the business group and fewer technological services from international market channels.
how much trust they have in people from various countries (a lot, some, not very much, no trust at all). This measure of trust is a measure of generalized trust and it reflects the perception of trustworthiness of the average citizen of a given country by citizens of another country (Guiso et al., 2009).
How can we interpret such perceptions of generalized trust in light of our research question? Williamson (1993a) argues that “trust is warranted when the expected gain from placing oneself at risk to another is positive, but not otherwise. Indeed, the decision to accept such a risk is taken to imply trust”. Williamson (1993b) makes three conceptual distinctions of trust by dividing trust into calculative trust (considering potential risks), personal trust (from repeated interactions) and institutional trust (from the organizational context of the contracts). Arguably, people’s answers in the Eurobarometer survey reflect all three forms of trust. People might be calculative in the sense that they weigh up previous personal experiences with citizens from other countries. However, even if citizens do not have these experiences, they can have a perception of trustworthiness that might depend on, for example, institutional quality and on cultural elements. Consistent with this argument, Guiso et al. (2009) find that cultural aspects, positive expectations of a country’s law enforcement, business morale, and the quality of the institutions form the beliefs upon which the generalized trust between citizens of countries from the Eurobarometer is based. Hence, for our purposes, we consider the measure of trust we deploy as a useful summary statistic for the perceived trustworthiness of a country’s economic environment. Note that Williamson (1981) considers that trustworthiness can be regarded as the absence of opportunism. Opportunism is key in transaction costs economics. Indeed, Williamson states that “contracting would nevertheless be feasible if economic agents were completely trustworthy” (p. 1545).
Hence, it is plausible to assume that managers of Italian and Dutch MNEs, who decide on how to organize their technology transfers, likely share perceptions of trustworthiness similar to their compatriots. Consistent with this assumption, we therefore expect that a Spanish subsidiary of an Italian MNE and a Spanish subsidiary of a Dutch MNE have a different governance of their foreign R&D inputs in a way that is consistent with national differences in perceived trustworthiness. The reason is that there is ample evidence that trust in the foreign country where the subsidiary is located increases the autonomy of the subsidiary with respect to the business group (Aghion and Tirole, 1997; Bloom et al., 2012; Kastl et al., 2013; Cingano and Pinotti, 2016). This in turns can reduce technology transfers within the business group and induce more technology procurement via market channels. This argument is consistent with the theory of transaction cost economics (Williamson, 1985, 1993), which predicts that a reduction in mutual dependence favors market exchanges and reduces vertical integration.
An alternative possibility is that trust into the host economy might reduce the concerns about a subsidiary’s ex post opportunistic behavior and thereby increase technology transfers within the business group. The reason is that when a firm transfers sensitive technology to a foreign subsidiary, this knowledge is not completely excludable. It can be leaked or misused by the employees of the subsidiary. High trustworthiness suggests that such opportunistic behavior is less likely than when trustworthiness is low. Moreover, if within-firm technology flows substitute knowledge from the market, higher perceived trustworthiness might reduce the imports of technologies that the subsidiary obtains from market channels. The main contribution of this paper is to provide an empirical assessment of the relative importance of these two possibilities.
includes information about 907 affiliates from European companies operating in Spain for the period 2005-2012. We have two measures of international technology transfers: R&D imports from companies that belong to the same business group (called from the group), and R&D imports from international providers located abroad that do not belong to the same business group (called from the market). These data provide, to our knowledge, the most detailed firm-level panel data information on R&D transactions by suppliers worldwide.
European companies operating in Spain provide a good testing case for our research question. The reason is that Spain has been one of the main receivers of foreign direct investment from the European Union, and the risk of expropriation was very small in the period analyzed (OECD, 2015). In addition, countries which belong to the EU share a common institutional environment and intellectual property rights, which helps us to isolate the influence of trust on technology transfers. Moreover, our nationally representative measure of trust in Spaniards is exogenous to unobservable firm characteristics because trust is not measured in the headquarters of the subsidiary by asking the managers directly and it precedes the years of the firm technology transfers.1
We deploy two identification strategies in this paper. The first strategy uses differences of trust that citizens from the countries of the parent companies have in Spaniards. In this way, we explore the cross-sectional variation of the data. The second identification strategy includes firm fixed effects in our regressions to analyze the effect of trust for subsidiaries that experience changes in the location of their parent company. This implies that we calculate results for within-firm variation of trust in Spaniards. Our findings are robust after including time-variant firm variables and extensive controls for heterogeneous country characteristics.
Our results show that perceived trustworthiness in Spaniards significantly affects technology transfers. High levels of perceived trustworthiness in Spaniards raise international
technology transfers from the market and reduce imports from the business group. We find in our cross-section estimations that increasing trustworthiness to the fourth quartile of the trustworthiness distribution reduces international technology transfers from the business group by 27.4%. The results from the estimations based on the within-firm trustworthiness variation are very similar for increases in trustworthiness beyond the average level of trustworthiness placed in Spaniards. This suggests that imports from the business group are important for low levels of trustworthiness and they decline once a high level of trustworthiness is reached.
In cross-section estimations, we find that increasing trustworthiness in Spaniards raises imports from the international market for the entire distribution of trustworthiness in Spaniards, but this effect is concentrated in the fourth quartile of trustworthiness in our within-trustworthiness estimations. In these estimations, we find that increasing within-trustworthiness to the fourth quartile of the trustworthiness distribution increases technology transfers from the market by 22.9%. Overall, our findings suggest that trustworthiness is important for understanding the governance of technology transfers.
The paper is organized as follows. Section 2 presents the related literature and the theoretical considerations. Section 3 describes data sources, the construction of the main variables, and some empirical regularities. Section 4 shows the econometric specification and the description of the control variables. The results are presented in Section 5. Section 6 concludes.
2. Related literature and theoretical considerations
al., 2017) and firm growth (Bloom et al., 2012). A mechanism behind these relationships is that principals who trust their agents more favor delegation and induce higher efforts from their agents. For example, Cingano and Pinotti (2016) present evidence from a sample of Italian firms that companies located in regions with higher levels of trust have larger value-added shares in delegation-intensive industries relative to other industries. Kastl et al. (2013) find that delegation increases R&D expenditures for a sample of Italian firms. Bloom et al. (2012) show for a sample of European MNEs that higher levels of bilateral trust between a multinational’s country of origin and a subsidiary’s country increases decentralization and firm size. An important difference in our approach with respect to this literature is that we focus on how the governance of technology imports depends on the host country’s perceived trustworthiness of the subsidiary.
In synthesis, these findings suggest that higher levels of perceived trust increase delegation for the provision of technology to the subsidiary. According to transaction cost economics (Williamson, 1985, 1993a), one consequence of a reduction of the dependence of the subsidiary on the group is a reduction of trade of technology within the firm and an increase in procurement from the market. The reason is that vertical integration is more likely when mutual dependence between sellers and buyers is high, and high trust reduces such dependency. Therefore, trust might shape the decision of foreign subsidiaries to source their R&D imports from the international market or from within the business group. By providing evidence for this channel, our paper contributes to a better understanding of how knowledge is obtained and organized through foreign direct investment.
outsourcing R&D might lead to the potential leakage of trade secrets. Moreover, market failures might likely arise in high R&D intensive goods. In this line, Siddharthan and Kurma (1991) find for US multinationals that internalization is high in R&D and skill intensive industries given to the product novelty and buyer’s uncertainty.
Our paper also advances the literature on the determinants of intra-firm trade by showing that trust is key to discerning the source of foreign flows of technology within firms. The literature has predominantly focused on the role of contractual incompleteness and the hold-up problem for the choice between outsourcing and vertical integration.2 The theoretical arguments of Antràs (2003) and Antràs and Helpman (2008) are based on the property rights theory of Grossman and Hart (1986). Their emphasis is on the role of asset ownership that allows allocating residual rights of control in case there are contingencies in the trade relationship. From an empirical perspective, Ulset (1996) analyzes determinants of internal and external R&D projects and their relationship with contractual incompleteness. Nunn and Trefler (2013) argue that intra-firm trade is positively related to non-contractible headquarter inputs while Bernard et al. (2010) show that it is negatively related to product contractibility and country governance quality.3 Moreover, Bernard et al. (2010) consider that country governance might mitigate the effect of product contractibility and thus reduce intra-firm trade. In contrast to this literature, we study how, for a given level of product contractibility, trustworthiness in the host country induces intra-firm and market trade of technology.
Previous literature on intra-firm trade (Helleiner and Lavergne, 1979; Siddharthan and Kumar, 1990) suggests that transaction costs and market failures are expected to increase within-firm trade and decrease open market transactions. Intra-firm trade is substituted over time by arm-length transactions when the market grows, and transaction costs decrease. In
2 See Lafontaine and Slade (2007) for a review of the literature.
contrast to our paper, these articles do not analyze the role of trustworthiness on intra-firm and market trade.
Finally, our paper also sheds new light on technology transfers within MNEs. Several articles consider transfers of intangibles and technology within MNEs essential to understanding the existence of MNEs (Teece, 1977; Markusen, 1984; Teece, 1986; Atalay et al., 2014; Ramondo et al., 2016). Branstetter et al. (2006) find that technology transfer payments within MNEs increase after intellectual property right reforms. One possible reason is that the likelihood of knowledge leakages decreases after a strengthening of intellectual property rights. The novelty of our paper is that we provide evidence of one type of technology transfer within MNEs, namely, R&D imports. Moreover, we show that R&D imports within the group are quantitatively larger than technology obtained from the market. In addition, our results suggest that transfers within MNEs are key in low-trust environments.
3. Data, main variables and some empirical regularities
The aim of this paper is to assess the effect of perceived trustworthiness in the host country on technology transfers within the business group and from the market for subsidiaries from foreign MNEs. Our source of firm-level data comes from a survey of firms operating in Spain (Panel de Innovación Tecnológica, PITEC). It is a panel database constructed by the Spanish National Institute of Statistics on the basis of annual responses to the Community Innovation Survey (CIS) administered to a representative sample of Spanish firms.4 In the survey, each company provides information on some of its economic data, such as sales or number of employees, its ownership structure, the location of its parent company and, most importantly
for our research question, very detailed information on firms’ imports of technology distinguished by provider.5
We conduct the empirical analysis for the years 2005 to 2012. We also use country-level data from different sources, which we explain below, to control for characteristics of the parent company’s country. Based on the availability of data on our trust measure, we use a panel of 907 firms that are subsidiaries of foreign European MNEs operating in Spain during the sample period.6 The panel contains an average of seven observations per firm, with the parent
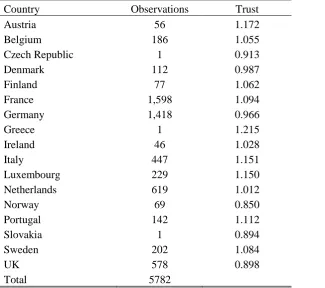
companies of these subsidiaries located mostly in France (27.6%), Germany (24.5%), the Netherlands (10.7%), the UK (10%), and Italy (7.7%), as shown in the first column of Table 1.
3.1. International technology transfers from inside and outside the business group
Our main interest is to analyze to what extent trustworthiness influences international technology transfers within the business group and from the market. Our measures of international technology transfers are R&D services acquired abroad by the subsidiary within the business group and from the market. In the survey, each company indicates its R&D acquisitions, that is, its purchases of R&D services.7R&D acquisitions are defined in the survey as:
“Acquisitions of R&D services outside the firm through contracts, informal agreements,
etc… Funds to finance other companies, research associations, etc… that do not directly imply
purchases of R&D services are excluded”.
The data allow for the disaggregation of R&D acquisitions into domestic purchases (in Spain) or imports (from abroad). With this information, we construct the variables R&D imports
5 The questions we quote below are from the English version of the CIS questionnaire. These questions are the exact equivalent of those in the Spanish questionnaire.
6 In the Eurobarometer, there is information on trust in Spaniards from citizens from 17 European countries. In our firm-level sample, there are 907 firms from these countries.
7 R&D services are defined in the survey as: “Creative work to increase the volume of knowledge and to create
within the group and R&D imports from the market. Both variables are the logarithm of imports of R&D from companies that belong to the same business group and R&D imports from providers that do not belong to the same business group, respectively, after dividing by the number of employees. Measures similar to our measure of international technology transfers within the group are used by Hu et al. (2005) and Branstetter et al. (2006), who take the expenditures on disembodied technology purchased from foreign providers as a measure of foreign technology transfers. In contrast to previous research, we can account for the exact amount of technology imports of a given firm within and outside the business group, and thereby compare technology transfers within a vertical integration relationship or through market channels at the firm level.
3.2. Trust in the host country
Our main independent variable is trust in Spaniards by citizens from the country where the parent company is located. Trust data are constructed with data from several waves of the Eurobarometer survey, as in Guiso et al. (2009) and Bloom et al. (2012).8 In the Appendix of this paper, we include full details on all country data sources. In the survey, citizens from different countries (mostly from the European Economic Area) are asked:
“I would like to ask you a question about how much trust you have in people from various
countries. For each, please tell me whether you have a lot of trust, some trust, not very much
trust or no trust at all”.
A number that varies from 1 = “no trust at all” to 4 = “a lot of trust” is assigned to each answer. Our measure of trust in Spaniards is computed as the average trust that citizens of the MNE’s headquarter country of a subsidiary have in Spaniards. We remove country fixed effects
by dividing this average by the mean trust of each country. The main advantage of the trust variable as elicited in the Eurobarometer is that it reflects the perception of the average citizen of a given country. Therefore, it also likely reflects the thoughts and attitudes of managers and middlemen of a firm (Guiso et al., 2009). Moreover, since the Eurobarometer survey is not directly conducted in the headquarters of the subsidiaries that we have in our sample and it precedes the years of the firm technology transfers, our measure of trust is exogenous to unobservable firm characteristics. Put differently, if managers of firms in our sample had been asked about how much trust they have in their subsidiaries, omitted variables would be correlated to this measure of trust and technology transfers. For example, if technology transfers had been very profitable for the firm, managers would likely believe more in the trustworthiness of the subsidiary and this would overstate the causal link between trust and technology transfers. On the flipside, if technology transfers had been unprofitable, the causal link between trust and technology transfers would be understated.
The key features of our measure of trust are that there is variation across countries in the sample, as shown in the second column of Table 1, and there are some changes in the headquarter location. Most countries trust Spaniards more than they trust other countries, on average. This is particularly relevant for Greek, Austrian and Italian citizens. Citizens from these countries trust Spanish citizens from 15.1% to 21.5% more than they trust citizens from other countries in the sample. In contrast, citizens from Norway, Slovakia and the United Kingdom trust Spain from 10.2% to 15% less than they trust people from other countries, on average.
TABLE 1
Figure 1 provides a sense of the relationship between trust and international technology transfers within the group and through market channels. We divide R&D imports into four trust quartiles. On average, imports within the group are around two and a half to three times larger than imports from the international market. The distribution of imports within the group across quartiles suggests that as trust increases from the first to the third quartile, imports within the group increase. However, further increases in trust dramatically decrease R&D imports within the group. By contrast, imports from the international market increase as trust increases, except from the second to the third quartile, where there is a small decline. These features suggest that there is an inverted-U relationship between trustworthiness and imports within the group, and a positive relationship between trustworthiness and imports from the international market. We now turn to use econometric techniques to analyze whether these relationships are robust after controlling for covariates.
FIGURE 1
4. Econometric specification and control variables
Our main goal is to estimate the effect of trustworthiness in the subsidiary on technology transfers within the business group and through market channels. Our baseline specifications are as follows:
𝑅&𝐷 𝑖𝑚𝑝𝑜𝑟𝑡𝑠 𝑖𝑛𝑡𝑒𝑛𝑠𝑖𝑡𝑦 𝑤𝑖𝑡ℎ𝑖𝑛 𝑓𝑖𝑟𝑚 (𝑓𝑟𝑜𝑚 𝑚𝑎𝑟𝑘𝑒𝑡)𝑖𝑗𝑡 = 𝛽1+ 𝛽2𝑇𝑟𝑢𝑠𝑡𝑗+ 𝛽3X𝑖𝑡−1+
+𝛽4Z𝑗𝑡−1+ 𝑑𝑡+ 𝜖𝑖𝑡, (1)
are year fixed effects, and 𝜖𝑖𝑡 is the error term. The coefficient of interest is 𝛽2, which captures the effect of trustworthiness on a subsidiary’s R&D imports.
We include the following firm characteristics as control variables: labor productivity, the average wage in the R&D department and an indicator that takes the value 1 if the company has applied for patents to control for absorptive capacity and skill mix, and 0 otherwise. We also include market power to control for competition and capital per employee to control for physical investments. Moreover, we include two variables to measure the degree of innovative or adopted R&D within the subsidiary given that innovative R&D and outsourcing of technology might be complementary (Odagiri, 1983). The first variable that we add is innovative R&D intensity, which accounts for the percentage of sales of products new to the market. The second variable is an indicator that takes the value 1 if the firms have not undertaken any product or process innovation, and 0 otherwise. Finally, we add export status and the degree of internationalization of the sector where the subsidiary operates because trade can induce companies to engage in other globalization strategies (e.g., Tomiura, 2007). The sectoral openness is calculated as sectoral imports plus exports over sectoral production (these sectoral data come from the OECD).
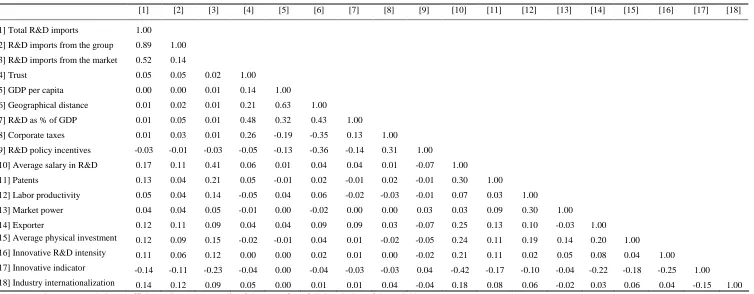
might increase imports within the group to reduce taxable profits in the high-tax country. Therefore, we might expect a positive relationship between relative corporate taxes and R&D imports within the group. Moreover, we control for R&D policy incentives (R&D taxes and other R&D related subsidies). This variable is constructed as the percentage of business and enterprise R&D financed by the government of a given country minus the percentage of business and enterprise R&D financed by the government of Spain. These data come from the OECD. Finally, we add the physical distance between capitals. Keller and Yeaple (2013) argue that complex technologies become costly to transfer as transport costs increase, which would decrease both types of technological transactions. We use the distance between capitals as a proxy for transport costs.9 In the Appendix of the paper, we document detailed variable definitions, data sources, and summary statistics (Table A1). Table OA1 in the On-line Appendix documents the correlation between the variables. It turns out that most variables are only weakly correlated.
We employ two identification strategies. The first strategy uses the differences of trust that the citizens from the countries of the parent companies have in Spaniards. In this way, we explore the cross-sectional variation of the data. The second identification strategy includes firm fixed effects in our regressions. In this way, we can analyze the effect of trust when there are changes in the location of the parent company. There are 161 foreign subsidiaries whose headquarters changed their location during the sample period. Hence, our trust coefficient is identified from within-firm variation of trust while controlling for all time-invariant firm characteristics that might affect R&D imports.
5. The effect of trust on technology transfers:
5.1. Our main result: Distinguishing between the main channels
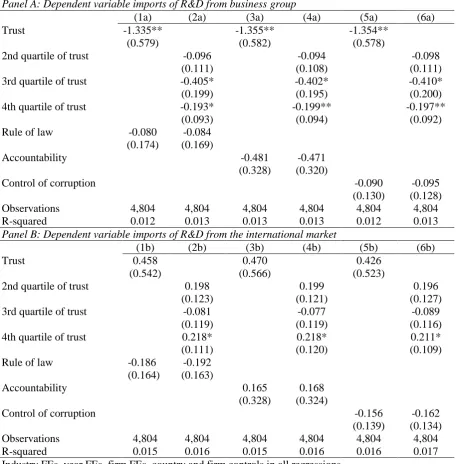
In this section, we analyze the relationship between trustworthiness and international technology transfers, distinguishing between within the firm or through international market channels. We present the results in Table 2. In panel A, the dependent variable is the natural logarithm of R&D imports from the business group and in panel B, the dependent variable is the natural logarithm of imports from the market.
variation affects R&D imports. The coefficients from columns 7a are negative and statistically significantly different from zero. Focusing on the quartile measures of trust, in columns 8a, we note that the negative effect is concentrated in MNEs from countries with above average trust in Spaniards (3rd and 4th trust quartile).
TABLE 2
With respect to the relationship between trustworthiness in Spaniards and R&D imports from the market in panel B, we show in columns 1b to 6b that trust is always strongly positively related to R&D imports from the international market. For example, the coefficient of trust in column 5b indicates that an increase in trust by one unit increases imports from the international market by 88.3%. Once we include firm fixed effects in columns 7a and 8a, we find that the positive relationship is only significant for the highest quartile of trust.
With respect to the country controls, the estimated coefficient of the GDP per capita variable is negative and significant in panel A and positive and significant in panel B. R&D expenditures as percent of GDP is negative and significantly related to imports from the international market in panel B. The effect is the opposite in the case of tax similarities, which is positive and significant at conventional levels in panel B. Among the firm-level controls, patents, average physical investment, and being an exporter are significant and positively related to R&D imports from the group. Average salary in R&D, patents, innovative R&D intensity, labor productivity and average physical investment are significant and positively related to imports from the international market.10
Overall, the results in panels A and B show a pattern of opposite-signed effects of trust on technology transfers from the group and from the market, which suggests that as trust increases, there is a reduction in the knowledge flows within the firm and an increase in the technology imported from external providers.
In Table 3, we present results from alternative econometric specifications. In order to account for observations with zero R&D imports, we present estimates using a random effect Tobit model in columns 1 and 2 and a fixed effect Poisson model in columns 3 and 4. In all specifications, we include industry and year fixed effects and country and firm controls in all regressions. The key messages remain unchanged.
TABLE 3
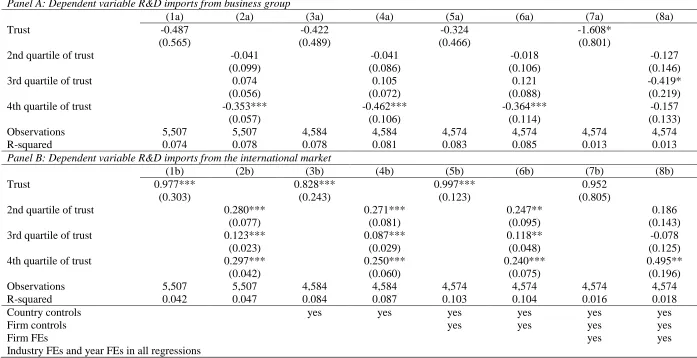
Moreover, to account for potential omitted variables that might have overstated the estimated trust coefficients, in Table OA2 in the On-line Appendix, we include additional country controls and, in Table OA3 in the On-line Appendix, we drop countries considered tax havens according to Spanish jurisdiction.11 We include three institutional indicators that capture different dimensions of rule violations and law enforcement in the country of the parent company (the source of these variables is the World Bank): the rule of law; government accountability and control of corruption. We add these indicators because the trust in Spaniards variable might be reflecting perceived differences in rule violations (Bloom et al., 2012).
In all regressions, the results are consistent with our previous estimations in Table 2 and support the positive relationship between trustworthiness and R&D imports from the international market and the negative effect of trustworthiness on imports from the business
group. This suggests that our results are not biased by omitted variables related to country institutional differences or tax havens.12
5.2. The joint decision of importing from the business group and from the market
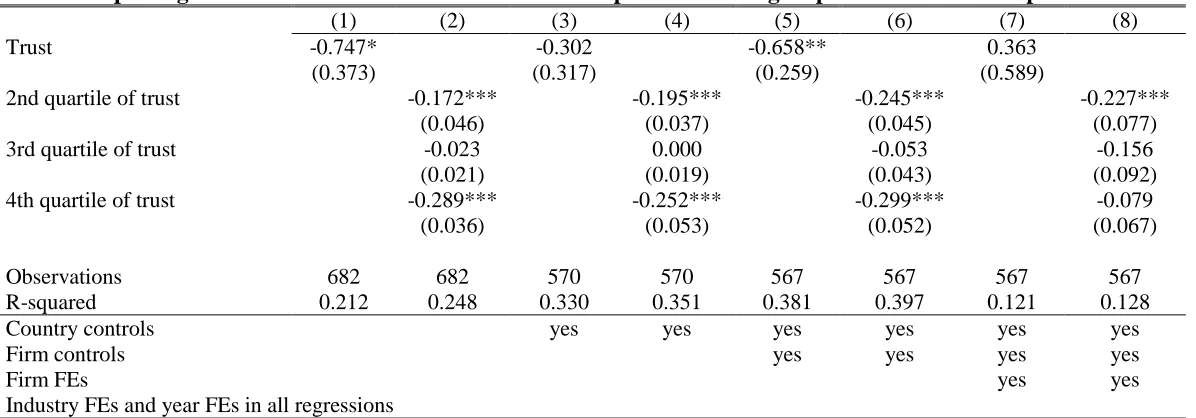
To shed light on potential differences for firms that simultaneously import R&D from the business group and from the market, in Table 4 we consider the percentage of R&D imports from the business group over total R&D imports as the dependent variable. Our estimations are for the sample of firms with positive total R&D imports. In the following tables, we follow the same specification as in Table 2.
TABLE 4
Our results in Table 4 show that the coefficient of trust is negative and statistically significant in columns 1 and 5. However, in the specifications in columns 3 and 7, trust is not significantly different from zero. Once we differentiate across trust quartiles, we observe a strong negative relationship for the second and fourth quartile of trust, which suggests that as trust increases, there is a decrease in the percentage of imports from the group, but this effect is not linear. This result remains once we include country and firm controls in columns 4 and 6. In columns 7 and 8, once we add firm fixed effects, the coefficient of trust remains negative and statistically significant for the second quartile of trust. These results support the conclusion of a negative effect of trust on the percentage of imports from the business group and the consequently positive effect for imports from the international market.
5.3. Distinguishing between international market channels
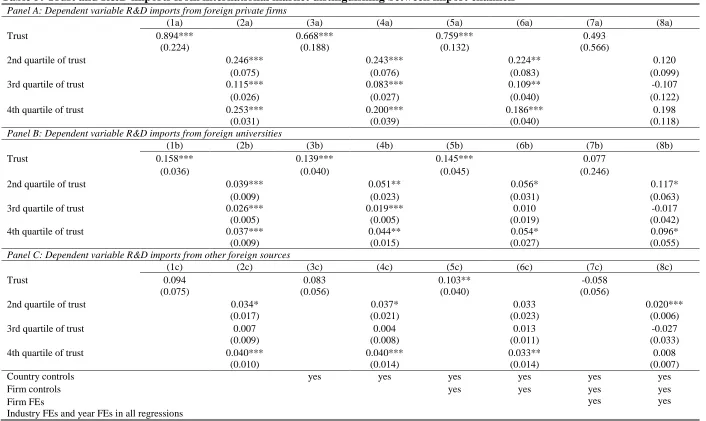
In order to gain further insights on the effects of trust on R&D transactions through the international market, we explore the heterogeneous effect of trust on different stratifications of international market channels. In Table OA4 in the On-line Appendix, we report the classification and definitions of the different subcategories of R&D imports. In Table 5, we present estimates based on three different international market channels. Panel A reports evidence for foreign private firms. Panel B reports results for foreign universities and Panel C presents evidence for other foreign sources not previously included.13
TABLE 5
In all cases the results confirm a positive relationship between trust and imports of R&D from the different foreign channels. In Panel A, the estimated coefficients in the different specifications are quite similar to those in Table 2 for total R&D imports from the foreign market. This suggests that trust is key in obtaining new knowledge from other foreign private companies that are not part of the business group. In Panels B and C, estimated coefficients are significantly lower than in Panel A. This implies that trust in the subsidiary is less important when the subsidiary is acquiring R&D services from foreign universities or other foreign sources than when they acquiring them from other foreign private firms. One possible reason is that private firms generate more commercial research than universities. For example, Spencer (2001) finds that corporate research is more influential than university research for Japanese firms’ commercial applications. Therefore, a higher level of delegation might be needed for the subsidiary to coordinate with foreign private firms than with foreign universities.
7. Summary and concluding remarks
In this paper, we studied the effects of trust on technology transfers. This is important for understanding how knowledge is organized within MNEs. We estimated determinants of R&D imports within the group and through market channels for affiliates from European firms operating in Spain. We find evidence that trustworthiness in Spaniards is negatively related to technology transfers within the business group and positively related to acquisitions through market channels. These results are consistent with transaction cost economics (Williamson, 1985, 1993) and support the hypothesis of the importance of vertical transactions in low-trust environments, and on the role of trust to enhance decentralization and delegation to the affiliate. Our findings suggest that an increase in trustworthiness may significantly change the channels through which knowledge flows, and as a consequence, influence innovation and reduce technological dependence on the foreign MNE.
References
Aghion, P., Tirole, J., 1997. Formal and real authority in organizations. The Journal of Political Economy 105(1), 1-29.
Antràs, P., 2003. Firms, contracts, and trade structure. Quarterly Journal of Economics 118(4), 1375-1418.
Antràs, P., Helpman, E., 2008. Contractual frictions and global sourcing. In: Helpman, E., Verdier, T., Marin, D. (Eds.). The Organization of Firms in a Global Economy. Cambridge, MA: Harvard University Press, 9-54.
Atalay, E., Hortaçsu A., Syverson, C., 2014. Vertical integration and input flows. American Economic Review 104(4), 1120-1148(29).
Bernard, A., Jensen, J.B., Redding, S., Schott, P.K., 2010. Intra-firm trade and product contractibility. American Economic Review 100(2), 444-448.
Bertrand, O., 2009. Effects of foreign acquisitions on R&D activity: Evidence from firm-level data for France. Research Policy 38(6), 1021-1031.
Branstetter, L., Fisman, R., Foley, C.F., 2006. Do stronger intellectual property rights increase international technology transfer? Empirical evidence from U. S. firm-level panel data. The Quarterly Journal of Economics 121, 321-349.
Brown, S., Gray, D., McHardy, J., Taylor, K., 2015. Employee trust and workplace performance. Journal of Economic Behavior and Organization 116, 361–378.
Cingano, F., Pinotti, P., 2016. Trust, firm organization, and the pattern of comparative advantage. Journal of International Economics 100, 1–13.
Criscuolo, C., Haskel, J., Slaughter, M., 2010. Global engagement and the innovation activities of firms. International Journal of Industrial Organization 28, 191–202.
Dearmon, J., Grier, K.K., 2009. Trust and development. Journal of Economic Behavior and Organization 71(2), 210–220.
Devereux, M.P., Griffith, R., 1998. Taxes and the location of production: evidence from a panel of US multinationals. Journal of Public Economics 68, 335–367.
Eaton, J., Kortum, S., 1996. Trade in ideas: Patenting and productivity in the OECD. Journal of International Economics 40(3-4), 251-278.
European Commission, several years. Eurobarometer, available at http://ec.europa.eu/public_opinion/index_en.htm
Fehr, E., 2009. On the economics and biology of trust. Journal of the European Economic Association 7(2-3), 235-266.
Godart, O., Görg, H., Hanley, A., 2017. Trust-based work-time and product improvements: Evidence from firm level data. Industrial and Labor Relations Review 70(4), 894-918. Grossman, S.J., Hart, O.D., 1986. The costs and benefits of ownership: A theory of vertical and
lateral integration. Journal of Political Economy 94(4), 691-719.
Guiso, L., Sapienza, P., Zingales, L., 2008. Trusting the stock market. The Journal of Finance 63(6), 2557–2600.
Guiso, L., Sapienza, P., Zingales, L., 2009. Cultural biases in economic exchange? The Quarterly Journal of Economics 124(3), 1095-1131.
Hu, A., Jefferson, G., Jinchang, Q., 2005. R&D and technology transfer: Firm-level evidence from Chinese industry. The Review of Economics and Statistics 87(4), 780-786. Kastl, J., Martimort, D., Piccolo, S., 2013. Delegation, ownership concentration and R&D
spending: evidence from Italy. Journal of International Economics 61(1), 84–107. Keller, W., 2004. International technology diffusion. Journal of Economic Literature 42(3),
752-782.
Keller, W., Yeaple, S.R., 2013. The gravity of knowledge. The American Economic Review 103(4), 1414-1444.
Knack, S., Keefer, P., 1997. Does social capital have an economic payoff? A cross-country investigation. Quarterly Journal of Economics 112(4), 1251–1288.
Lai, E., Riezman, R., Wang, P., 2009. Outsourcing of innovation. Economic Theory 38, 485-515.
Lafontaine, F., Slade, M., 2007. Vertical integration and firm boundaries: The evidence. Journal of Economic Literature 45(3), 629-685.
La Porta, R., López-de-Silanes, F., Shleifer, A., Vishny, R., 1999. The quality of Government. Journal of Law, Economics and Organization, 15(1), 222-279.
Markusen, J., 1984. Multinationals, multi-plant economies, and the gains from trade. Journal of International Economics 16(3–4), 205–26.
Nunn, N., Trefler, D., 2013. Incomplete contracts and the boundaries of the multinational firm. Journal of Economic Behavior and Organization 94(1), 330-344.
Odagiri, H., 1983. R&D expenditures, royalty payments, and sales growth in Japanese manufacturing corporations. Journal of Industrial Economics 32(1), 61–71.
OECD, 2005. Oslo Manual: Guidelines for Collecting and Interpreting Innovation Data, 3rd Edition. Paris: OECD Publishing.
OECD, 2015. Country risk classification, available at http://www.oecd.org/tad/xcred/crc.htm Panel de Innovación Tecnológica (PITEC). Information available at
http://sise.fecyt.es/sise-public-web/mostrarCarpetaEstudiosInformes.do
Siddharthan, N., Kumar, N., 1990. The determinants of inter-industry variations in the proportion of intra-firm trade: The behaviour of U.S. multinationals. Weltwirtschaftliches Archiv 126(3), 581-591.
Spencer, J., 2001. How relevant is university-based scientific research to private high-technology firms? A United States–Japan comparison. Academy of Management Journal 44(2), 432-440.
Stolle, D., 2002. Trusting strangers - the concept of generalized trust in perspective. Österreichische Zeitschrift für Politikwissenschaft 31(4), 397-412.
Teece, D., 1977. Technology transfer by multinational firms: the resource cost of transferring technological know-how. The Economic Journal 87(346), 242-261.
Teece, D., 1986. Transactions cost economics and the multinational enterprise: An assessment. Journal of Economic Behavior and Organization 7(1), 21-45.
Tomiura, E., 2007. Foreign outsourcing, exporting, and FDI: A productivity comparison at the firm level. Journal of International Economics 72(1), 113–127.
Ulset, S., 1996. R&D outsourcing and contractual governance: An empirical study of commercial R&D projects. Journal of Economic Behaviour and Organization 30(1), 68-82.
Williamson, O., 1971. The vertical integration of production: Market failure considerations. The American Economic Review 61(2), 112-123
Williamson, O., 1981. The Modern Corporation: Origins, Evolution, Attributes. Journal of Economic Literature 19(4), 1537-1568.
Williamson, O., 1985. The Economic Institutions of Capitalism. New York, NY: The Free Press.
Williamson, O., 1993a. Opportunism and its critics. Managerial and Decision Economics 14(2), 97-107
Williamson, O., 1993b. Calculativeness, trust, and economic organization. The Journal of Law and Economics 36(1), 453-486.
FIGURE AND TABLES
Figure 1: Trust in Spaniards and R&D imports by trust quartiles
0
.2
.4
.6
.8
Log(R&D i
mports/em
ployees) (
mean)
Q1 Q2 Q3 Q4
Quartiles of trust in Spaniards
Table 1: Distribution of subsidiaries by country of origin and trust in Spaniards.
Country Observations Trust
Austria 56 1.172
Belgium 186 1.055
Czech Republic 1 0.913
Denmark 112 0.987
Finland 77 1.062
France 1,598 1.094
Germany 1,418 0.966
Greece 1 1.215
Ireland 46 1.028
Italy 447 1.151
Luxembourg 229 1.150
Netherlands 619 1.012
Norway 69 0.850
Portugal 142 1.112
Slovakia 1 0.894
Sweden 202 1.084
UK 578 0.898
Total 5782
Table 2: Trust and R&D imports distinguishing between imports from the business group and the market Panel A: Dependent variable R&D imports from business group
(1a) (2a) (3a) (4a) (5a) (6a) (7a) (8a)
Trust -0.552 -0.375 -0.326 -1.333**
(0.494) (0.453) (0.420) (0.582)
2nd quartile of trust -0.071 -0.090 -0.061 -0.096
(0.109) (0.110) (0.128) (0.111)
3rd quartile of trust 0.075 0.094 0.132 -0.403*
(0.055) (0.072) (0.091) (0.199)
4th quartile of trust -0.314*** -0.330*** -0.274** -0.194*
(0.057) (0.105) (0.099) (0.094)
Observations 5,782 5,782 4,814 4,814 4,804 4,804 4,804 4,804
R-squared 0.075 0.078 0.078 0.080 0.084 0.085 0.012 0.013
Panel B: Dependent variable R&D imports from the international market
(1b) (2b) (3b) (4b) (5b) (6b) (7b) (8b)
Trust 1.009*** 0.771*** 0.883*** 0.463
(0.276) (0.214) (0.140) (0.563)
2nd quartile of trust 0.271*** 0.275*** 0.255** 0.200
(0.075) (0.082) (0.091) (0.122)
3rd quartile of trust 0.125*** 0.088*** 0.120** -0.077
(0.022) (0.027) (0.046) (0.119)
4th quartile of trust 0.291*** 0.246*** 0.229*** 0.216*
(0.036) (0.046) (0.051) (0.118)
Observations 5,782 5,782 4,814 4,814 4,804 4,804 4,804 4,804
R-squared 0.046 0.050 0.088 0.091 0.106 0.107 0.015 0.016
Country controls yes yes yes yes yes yes
Firm controls yes yes yes yes
Firm FEs yes yes
Industry FEs and year FEs in all regressions
Table 3: Robustness checks. Tobit and Poisson models Panel A: Dependent variable R&D imports from business group
(1a) (2a) (3a) (4a)
Estimation method: Tobit Tobit Poisson Poisson
Trust -1.183 -4.214***
(0.987) (1.115)
2nd quartile of trust -0.195 -0.422*
(0.227) (0.247)
3rd quartile of trust -0.050 -1.430***
(0.193) (0.356)
4th quartile of trust -0.435* -0.578**
(0.250) (0.243)
Observations 4,804 4,813 908 908
Panel B: Dependent variable R&D imports from the international market
(1b) (2b) (3b) (4b)
Estimation method: Tobit Tobit Poisson Poisson
Trust 1.179 1.478
(1.098) (1.475)
2nd quartile of trust 0.485* 0.767*
(0.257) (0.396)
3rd quartile of trust 0.164 -0.122
(0.171) (0.407)
4th quartile of trust 0.484* 1.098**
(0.281) (0.458)
Observations 4,804 4,813 581 581
Industry FEs, year FEs, country and firm controls in all regressions
Firm FEs Yes Yes
Table 4: Exploring the effect of trust on the ratio of R&D imports from the group over total R&D imports
(1) (2) (3) (4) (5) (6) (7) (8)
Trust -0.747* -0.302 -0.658** 0.363
(0.373) (0.317) (0.259) (0.589)
2nd quartile of trust -0.172*** -0.195*** -0.245*** -0.227***
(0.046) (0.037) (0.045) (0.077)
3rd quartile of trust -0.023 0.000 -0.053 -0.156
(0.021) (0.019) (0.043) (0.092)
4th quartile of trust -0.289*** -0.252*** -0.299*** -0.079
(0.036) (0.053) (0.052) (0.067)
Observations 682 682 570 570 567 567 567 567
R-squared 0.212 0.248 0.330 0.351 0.381 0.397 0.121 0.128
Country controls yes yes yes yes yes yes
Firm controls yes yes yes yes
Firm FEs yes yes
Industry FEs and year FEs in all regressions
Table 5: Trust and R&D imports from international market distinguishing between import channels Panel A: Dependent variable R&D imports from foreign private firms
(1a) (2a) (3a) (4a) (5a) (6a) (7a) (8a)
Trust 0.894*** 0.668*** 0.759*** 0.493
(0.224) (0.188) (0.132) (0.566)
2nd quartile of trust 0.246*** 0.243*** 0.224** 0.120
(0.075) (0.076) (0.083) (0.099)
3rd quartile of trust 0.115*** 0.083*** 0.109** -0.107
(0.026) (0.027) (0.040) (0.122)
4th quartile of trust 0.253*** 0.200*** 0.186*** 0.198
(0.031) (0.039) (0.040) (0.118)
Panel B: Dependent variable R&D imports from foreign universities
(1b) (2b) (3b) (4b) (5b) (6b) (7b) (8b)
Trust 0.158*** 0.139*** 0.145*** 0.077
(0.036) (0.040) (0.045) (0.246)
2nd quartile of trust 0.039*** 0.051** 0.056* 0.117*
(0.009) (0.023) (0.031) (0.063)
3rd quartile of trust 0.026*** 0.019*** 0.010 -0.017
(0.005) (0.005) (0.019) (0.042)
4th quartile of trust 0.037*** 0.044** 0.054* 0.096*
(0.009) (0.015) (0.027) (0.055)
Panel C: Dependent variable R&D imports from other foreign sources
(1c) (2c) (3c) (4c) (5c) (6c) (7c) (8c)
Trust 0.094 0.083 0.103** -0.058
(0.075) (0.056) (0.040) (0.056)
2nd quartile of trust 0.034* 0.037* 0.033 0.020***
(0.017) (0.021) (0.023) (0.006)
3rd quartile of trust 0.007 0.004 0.013 -0.027
(0.009) (0.008) (0.011) (0.033)
4th quartile of trust 0.040*** 0.040*** 0.033** 0.008
(0.010) (0.014) (0.014) (0.007)
Country controls yes yes yes yes yes yes
Firm controls yes yes yes yes
Firm FEs yes yes
Industry FEs and year FEs in all regressions
APPENDIX
In this appendix, we define country variables, describe data sources that we use in our analysis and present the descriptive statistics.
Definition of the variables
Trust: Our main independent variable is trust in Spaniards. It is the average trust that citizens of the MNE’s headquarter country of a subsidiary have in Spaniards, dividing by the mean trust of each country. The Eurobarometer survey provides information about this question. In the survey, citizens from different countries (mostly from the European Economic Area) are asked: “I would like to ask you a question about how much trust you have in people from various countries. For each, please tell me whether you have a lot of trust, some trust, not very much trust or no trust at all”. A number is assigned for each answer. We collect information from the following waves of the Eurobarometer where this question is asked: 1986, 1990, 1993, 1994, 1995, 1996, and 1997 and construct the average of these values. For Eastern European countries, we collect information from the Central and Eastern European Barometer for the year 1990.
GDP per capita is the natural logarithm of the GDP over the population of the MNE’s
headquarter country. The data are from the IMF (from
http://www.imf.org/external/pubs/ft/weo/2014/01/weodata/index.aspx) for the years 2005 to 2012. The variable “GDP per capita” ranges from 9.69 to 11.63 in our sample.
Geographical distance is the distance between the capital of the MNE’s headquarter country and Madrid. The measure is in logarithms. The data are from CEPII (http://www.cepii.fr/CEPII/en/bdd_modele/presentation.asp?id=6). For details on this database, see Mayer, T. & Zignago, S. (2011), Notes on CEPII’s distances measures: the GeoDist Database. CEPII Working Paper 2011-25.
R&D as % of GDP is the research and development expenditure as a percentage of the GDP of the MNE’s headquarter country. The source of these data is the World Bank
(http://data.worldbank.org/indicator/GB.XPD.RSDV.GD.ZS?view=chart) for the years 2005 to 2012. The variable “R&D as % of GDP” is in logarithms and it ranges from -0.74 to 1.32.
Corporate taxes are the corporate income taxes of the MNE’s headquarter country over Spanish corporate taxes. The data come from the OECD database (http://stats.oecd.org//Index.aspx?QueryId=58204#), completed with data from KPMG Global corporate tax rate tables (https://home.kpmg.com/xx/en/home/services/tax/tax-tools-and-resources/tax-rates-online/corporate-tax-rates-table.html) for the years 2005 to 2012. The variable ranges from 0.35 to 1.20.
The following variables refer to characteristics of the MNE’s headquarter country used in the robustness checks of the On-line Appendix. For the following three variables, the data come from the Worldwide Governance Indicators (WGI) of the World Bank: http://info.worldbank.org/governance/wgi/index.aspx#reports
Rule of law reflects perceptions of the extent to which agents have confidence in the rules of society, and in particular the quality of contract enforcement and property rights. The index can take values between -2.5 and 2.5. In our sample, it ranges from 0.35 to 1.99. We take data for the years 2005 to 2012.
Accountability reflects perceptions of the extent to which a country's citizens are able to participate in selecting their government, as well as freedom of expression, freedom of association, and a free media. The index can take values between -2.5 and 2.5. In our sample,
it ranges from 0.80 to 1.76. We take data for the years 2005 to 2012.
Table A1: Descriptive statistics
Variable Mean SD Observations
R&D imports from the group 0.538 1.933 8668
R&D imports from the market 0.267 1.305 8668
from foreign private firms 0.248 1.261 8668
from foreign universities 0.027 0.386 8668
from other foreign sources 0.019 0.322 8668
Trust 1.035 0.081 5782
Country controls
GDP per capita 10.674 0.311 8000
Geographical distance 7.552 0.719 8016
R&D as % of GDP 0.760 0.351 7716
Corporate taxes 1.032 0.184 8022
R&D policy incentives -8.857 3.726 7023
Firm controls
Average salary in R&D 5.033 5.177 8669
Patents 0.101 0.301 8669
Labor productivity 12.316 1.016 8668
Market power 1.000 2.374 8669
Exporter 0.723 0.447 8668
Average physical investment 6.508 3.664 8668
Innovative R&D intensity 8.082 19.919 7689
Innovative indicator 0.364 0.481 8638
Industry internationalization 0.134 0.116 9872
Institutional country indicators
Rule of law 1.520 0.380 8038
Accountability 1.294 0.269 8038
Control of corruption 1.551 0.498 8034
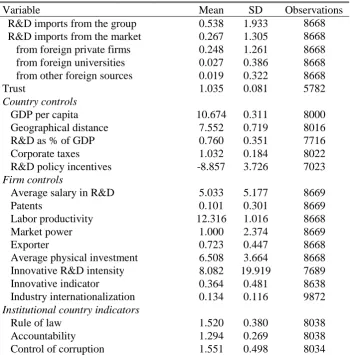
Notes: The data include observations from all PITEC dataset firms that are subsidiaries of foreign MNEs during the period 2005-2012. R&D imports from the business group (market) is the natural logarithm of R&D imports from the business group (market); the R&D imports from the international market can be disaggregated into those from foreign private companies, from foreign universities and from other foreign sources. Trust is the trust that citizens of the MNE’s headquarter country have in Spaniards. GDP per capita is the natural logarithm of the GDP over the population of the MNE’s headquarter country. Geographical distance is the distance between the capital of the MNE’s headquarter country and Madrid (in natural logarithm). R&D as % of GDP is the research and development expenditure as percentage of the GDP of the MNE’s headquarter country. R&D policy incentives are the public incentives to business and enterprise R&D of a given country minus those of Spain. Corporate taxes are the corporate income taxes of the MNE’s headquarter country over Spanish corporate taxes. Average salary in R&D is the total salary in R&D over the number of employees working in R&D of a firm. Patents is a dummy variable that takes the value one if the firm has applied for patents in the current or previous two years. Labor productivity is the natural logarithm of the sales over the number of employees of a firm. Market power is a firm’s sales relative to its industry. Exporter is an indicator that takes the value one if the firm is an exporter. Average physical investment is the natural logarithm of a firm’s average physical investment over its number of employees. Innovative R&D intensity is the percentage over sales of new products new to the market.
Innovative indicator is a dummy variable that takes the value one if the firm does not have any product or process innovation. Industry internationalization is the degree of openness (imports plus exports over production) of the sector where the firm operates. The following variables refer to characteristics of the MNE’s headquarter country used in the robustness checks of the On-line Appendix: Rule of law reflects perceptions of the extent to which agents have confidence in the rules of society, and in particular the quality of contract enforcement and property rights;
ON-LINE APPENDIX
Trust and Technology Transfer
Maria Garcia-Vega and Elena Huergo Table of Contents
Table OA1: Correlation matrix
Table OA2: Robustness checks; Adding institutional indicators
Table OA1: Correlation matrix
[1] [2] [3] [4] [5] [6] [7] [8] [9] [10] [11] [12] [13] [14] [15] [16] [17] [18]
[1] Total R&D imports 1.00
[2] R&D imports from the group 0.89 1.00
[3] R&D imports from the market 0.52 0.14
[4] Trust 0.05 0.05 0.02 1.00
[5] GDP per capita 0.00 0.00 0.01 0.14 1.00
[6] Geographical distance 0.01 0.02 0.01 0.21 0.63 1.00
[7] R&D as % of GDP 0.01 0.05 0.01 0.48 0.32 0.43 1.00
[8] Corporate taxes 0.01 0.03 0.01 0.26 -0.19 -0.35 0.13 1.00
[9] R&D policy incentives -0.03 -0.01 -0.03 -0.05 -0.13 -0.36 -0.14 0.31 1.00
[10] Average salary in R&D 0.17 0.11 0.41 0.06 0.01 0.04 0.04 0.01 -0.07 1.00
[11] Patents 0.13 0.04 0.21 0.05 -0.01 0.02 -0.01 0.02 -0.01 0.30 1.00
[12] Labor productivity 0.05 0.04 0.14 -0.05 0.04 0.06 -0.02 -0.03 -0.01 0.07 0.03 1.00
[13] Market power 0.04 0.04 0.05 -0.01 0.00 -0.02 0.00 0.00 0.03 0.03 0.09 0.30 1.00
[14] Exporter 0.12 0.11 0.09 0.04 0.04 0.09 0.09 0.03 -0.07 0.25 0.13 0.10 -0.03 1.00 [15] Average physical investment 0.12 0.09 0.15 -0.02 -0.01 0.04 0.01 -0.02 -0.05 0.24 0.11 0.19 0.14 0.20 1.00
[16] Innovative R&D intensity 0.11 0.06 0.12 0.00 0.00 0.02 0.01 0.00 -0.02 0.21 0.11 0.02 0.05 0.08 0.04 1.00
[17] Innovative indicator -0.14 -0.11 -0.23 -0.04 0.00 -0.04 -0.03 -0.03 0.04 -0.42 -0.17 -0.10 -0.04 -0.22 -0.18 -0.25 1.00
[18] Industry internationalization 0.14 0.12 0.09 0.05 0.00 0.01 0.01 0.04 -0.04 0.18 0.08 0.06 -0.02 0.03 0.06 0.04 -0.15 1.00
Table OA2: Robustness checks adding institutional indicators Panel A: Dependent variable imports of R&D from business group
(1a) (2a) (3a) (4a) (5a) (6a)
Trust -1.335** -1.355** -1.354**
(0.579) (0.582) (0.578)
2nd quartile of trust -0.096 -0.094 -0.098
(0.111) (0.108) (0.111)
3rd quartile of trust -0.405* -0.402* -0.410*
(0.199) (0.195) (0.200)
4th quartile of trust -0.193* -0.199** -0.197**
(0.093) (0.094) (0.092)
Rule of law -0.080 -0.084
(0.174) (0.169)
Accountability -0.481 -0.471
(0.328) (0.320)
Control of corruption -0.090 -0.095
(0.130) (0.128)
Observations 4,804 4,804 4,804 4,804 4,804 4,804
R-squared 0.012 0.013 0.013 0.013 0.012 0.013
Panel B: Dependent variable imports of R&D from the international market
(1b) (2b) (3b) (4b) (5b) (6b)
Trust 0.458 0.470 0.426
(0.542) (0.566) (0.523)
2nd quartile of trust 0.198 0.199 0.196
(0.123) (0.121) (0.127)
3rd quartile of trust -0.081 -0.077 -0.089
(0.119) (0.119) (0.116)
4th quartile of trust 0.218* 0.218* 0.211*
(0.111) (0.120) (0.109)
Rule of law -0.186 -0.192
(0.164) (0.163)
Accountability 0.165 0.168
(0.328) (0.324)
Control of corruption -0.156 -0.162
(0.139) (0.134)
Observations 4,804 4,804 4,804 4,804 4,804 4,804
R-squared 0.015 0.016 0.015 0.016 0.016 0.017
Industry FEs, year FEs, firm FEs, country and firm controls in all regressions
Table OA3: Robustness checks dropping countries considered to be tax havens Panel A: Dependent variable R&D imports from business group
(1a) (2a) (3a) (4a) (5a) (6a) (7a) (8a)
Trust -0.487 -0.422 -0.324 -1.608*
(0.565) (0.489) (0.466) (0.801)
2nd quartile of trust -0.041 -0.041 -0.018 -0.127
(0.099) (0.086) (0.106) (0.146)
3rd quartile of trust 0.074 0.105 0.121 -0.419*
(0.056) (0.072) (0.088) (0.219)
4th quartile of trust -0.353*** -0.462*** -0.364*** -0.157
(0.057) (0.106) (0.114) (0.133)
Observations 5,507 5,507 4,584 4,584 4,574 4,574 4,574 4,574
R-squared 0.074 0.078 0.078 0.081 0.083 0.085 0.013 0.013
Panel B: Dependent variable R&D imports from the international market
(1b) (2b) (3b) (4b) (5b) (6b) (7b) (8b)
Trust 0.977*** 0.828*** 0.997*** 0.952
(0.303) (0.243) (0.123) (0.805)
2nd quartile of trust 0.280*** 0.271*** 0.247** 0.186
(0.077) (0.081) (0.095) (0.143)
3rd quartile of trust 0.123*** 0.087*** 0.118** -0.078
(0.023) (0.029) (0.048) (0.125)
4th quartile of trust 0.297*** 0.250*** 0.240*** 0.495**
(0.042) (0.060) (0.075) (0.196)
Observations 5,507 5,507 4,584 4,584 4,574 4,574 4,574 4,574
R-squared 0.042 0.047 0.084 0.087 0.103 0.104 0.016 0.018
Country controls yes yes yes yes yes yes
Firm controls yes yes yes yes
Firm FEs yes yes
Industry FEs and year FEs in all regressions
Table OA4: Classification of R&D imports
Definition
[1] R&D imports Acquisition of R&D services from abroad: Firm purchases (from abroad) of creative work on an occasional or regular basis in order to increase the stock of knowledge and its use to devise new and improved goods, services and processes from other companies (including other enterprises within the group) or public and private research organizations
[1.1.] R&D imports from the group R&D acquisitions from companies located abroad that belong to the same business group [1.2] R&D imports from the market Acquisition of R&D from other companies located abroad (excluding other enterprises within
the group) or public and private research organizations
[1.2.1] from foreign private firms R&D acquisitions from other private companies located abroad (excluding other enterprises within the group)
[1.2.2] from foreign universities R&D acquisitions from universities located abroad