Separation of Nickel and Cobalt Utilizing Selective Reduction
of Nickel in Acidic Aqueous Solution
Sakae Shirayama
+1and Tetsuya Uda
+2Department of Materials Science and Engineering, Graduate School of Engineering, Kyoto University, Kyoto 606-8501, Japan
With the aim of separating nickel (Ni) from cobalt (Co) in acidic aqueous solution, selective reduction of Ni was examined. Sodium hypophosphite (NaH2PO2) was selected as a reductant, and reacted with aqueous solution containing 0.1 mol L¹1nickel sulfate (NiSO4·6H2O)
and 0³0.05 mol L¹1cobalt sulfate (CoSO
4·7H2O) for 3 hours at 90°C. As a result, Ni was selectively reduced and separated from Co in the
acidic region (pH=4.8). Differences in reduction rate between Ni and Co were discussed, and the influence of impurities on the reduction of Ni was also examined by adding copper (Cu), iron (Fe), and zinc (Zn) ions to the feed solution. [doi:10.2320/matertrans.M-M2014846]
(Received September 10, 2014; Accepted November 13, 2014; Published January 17, 2015)
Keywords: nickel, cobalt, selective reduction, hypophosphite, hydrometallurgy
1. Introduction
Efficient Ni recovery and separation from Co are essential in nickel hydrometallurgical processes. Currently, the hydro-metallurgical production of Ni from oxide ore is mainly carried out by acid leaching at elevated temperature, followed by the removal of impurities using neutralization, and recovery of Ni and Co into intermediate products such as hydroxides and sulfides. Then, the intermediate product is dissolved in acidic aqueous solutions, and Ni/Co separation is conducted by solvent extraction. Finally, Ni and Co are recovered by electro-winning. This complicated process consumes large amount of alkali, hydrogen sulfide (H2S), and organic solution in a multiple-staged process.14) To reduce the consumption of these chemicals, it is important to recover Ni more efficiently from acidic aqueous solution containing impurities.
According to previous research, it seems to be possible to separate Ni from Co in acidic aqueous solution by utilizing the difference in their oxidation or reduction rate, despite their close standard oxidation reduction potential (¹265 mV vs. S.H.E. for Ni and¹340 mV vs. S.H.E. for Co at 25°C5)). For example, electroless plating of Co is difficult in acidic solution because of its slow reduction rate, while Ni plating is successfully conducted at pH=4.5.6) Wajszczuk and Charewicz investigated the reduction of Co from acidic solution (pH=3.7³6.5) using hydrogen under pressure (6³42 atm), and found that there is a long (2³3 hours) induction time before reduction starts.7) In view of these examples, selective reduction of Ni in acidic solution is a feasible way to separate Ni from Co.
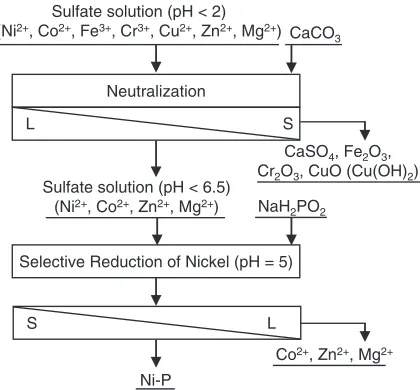
Figure 1 shows a block flow diagram of a proposed Ni production process utilizing the selective reduction of Ni ion in acidic solution. We selected sodium hypophosphite (NaH2PO2) as a reductant. NaH2PO2is directly reacted with acidic aqueous solution after the neutralization process (pH<6.5). This simple process enables us to achieve condensation of Ni and Ni/Co separation simultaneously,
and Ni will be obtained as nickel-phosphorus (Ni-P) powder. Finally, Ni-P will be dissolved, and pure-Ni will be obtained by electrolysis. In the current industrial practice, Sherritt Gordon process is known as a process which utilizes the direct reduction of Ni in ammonia (NH3) alkaline solution.8) In Sherritt Gordon process, Ni is selectively reduced from a mixed solution of Ni and Co using H2 gas under high pressure (10 atm). However, the process requires large amount of NH3 to prevent Ni hydroxide from deposition. On the contrary, the selective reduction in acidic aqueous solution proposed in this study does not need complexing agent like NH3in Sherritt Gordon process. In this study, the feasibility of the selective reduction of Ni was experimentally examined.
2. Thermodynamic Analysis
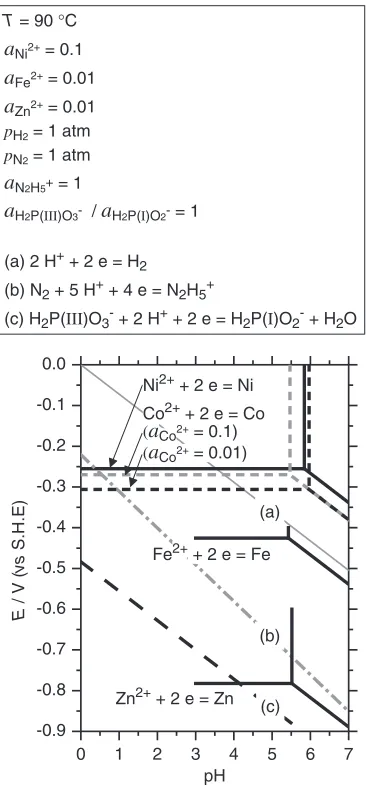
In this study, NaH2PO2 was selected as a reductant. Thermodynamically, both Ni and Co will be reduced not only by NaH2PO2but also by other reductants such as H2gas and hydrazinium dichloride (N2H6Cl2). Figure 2 shows a
poten-Sulfate solution (pH < 2)
(Ni2+, Co2+, Fe3+, Cr3+, Cu2+, Zn2+, Mg2+) CaCO 3
CaSO4, Fe2O3, Cr2O3, CuO (Cu(OH)2) Neutralization
S L
Selective Reduction of Nickel (pH = 5) Sulfate solution (pH < 6.5)
(Ni2+, Co2+, Zn2+, Mg2+) NaH 2PO2
Ni-P
Co2+, Zn2+, Mg2+
L S
Fig. 1 Proposed simplified flowchart of the nickel production process utilizing selective reduction of nickel in acidic aqueous solution.
+1Graduate Student, Kyoto University
+2Corresponding author, E-mail: materials_process@aqua.mtl.kyoto-u.ac.jp
[image:1.595.323.533.298.493.2]tial-pH diagram at 90°C for several metals.5,9)The activityai of dissolved substance i was defined by its molar concen-tration [i] in molarity (mol L¹1), and the standard state of gaseous speciesgwas defined by ideal gas under 1 atm. After the neutralization process in the Ni production process, magnesium (Mg2+), ferric (Fe3+), and zinc (Zn2+) ions are the main impurities in the solution. In Fig. 2, Mg2+does not appear because its standard oxidation reduction potential is extremely low (¹2.3 V vs. S.H.E. at 25°C). In the presence of a reductant, Fe3+is considered to be reduced into ferrous ion (Fe2+). Lines (a), (b), and (c) in Fig. 2 represent the oxidation reduction potential of H2gas, hydrazinium ion (N2H5+), and hypophosphite ion (H2P(I)O2¹), respectively. This diagram clearly shows that both Ni and Co are expected to be reduced by these reductants, even in the acidic region. Furthermore, the removal of impurities could be achieved thermodynami-cally by utilizing H2gas or N2H5+as a reductant; reduction by H2gas could separate Fe and Zn, and reduction by N2H5+ could separate Zn.
In spite of the thermodynamic analysis mentioned above, in the hydrometallurgical process, actual reduction behavior is strongly affected by kinetics resulting from the thermody-namic driving force for the reaction route, temperature, catalytic activity, stability of complexes, and so on.
There-fore, the reduction of Ni and Co ions by H2gas needs to be conducted under high pressure. As a matter of fact, 1 atm H2 gas and N2H6Cl2 were not effective as reductants in acidic aqueous solution. In this study, the feasibility of selective reduction of Ni was investigated by using NaH2PO2 which was well known as a reductant for the electroless plating of Ni in the acidic solution.
3. Material and Methods
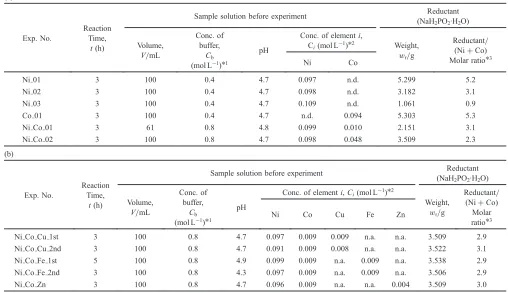
Experiments were carried out by reacting the sample solution containing Ni and Co or another metal ion with NaH2PO2·H2O in the acidic region. Firstly, the difference in reduction behavior between Ni and Co, and the selective reduction of Ni were examined in the conditions summarized in Table 1(a). Each sample solution (NiSO4solution, CoSO4 solution, and mixed solution) was prepared by dissolving hydrated metal sulfates in de-ionized water. The pair of acetic acid and sodium acetate (CH3COOH/CH3COONa) was used as a pH buffer (pKa=4.8). Note that acetate ion (CH3COO¹) does not reduce Ni ion or Co ion. The effect of metal impurities on the reduction behavior was also examined by preparing the sample solution as summarized in Table 1(b). In this experiment, copper (II) sulfate pentahy-drate (CuSO4·5H2O), iron (II) sulfate heptahydrate (FeSO4· 7H2O), or zinc sulfate heptahydrate (ZnSO4·7H2O) was added to the sample solution as impurities.
Figure 3 shows the apparatus for the experiment. The sample solution was exposed to argon (Ar) gas bubbling for 30 min to eliminate dissolved oxygen. NaH2PO2·H2O in the form of powder was added and dissolved in the sample solution at room temperature. The molar ratio of NaH2PO2· H2O to Ni and Co ranged from 1 to 5. Then, the solution was heated up to 90°C because reaction did not occur at room temperature. The reaction was conducted under Ar gasflow and monitored for 3 hours after heating started, and the solution was sampled at intervals of 0.5³1.5 hours. After the reaction, precipitates were recovered and washed using de-ionized water and 2-propanol, and then dried under a vacuum. The concentrations of each element in the recovered precipitates and sampled solutions were determined by inductively coupled plasma atomic emission spectrometry (ICP-AES, SII, SPS3500). Precipitates were analyzed by X-ray diffraction (XRD, PANalytical X’Pert Pro) and scanning electron microscopy (SEM, KEYENCE VE-7800).
4. Results and Discussion
4.1 The difference in reduction behavior between Ni and Co
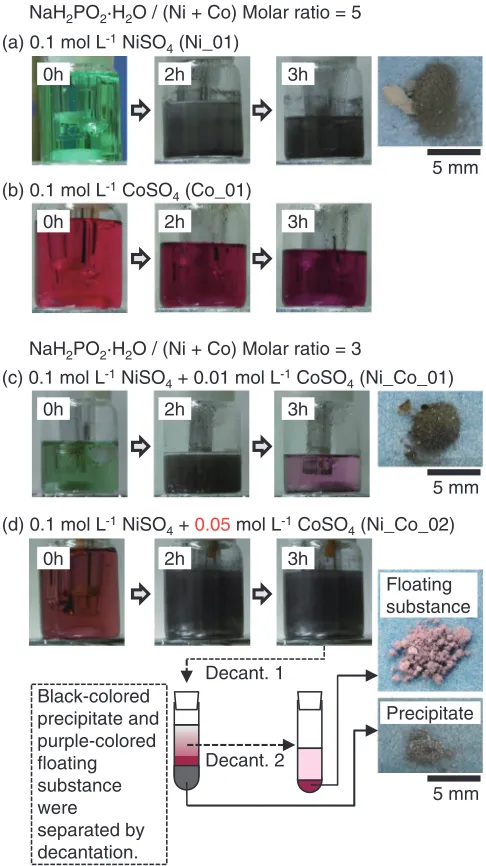
In the experiment using NiSO4 solution, Ni ion was successfully reduced and metal powder was obtained as expected in section 2. The photographs of the solution during the reduction experiments and the precipitates recovered after each experiment are summarized in Fig. 4. In the experiment for NiSO4solution (Ni_01 and Ni_02), Ni ion was reduced by H2P(I)O2¹. In experiment Ni_01, the green color of the solution, which indicated the existence of Ni ion, disappeared during the experiment and the black precipitate was obtained (see Fig. 4(a)). Figure 5 shows the change in pH, oxidation
0 1 2 3 4 5 6 7
-0.9 -0.8 -0.7 -0.6 -0.5 -0.4 -0.3 -0.2 -0.1 0.0
(c) (b) (a)
Fe2+ + 2 e = Fe
(aCo2+ = 0.1)
(aCo2+ = 0.01)
Zn2+ + 2 e = Zn
E
/ V (
vs
S.H.E)
pH Ni2+ + 2 e = Ni
T = 90 °C
aNi2+ = 0.1 aFe2+ = 0.01 aZn2+ = 0.01 pH2 = 1 atm pN2 = 1 atm
aN2H5+ = 1
aH2P(III)O3- / aH2P(I)O2- = 1
(a) 2 H+ + 2 e = H2
(b) N2 + 5 H+ + 4 e = N2H5+
(c) H2P(III)O3- + 2 H+ + 2 e = H2P(I)O2- + H2O
Co2+ + 2 e = Co
[image:2.595.79.262.69.462.2]reduction potential (ORP), and temperature of the solution during the experiment. After the temperature of the solution reached 85°C, ORP dropped to ¹400 mV and black precipitate was observed with intense gas generation. The gas was expected to be H2 gas. The ORP electrode used in the experiment was Pt metallic electrode with internal Ag/ AgCl reference electrode (9300-10D, HORIBA Ltd.). In
order to assure the potential at the point where the reduction reaction occur, an electrode was made by compressing the precipitate, and ORP value was measured referring the Ag/ AgCl reference electrode. The result provided as a reference in Fig. 5 showed similar value to the ORP value in Pt electrode. Considering that the surface of the Pt electrode was covered by Ni-P deposition, the conformance of ORP value makes sense. Thus, the ORP value was regarded to be
¹360 mV to¹400 mV during the reaction. ICP-AES analysis revealed that the concentration of Ni in the sample solution was dramatically decreased from 0.097 mol L¹1 to 5.2© 10¹4mol L¹1 after experiment Ni_01. The obtained black precipitate contained 81 at% Ni and 19 at% P. These results revealed that Ni was reduced to Ni-P alloy by H2P(I)O2¹. In experiment Ni_03, the reaction did not occur at all. The molar ratio of the reductant to Ni ion should be no less than 1.
In order to discuss the conformance with thermodynamics, potential-pH diagram for H3PO4-Ni2+-H2O system at the experimental condition was shown in Fig. 6.5,9,10) The activity of Ni ion was set to be 0.1 mol L¹1, and the activities of other dissolved substances were set to be 0.3 mol L¹1. Considering the pH and ORP during the reduction experi-ment, Ni5P2 is expected to be obtained as a stable phase. However, actual concentration of P in the precipitate obtained after the experiment was 19 at%, which was lower than the
Ar gas inlet Ar gas outlet
pH meter ORP meter
Magnetic stirrer with heating Stirrer bar Sample solution pH probe ORP probe Glass beaker
Silicone rubber
[image:3.595.43.551.105.398.2]Fig. 3 Schematic illustration of experimental apparatus for the reduction experiment.
Table 1 Experimental conditions for the reduction experiment by using NaH2PO2as a reductant; (a) Experiment without impurities, (b) Experiment with
impurities.
(a)
Exp. No.
Reaction Time,
t(h)
Sample solution before experiment Reductant
(NaH2PO2·H2O)
Volume, V/mL
Conc. of buffer,
Cb
(mol L¹1)*1
pH
Conc. of elementi,
Ci(mol L¹1)*2 Weight, wr/g
Reductant/ (Ni+Co) Molar ratio*3
Ni Co
Ni_01 3 100 0.4 4.7 0.097 n.d. 5.299 5.2
Ni_02 3 100 0.4 4.7 0.098 n.d. 3.182 3.1
Ni_03 3 100 0.4 4.7 0.109 n.d. 1.061 0.9
Co_01 3 100 0.4 4.7 n.d. 0.094 5.303 5.3
Ni_Co_01 3 61 0.8 4.8 0.099 0.010 2.151 3.1
Ni_Co_02 3 100 0.8 4.7 0.098 0.048 3.509 2.3
(b)
Exp. No.
Reaction Time,
t(h)
Sample solution before experiment Reductant
(NaH2PO2·H2O)
Volume, V/mL
Conc. of buffer,
Cb
(mol L¹1)*1
pH
Conc. of elementi,Ci(mol L¹1)*2
Weight, wr/g
Reductant/ (Ni+Co) Molar ratio*3
Ni Co Cu Fe Zn
Ni_Co_Cu_1st 3 100 0.8 4.7 0.097 0.009 0.009 n.a. n.a. 3.509 2.9
Ni_Co_Cu_2nd 3 100 0.8 4.7 0.091 0.009 0.008 n.a. n.a. 3.522 3.1
Ni_Co_Fe_1st 5 100 0.8 4.9 0.099 0.009 n.a. 0.009 n.a. 3.538 2.9
Ni_Co_Fe_2nd 3 100 0.8 4.3 0.097 0.009 n.a. 0.009 n.a. 3.506 2.9
Ni_Co_Zn 3 100 0.8 4.7 0.096 0.009 n.a. n.a. 0.004 3.509 3.0
*1pH buffer solution was prepared using CH
3COOH and CH3COONa (CCH3COOH: CCH3COONa¼2 : 3).
Total concentrations of CH3COO¹calculated from the concentrations and volumes of sample materials are shown. *2Determined by ICP-AES analysis (n.d.: not detected, n.a.: not analyzed).
*3Molar amount of NaH
2PO2·H2O was calculated from the weight and molar weight of NaH2PO2·H2O (105.99). Molar amounts of Ni and Co were
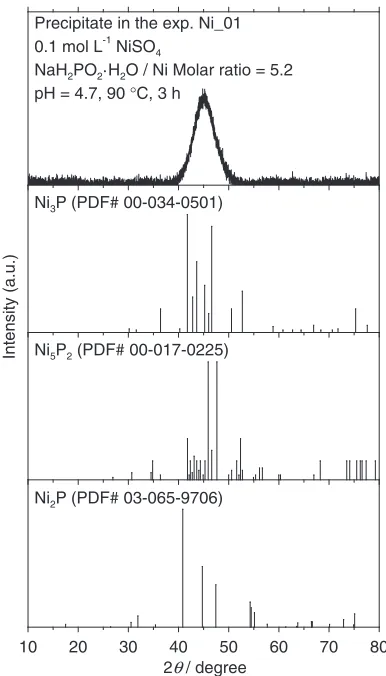
[image:3.595.62.276.477.648.2]concentration of P in stable phase, namely, Ni5P2(28.6 at% P) or Ni3P (25 at% P). Figure 7 shows the XRD pattern for the precipitate obtained after experiment Ni_01 with the reference patterns of Ni-P species appeared in the potential-pH diagram. It had a broad diffraction pattern around 40 degrees, which was typical for amorphous nickel-phosphorus (Ni-P) alloy. From the result of XRD analysis, chemical phase was not determined. Randin et al. have studied electroless plating of Ni in the past and revealed as-plated Ni to be the supersaturated solid solution of P in Ni as a metastable intermediate state.11,12)According to their theory, the precipitation obtained in our experiment was expected to be the metastable state, which did not appear in the potential pH diagram.
In contrast, the results of the experiment for CoSO4 solution (Co_01) suggested that the Co reduction rate was markedly slower than that of Ni. There was no change in the appearance of the solution during the experiment (Fig. 4(b)).
As shown in Fig. 5(b), ORP did not change during the experiment. By adding 0.01 g of Co powder as an initiator, ORP dropped to¹370 mV, but ICP-AES analysis showed no decrease in the concentration of Co in the sample solution at all. Figure 85,9,10) shows the potential-pH diagram for H3PO4-Co2+-H2O system at 90°C with the activity of Co ion set to be 0.01 mol L¹1. The diagram indicates precip-itation of Co as a stable phase. The experimental results suggested that the reduction rate of Co was so slow that Co reduction did not progress even though the ORP was lower than the oxidation-reduction potential of Co. Furthermore, there seemed to be no metastable phase as in the case of Ni. 3.5 4.0 4.5 5.0 pH -500 -400 -300 -200 -100 0 100 200 3 2.5 2 1 1.5 0.5 0
Reaction time, t(h)
T emperature, T / ° C ORP (mV vs S.H.E.) 30 40 50 60 70 80 90 100
ORP (Co_01 with Co powder)
Temperature pH ORP (Co_01) 3.5 4.0 4.5 5.0 pH -500 -400 -300 -200 -100 0 100 200 3 2.5 2 1 1.5 0.5 0
Reaction time, t(h)
T emperature, T / ° C ORP (mV vs S.H.E.) 30 40 50 60 70 80 90 100 Temperature pH ORP (a) 0.1 mol L-1NiSO
4(Ni_01)
NaH2PO2·H2O / (Ni or Co) Molar ratio = 5
(b) 0.1 mol L-1CoSO
4(Co_01)
Ni
Co
0.0 0.5 1.0 1.5
-500 -400 -300 -200 -100 0 100 200
Elapsed time, t(h)
T emperature, T / ° C ORP (mV vs S.H.E.) 30 40 50 60 70 80 90 100 Temperature ORP (Reference)
ORP value during reduction (measured by Ni-P electrode) 0.1 mol L-1NiSO
4, NaH2PO2·H2O / Ni Molar ratio = 3
Fig. 5 Change in ORP, pH and temperature during reduction experiment for (a) 0.1 mol L¹1NiSO
4and (b) 0.1 mol L¹1CoSO4, (Reference) shows
ORP value measured by Ni-P electrode. (a) 0.1 mol L-1NiSO
4(Ni_01)
(b) 0.1 mol L-1CoSO
4(Co_01)
(c) 0.1 mol L-1NiSO
4+ 0.01 mol L-1CoSO4(Ni_Co_01)
(d) 0.1 mol L-1NiSO
4+0.05mol L-1CoSO4(Ni_Co_02)
0h 2h 3h
0h 2h 3h
0h 2h 3h
0h 2h 3h
NaH2PO2·H2O / (Ni + Co) Molar ratio = 5
NaH2PO2·H2O / (Ni + Co) Molar ratio = 3
5 mm 5 mm 5 mm Floating substance Precipitate Black-colored precipitate and purple-colored floating substance were separated by decantation. Decant. 1 Decant. 2
Fig. 4 Photographs of aqueous solution and obtained compounds in the reduction experiment; (a) 0.1 mol L¹1 NiSO
4 (Ni_01), (b) 0.1 mol L¹1
CoSO4 (Co_01), (c) 0.1 mol L¹1NiSO4+0.01 mol L¹1 CoSO4(Ni_Co_
01), (d) 0.1 mol L¹1NiSO
[image:4.595.48.291.70.503.2] [image:4.595.324.512.452.574.2]By utilizing the difference in reduction behavior between Ni and Co, Ni was selectively reduced and Ni-P alloy was obtained in the reduction experiment for 0.1 mol L¹1 NiSO
4 and 0.01 mol L¹1 CoSO
4 mixed solution (Ni_Co_01). As shown in Fig. 4(c), the color of the aqueous solution turned from green, which indicated Ni aqueous ion, into pink, which indicated Co aqueous ion. The XRD pattern of the precipitate showed a broad Ni-P diffraction peak. These results implied that only Ni was reduced and removed from the solution. However, with higher Co concentration, Ni/Co separation became difficult. As shown in Fig. 4(d), purple floating substance was obtained with black precipitates after the experiment for the mixed solution of 0.1 mol L¹1NiSO
4and 0.05 mol L¹1 CoSO
4 (Ni_Co_02). By XRD analysis, the purple floating substance showed unknown diffraction pattern while the black precipitate showed diffraction of amorphous Ni-P alloy. The unknown pattern had the most intense peak identical to that of Co phosphite hydrate (CoHPO3·H2O), but it did not match up with the reported reference patterns related to Co and phosphite ion. From the result of composition analysis by ICP-AES, the precipitate was found to contain relatively high concentration of Co and P (see Table 2).
In order to discuss the efficiency of the selective reduction of Ni, the remaining ratio of element i,Ri, was defined and calculated from the results of ICP-AES analysis.
Ri¼100C0i;l=Ci ð1Þ
Ci: conc. of element i in the sample solution before the experiment.
0 1 2 3 4 5 6 7
-1000 -900 -800 -700 -600 -500 -400 -300 -200 -100 0
-360 mV pH = 4.7
(0)
(+1)
(+3)
(+3)
(+3) (+5)
(+5)
H2PO2
-P (red)
H3PO3
HPO
3
2-H2PO3
-H2PO4
-H3PO4
Ni2P
Ni
5P
2 Ni
3P Ni
Ni(OH)
2
E (mV
vs
S.H.E.)
pH Ni2+ T = 90 °C
a
Ni2+ = 0.1a
H3P(V)O4 =a
H2P(V)O4- =a
HP(V)O4-2 = 0.3a
H3P(III)O3 =a
H2P(III)O3- =a
HP(III)O32- = 0.3a
H3P(I)O2 =a
H2P(I)O2- =a
HP(I)O22- = 0.3Fig. 6 Potential-pH diagram at 90°C for H3PO4-Ni2+-H2O system.
Precipitate in the exp. Ni_01 0.1 mol L-1 NiSO4
NaH2PO2·H2O / Ni Molar ratio = 5.2
pH = 4.7, 90 °C, 3 h
Ni3P (PDF# 00-034-0501)
Ni5P2 (PDF# 00-017-0225)
10 20 30 40 50 60 70 80 2θ / degree
Ni2P (PDF# 03-065-9706)
Intensity (a.u.)
Fig. 7 XRD diffraction pattern of the precipitate obtained after the exp. Ni_01.
0 1 2 3 4 5 6 7
-1000 -900 -800 -700 -600 -500 -400 -300 -200 -100 0
(+1) (0)
(+3) (+3)
(+3) (+5)
(+5)
HPO3
2-P (red)
H3PO3
H2PO3
-H2PO4
-H3PO4
CoP3
CoP Co Co2+
Co(OH)
2
pH
Co2P T = 90 °C
a
Co2+ = 0.01a
H3P(V)O4 =a
H2P(V)O4- =a
HP(V)O42- = 0.3a
H3P(III)O3 =a
H2P(III)O3- =a
HP(III)O32- = 0.3a
H3P(I)O2 =a
H2P(I)O2- =a
HP(I)O22- = 0.3pH = 4.7
-360 mV
H2PO2
-E (mV
vs
S.H.E.)
[image:5.595.320.533.67.389.2] [image:5.595.61.276.68.389.2] [image:5.595.72.265.422.760.2]CAi,l: conc. of element i in the sample solution after the experiment.
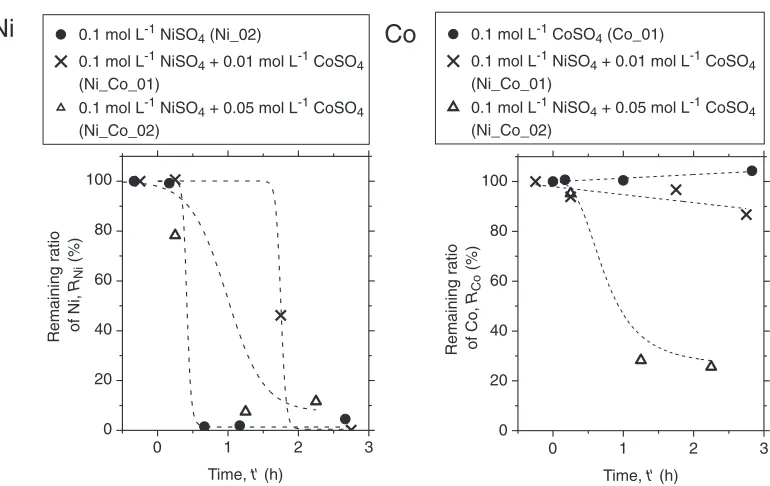
All results are summarized in Table 2, and Fig. 9 shows the change in the remaining ratio of element i,Ri, during the reduction experiment. The horizontal axis is the elapsed time since the temperature of the sample solution reached 85°C. In the experiment for the mixed solution of 0.1 mol L¹1NiSO
4
and 0.01 mol L¹1CoSO4(Ni_Co_01, plotted by cross (©) in Fig. 9), the concentration of Ni dramatically decreased to 0.1% of the initial concentration while Co remained in the sample solution at over 80%. In the Ni-P alloy obtained after Ni_Co_01, the atomic ratio of Co to Ni was 1.6% (see Table 2). This value is 1/6 of the concentration ratio in the initial aqueous solution. Consequently, Ni was successfully recovered from acidic aqueous solution by selective reduc-Table 2 Results of composition analysis of the samples obtained after reduction experiments.
Exp. No.
pH before
exp.
Sample solution
after experiment (l) Compounds obtained after experiment (s)
pH
Conc. of elementi, CAi,l(mol L¹1)*1
Remaining ratio of elementi,
Ri(%)*2
configuration XRD phase
Conc. of elementi, CAi,s(at%)*1
Co/Ni atomic ratio (%)
Ni Co Ni Co Ni Co P
Ni_01 4.7 4.0 5.2©10¹4 n.d. 0.5 n.a. (precipitate)
black powder Ni-P 81.2 n.a. 18.7 0
Ni_02 4.7 4.1 4.5©10¹3 n.d. 4.6 n.a. (precipitate)
black powder Ni-P 82.7 n.a. 17.2 0
Ni_03 4.7 4.9 1.1©10¹2 n.d. 97 n.a. No compound obtained
Co_01 4.7 4.8 n.d. 0.099 n.a. 104 No compound obtained
Ni_Co_01 4.8 4.5 1.2©10¹4 0.009 0.1 87 (precipitate)
black powder Ni-P 82.6 0.75 16.6 0.9
Ni_Co_02 4.7 4.5 1.2©10¹2 0.005 12.2 10.4
(floating substance) purple powder
unknown*3 19.5 20.50 17.4 105
(precipitate) black powder
Ni-P,
unknown*3 72.9 06.43 11.3 8.8 *1Determined by ICP-AES analysis (n.d.: not detected, n.a.: not analyzed).
*2R
i=100©CAi,l/Ci(whereCiis conc. of elementiin the sample solution before exp., andCAi,lis conc. of elementiin the sample solution after exp.). *3The unknown pattern had the most intense peak identical to that of CoHPO
3·H2O.
0 1 2 3
0 20 40 60 80 100
Remaining ratio of Ni, RNi
(%)
Time, t' (h)
0.1 mol L-1 NiSO4 (Ni_02)
0.1 mol L-1 NiSO4 + 0.01 mol L-1 CoSO4
(Ni_Co_01)
0.1 mol L-1 NiSO4 + 0.05 mol L-1 CoSO4
(Ni_Co_02)
0 1 2 3
0 20 40 60 80 100
Remaining ratio of Co, RCo
(%)
Time, t' (h)
0.1 mol L-1 CoSO4 (Co_01)
0.1 mol L-1 NiSO4 + 0.01 mol L-1 CoSO4
(Ni_Co_01)
0.1 mol L-1 NiSO4 + 0.05 mol L-1 CoSO4
(Ni_Co_02)
NaH2PO2·H2O / (Ni + Co) Molar ratio = 3
T= 90 °C
t’: elapsed time since Treached 85 °C.
Ni
Co
[image:6.595.47.551.85.319.2] [image:6.595.108.493.402.645.2]tion. With 0.05 mol L¹1 CoSO
4 (Ni_Co_02, plotted by triangle ( ) in Fig. 9), the concentration of Co also decreased because of the precipitation of the purple floating substance containing Co and P.
The experimental results revealed that there was a difference in the reduction rate between Ni and Co in acidic solution and this difference resulted in the selective reduction of Ni. In the experiment for the mixed solution (Ni_Co_01), reduction of some Co ions was also observed from the composition analysis of the precipitate. The reason for this might be in the Ni-P fine powder produced during the experiment. From the SEM observation, this powder was very small at 1 micrometer in diameter, so it could exhibit catalytic activity for Co reduction with increase of solid-liquid interface area.
4.2 Effect of impurities on the reduction behavior Some interesting effects were observed in the reduction experiment in the solution containing impurities. Figure 10 shows photographs of the solution during the reduction experiments and the precipitates recovered after each experiment. In the experiment for the solution containing Cu2+ as an impurity, the color of the solution changed in the similar way as in the experiment without impurities (Fig. 10(a)). In contrast, in the experiment containing Fe3+ or Zn2+, the green color of the solution remained even after the reaction for 3 hours (Fig. 10(b) and (c)).
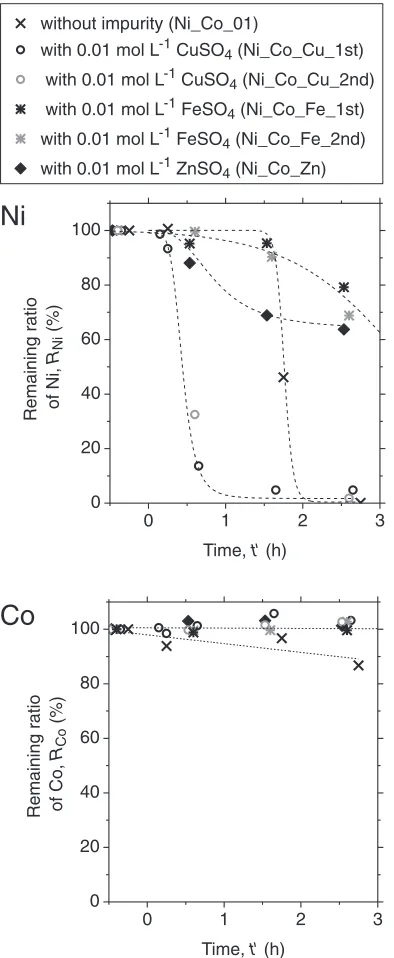
Detailed results of composition analysis are summarized in Table 3, and the changes in the remaining ratio of Ni and Co are shown in Fig. 11. After the experiment with 0.01 mol L¹1 CuSO4 (Ni_Co_Cu_1st & 2nd), Cu and Ni were selectively reduced and separated from Co (see Table 3(a)). In the precipitate obtained after the experiment, Cu metal phase was observed with Ni-P alloy by XRD analysis (see Table 3(b)).
[image:7.595.47.519.106.331.2]Change in the remaining ratio (plotted by circle ( ) in Fig. 11) revealed that the Ni reduction began much earlier than in the experiment without Cu (plotted by cross (©) in Fig. 11). This was because the noble Cu precipitated first due to the large driving force for the reduction (standard oxidation reduction potential of Cu is+339 mV vs. S.H.E. at Table 3 Experimental results for the reduction experiment using NaH2PO2as a reductant; (a) Results of concentration analysis of the sample solutions after
reduction experiments with impurities, (b) Results of composition analysis of the compounds obtained after reduction experiments with impurities.
(a)
Exp. No.
pH before
exp. pH after exp.
Conc. of elementiin the solution after exp.,CAi,l(mol L¹1)
Remaining ratio of elementi in the solution after exp.,Ri(%)*2
Ni Co Cu Fe Zn Ni Co Cu Fe Zn
Ni_Co_Cu_1st 4.7 4.3 4.6©10¹3 0.009 9.9©10¹6 n.a. n.a. 4.7 103 0.1 ® ®
Ni_Co_Cu_2nd 4.7 4.4 2.0©10¹3 0.009 7.9©10¹6 n.a. n.a. 2.1 100 0.1 ® ®
Ni_Co_Fe_1st 4.9 4.9 4.0©10¹2 0.009 n.a. 0.009 n.a. 48 102 ® 99 ®
Ni_Co_Fe_2nd 4.7 4.5 6.7©10¹2 0.010 n.a. 0.009 n.a. 69 103 ® 102 ®
Ni_Co_Zn 4.7 4.5 6.1©10¹2 0.009 n.a. n.a. 0.004 64 101 ® ® 96
(b)
Exp. No. XRD phase
Conc. of elementiin the compounds obtained after exp.,CAi,s(at%)*1
Ni Co Cu Fe Zn P
Ni_Co_Cu_1st Ni-P+Cu 76.2 0.31 8.45 n.a. n.a. 14.9
Ni_Co_Cu_2nd Ni-P+Cu 78.7 0.26 7.02 n.a. n.a. 13.9
Ni_Co_Fe_1st Ni-P 84.1 0.13 n.a. 0.12 n.a. 15.6
Ni_Co_Fe_2nd Ni-P 84.1 0.22 n.a. 0.19 n.a. 15.5
Ni_Co_Zn Ni-P 83.8 0.16 n.a. n.a. 0.07 15.8
*1Determined by ICP-AES analysis (n.a.: not analyzed). *2R
i=100©CAi,l/Ci
(whereCiis conc. of elementiin the sample solution before exp., andCAi,lis conc. of elementiin the sample solution after exp.).
(a) with 0.01 mol L-1CuSO
4(Ni_Co_Cu_2nd)
(b) with 0.01 mol L-1FeSO
4(Ni_Co_Fe_1st)
(c) with 0.01 mol L-1ZnSO
4(Ni_Co_Zn)
0h 2h 3h
0h 2h 3h
0h 2h 3h
[image:7.595.306.548.380.646.2]NaH2PO2·H2O / (Ni + Co) Molar ratio = 3
Fig. 10 Photographs of aqueous solution during the reduction experiment with impurities; (a) with 0.01 mol L¹1CuSO
4(Ni_Co_Cu_2nd), (b) with
0.01 mol L¹1 FeSO
4 (Ni_Co_Fe_1st), (c) with 0.01 mol L¹1 ZnSO4
90°C), and the Cu metal acted as an initiator for the reduction of Ni. In contrast, Fe3+and Zn2+were considered to decrease the reduction rate of Ni. With Fe3+ and Zn2+, the Ni concentration did not decrease to the same extent as in the experiment without these impurities (see Fig. 11). In the case of Fe3+, the consumption of reductant by reduction of Fe3+to Fe2+ was a possible reason for the decrease in Ni reduction rate. However, this is quite unlikely because the initial concentration of Fe3+ was 1/10 that of Ni. At this point, we believed that Fe3+ and Zn2+ had some influence on the reduction reaction of Ni ion.
5. Conclusions
In this study, selective reduction of Ni in acidic aqueous solution was experimentally investigated in order to propose an alternative process for the separation of Ni and Co. As a result, selective reduction of Ni was successfully demon-strated by using NaH2PO2as a reductant. ORP value of the sample solution during the experiment suggested that the selective reduction of Ni was due to the differences in the reduction rate between Ni and Co in the acidic aqueous solution. The efficiency of Ni/Co separation is affected by initial Co concentration because of the precipitation of a compound containing high concentration of Co and P. Experimental results also revealed that the coexistence of Fe3+or Zn2+ decreases the reduction rate of Ni.
The proposed process enables us to reduce chemicals in the Ni production process. Furthermore, it does not need specific facilities such as an autoclave because reduction is conducted under ambient pressure. In terms of the product, Ni reduction in aqueous solution has the potential to give powdery Ni, which can easily be dissolved and suitable for the use in industry like plating. However, in order to prevent phosphorus (P) contamination of the product, another reductant needs to be found. Reduction using metal redox pair is the examples of possible candidates that can accomplish more environmentally-sound process. In order to control these reactions, mechanism of the reduction accompanied by kinetic differences should be understood.
Acknowledgments
The authors are grateful to Prof. Y. Awakura (currently professor emeritus) at Kyoto University for his valuable discussions. Grateful thanks also go to Prof. Y. Umetsu (currently professor emeritus) at Tohoku University for providing informative materials and for valuable discussions.
REFERENCES
1) A. R. Burkin:Extractive Metallurgy of Nickel, (John Wiley & Sons, New York, 1987) pp. 6373.
2) J. R. Boldt, Jr. and P. Queneau:The Winning of Nickel, (Longmans Canada Ltd., Toronto, 1967) pp. 290386.
3) J. R. Boldt, Jr. and P. Queneau:The Winning of Nickel, (Longmans Canada Ltd., Toronto, 1967) pp. 425454.
4) N. Tsuchida:J. MMIJ124(2008) 549553.
5) D. D. Wagman, W. H. Evans, V. B. Parker, R. H. Schumm, I. Halow, S. M. Bailey, K. L. Churney and R. L. Nuttall:The NBS Tables of Chemical Thermodynamic Properties (Selected Values for Inorganic and C1 and C2 Organic Substances in SI Units), (J. Physical and Chemical Reference Data, 11, 1982) Supp. No. 2.
6) A. Brenner and G. Riddell: J. Res. NBS39(1947) 385395. 7) R. A. Wajszczuk and W. A. Charewicz:Hydrometallurgy35(1994)
99108.
8) T. Saarinen, L. Lindfors and S. Fugleberg:Hydrometallurgy47(1998)
309324.
9) M. Pourbaix:Atlas of Electrochemical Equilibria in Aqueous Solutions, (Pergamon Press, Oxford, 1966).
10) I. Barin: Thermochemical Data of Pure Substances (Third Edition), (VCH Publishers, Inc., New York, 1995).
11) J.-P. Randin, P. A. Maire, E. Saurer and H. E. Hintermann:
J. Electrochem. Soc.114(1967) 442445.
12) J.-P. Randin and H. E. Hintermann:J. Electrochem. Soc.115(1968)
480484.
0 1 2 3
0 20 40 60 80 100
Remaining ratio of Ni,
RNi
(%)
Time, t' (h) without impurity (Ni_Co_01)
with 0.01 mol L-1 CuSO4 (Ni_Co_Cu_1st)
with 0.01 mol L-1 CuSO4 (Ni_Co_Cu_2nd)
with 0.01 mol L-1 FeSO4 (Ni_Co_Fe_1st)
with 0.01 mol L-1 FeSO4 (Ni_Co_Fe_2nd)
with 0.01 mol L-1 ZnSO4 (Ni_Co_Zn)
0 1 2 3
0 20 40 60 80 100
Remaining ratio of Co,
RCo
(%)
Time, t' (h) 0.1 mol L-1NiSO
4+ 0.01 mol L-1CoSO4 NaH2PO2·H2O / (Ni + Co) Molar ratio = 3 T= 90 °C
t’: elapsed time since Treached 85 °C.