ISSN Online: 2327-5227 ISSN Print: 2327-5219
DOI: 10.4236/jcc.2018.64005 Apr. 26, 2018 53 Journal of Computer and Communications
A Perceptual Video Coding Based on JND Model
Qingming Yi, Wenhui Fan, Min Shi
College of Information Science and Technology, Jinan University, Guangdong, China
Abstract
In view of the fact that the current high efficiency video coding standard does not consider the characteristics of human vision, this paper proposes a per-ceptual video coding algorithm based on the just noticeable distortion model (JND). The adjusted JND model is combined into the transformation quanti-zation process in high efficiency video coding (HEVC) to remove more visual redundancy and maintain compatibility. First of all, we design the JND model based on pixel domain and transform domain respectively, and the pixel do-main model can give the JND threshold more intuitively on the pixel. The transform domain model introduces the contrast sensitive function into the model, making the threshold estimation more precise. Secondly, the proposed JND model is embedded in the HEVC video coding framework. For the transformation skip mode (TSM) in HEVC, we adopt the existing pixel do-main called nonlinear additively model (NAMM). For the non-transformation skip mode (non-TSM) in HEVC, we use transform domain JND model to further reduce visual redundancy. The simulation results show that in the case of the same visual subjective quality, the algorithm can save more bitrates.
Keywords
High Efficiency Video Coding, Just Noticeable Distortion, Nonlinear Additively Model, Contrast Sensitivity Function
1. Introduction
Nowadays, high definition video is becoming more and more popular. However, the growth of storage capacity and network bandwidth cannot meet the de-mands for high resolution for storage and transmission. Therefore, ITU-T and ISO/IEC worked together to release a new generation of efficient video coding standard—HEVC [1]. HEVC still follows the traditional hybrid coding frame-work and uses statistical correlation to remove space and time redundancy in order to achieve the highest possible compression effect. However, as the
ulti-How to cite this paper: Yi, Q.M., Fan, W.H. and Shi, M. (2018) A Perceptual Video Coding Based on JND Model. Jour-nal of Computer and Communications, 6, 53-64.
https://doi.org/10.4236/jcc.2018.64005
Received: March 27, 2018 Accepted: April 23, 2018 Published: April 26, 2018
Copyright © 2018 by authors and Scientific Research Publishing Inc. This work is licensed under the Creative Commons Attribution International License (CC BY 4.0).
DOI: 10.4236/jcc.2018.64005 54 Journal of Computer and Communications
mate receiver of video, Human Visual System [2] has some visual redundancy due to its own characteristics. In order to get the perceptual redundancy, re-searchers have done a lot of work, of which the widely accepted model is the just noticeable distortion model. Video encoding based on perceptible distortion is mainly to use the human eye’s visual masking mechanism. When the distortion is less than the human sensitivity threshold, the human eye is imperceptible [3]. In recent years, the JND model has received wide attention in the aspects of video image encoding [4] [5], digital watermarking [6], image quality evaluation
[7] and so on. At present, several JND models have been proposed: the JND model based on pixel domain and the JND model based on transform domain.
For the JND model based on pixel domain, it usually considers two main fac-tors including luminance adaptive masking and contrast masking effect. C. H. Chou and Y. C. Li [8] proposed the pixel domain JND model for the first time. The lager one of the calculated luminance adaptive masking value and contrast masking effect value was used as the final JND threshold. Yang [9] and others proposed the classical nonlinear additively masking model. The two kinds of masking effects were added together to get the corresponding JND values. To some extent, the interaction between the two masking effects was considered. To solve the problem of lack of precision in the calculation of the contrast masking value for the above methods, Liu [10] assigned different weights to texture re-gion and edge rere-gion in the image through texture decomposition on the basis of NAMM model, which made the JND model have better calculation accuracy. Wu [11] proposed a JND model based on luminance adaptive and structural si-milarity, which further considered the sensitivity of human eyes to different reg-ular and irregreg-ular regions when computing texture masking.
The JND model based on transform domain could easily introduce the con-trast sensitivity function into the model with high accuracy. Since most image coding standards adopt DCT transform, the JND model based on DCT domain has attracted much attention of researchers. Ahumada et al.[12] obtained a JND model of a grayscale image by calculating the spatial CSF function. Based on this, Waston [13] proposed the DCTune method, further considering the fea-tures of luminance adaptation and contrast masking. Zhang [14] made the JND model more accurate by adding a luminance adaptive factor and a contrast masking factor. Wei et al.[15] introduced gamma correction to the JND model and proposed a more accurate video image JND model.
2. Nonlinear Additively Masking Model
The NAMM model is simulated in pixel domain from the aspects of luminance adaptation and texture masking to obtain the JND threshold of pixel domain. The JND estimation based on the pixel domain can be written as the nonlinear additively of the luminance adaptation and the contrast masking, as shown in Equation (1):
( )
( )
( )
{
( ) ( )
}
pixel
DOI: 10.4236/jcc.2018.64005 55 Journal of Computer and Communications
where, Tl
( )
x y, and Tt( )
x y, denote the basic threshold of adaptiveback-ground luminance and texture masking; Clt represents the overlapping part of
two kinds of effects, and it is used to adjust the two factors. The larger the Clt
value is, the stronger superposition between the adaptive background luminance and texture masking is. When Clt is 1, the superposition effect between the two
factors is the greatest; when Clt is 0, there is no superposition effect between the
[image:3.595.222.520.547.707.2]two effects. In fact, the superposition is between the maximum and the mini-mum, where Clt is equal to 0.3.
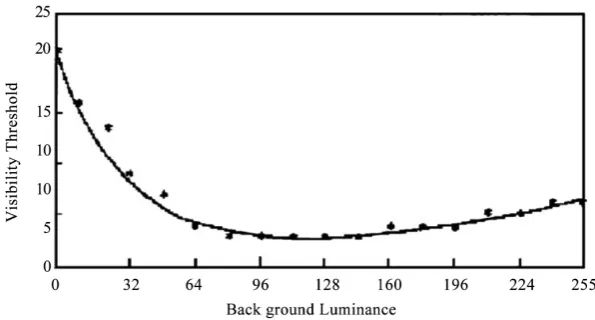
Figure 1 shows the curve of the background luminance and the visual thre-shold obtained from the experimental results. It simulates the background lu-minance model and shows the distortion threshold that the human eye can tole-rate under a certain background luminance.
( )
,l
T x y can be determined according to the visual threshold curve in Figure 1.
( )
( )
( )
( )
(
)
,
17 1 3 , , 127
127 ,
3
, 127 3, others
128
Y
Y l
Y
I x y
I x y
T x y
I x y
− + ≤
=
− +
(2)
where IY
(
x y,)
is the average background luminance value.Due to the characteristics of HVS itself, distortion that occurs in plain and edge areas is more noticeable than texture areas. In order to estimate the JND threshold more accurately, it is necessary to distinguish the edge and non-edge regions. Therefore, considering the edge information, the calculation method of the texture masking threshold t
( )
,T x y is:
( )
,( ) ( )
, ,t
T x y =βGθ x y Wθ x y (3)
where β is the control parameter and its value is set as 0.117. Gθ
( )
x y, donatesthe maximal weighted average of gradients around the pixel at (x, y); Wθ
( )
x y,is an edge-related weights of the pixel at (x, y), and its corresponding matrix Wθ
is detected by the Gaussian low-pass filter.
DOI: 10.4236/jcc.2018.64005 56 Journal of Computer and Communications
( )
,Gθ x y is defined as:
( )
{
,( )
}
1,2,3,4
, max k ,
k
Gθ x y gradθ x y
=
= (4)
with
( )
(
)
( )
,
5 5
1 1
3 , 3 ,
1 ,
16
k k
i j
I x i
gradθ x y θ y j g i j
= =
=
∑∑
− + − + × (5)where, gk
( )
i j, are four directional high-pass filters for texture detection, asshown in Figure 2.
3. Improved JND Model Based on DCT Domain
A typical JND model based on DCT domain is expressed as a product of a base threshold and some modulation factors. Assume that t is expressed as the frame index in the video sequence, n is the block index in the tth frame, and (i, j) is the DCT coefficient index. Then the corresponding JND threshold can be expressed as:
(
)
(
)
( )
(
)
DCT Lum Contrast
JND n i j t, , , =T n i j t, , , ×a n t, ×a n i j t, , , (6)
where T n i j t
(
, , ,)
is the spatial-temporal base distortion threshold, which iscalculated from the spatial-temporal contrast sensitivity function; aLum
( )
n t,denotes the luminance adaptation factor; aContrast
(
n i j t, , ,)
is expressed as acon-trast masking factor.
3.1. Spatial-Temporal Contrast Sensitivity Function
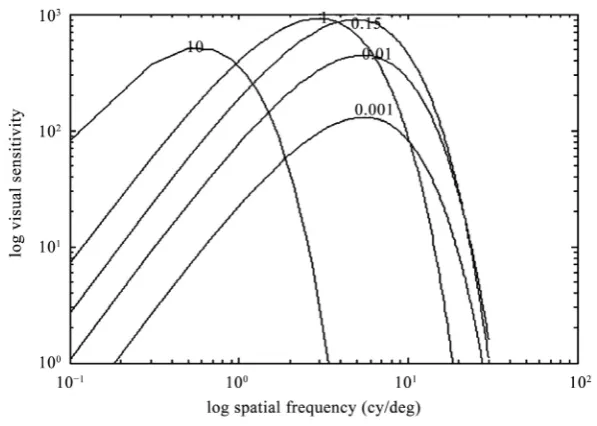
In psychophysics experiments, the visual sensitivity of the human eye is re-lated to the spatial frequency and time frequency of the input signal. The contrast sensitive function is usually used to quantify the relationship be-tween these factors. It is defined as the inverse of the distortion perceived by human eye, when the contrast changes. The spatial-temporal contrast sensi-tivity function curve is shown in Figure 3. If we consider the (i, j) th in the nth DCT block in the tth frame, then the corresponding CSF function can be written as:
(
)
(
(
( )
)
)
( )
(
)
( )
(
)
(
)
3 2
0 1 2 .
. 1 3
, , , log , 3 , 2π
exp 2π , 2
i j
i j
G n i j t c k k n t n t
c n t k
ε ν ν ρ
ρ ε ν
= + ⋅ ⋅ ⋅
⋅ − ⋅ ⋅ ⋅ + (7)
where ν
( )
n t, depicts the associated retinal image velocity; the empiricalconstant k1,k2 and k3 are set as 6.1, 7.3 and 23. c0 and c1 control the
magnitude and the bandwidth of a CSF curve; ρi j. is the spatial subband
frequency:
(
)
2( )
2 .1
2
i j i x j y
N
ρ = ϖ + ϖ (8)
where, ϖx and ϖy are the horizontal and vertical sizes of a pixel in degrees
DOI: 10.4236/jcc.2018.64005 57 Journal of Computer and Communications
[image:5.595.208.537.72.167.2](a) (b) (c) (d)
Figure 2.Directional high-pass filters for texture detection.
Figure 3. Spatial CSF at different retinal velocities.
2 arctan , ,
2
h
h h x y
l
ϖ = ⋅ Λ =
⋅
(9)
when Equation (7) is used for predicting distortion threshold due to spa-tial-temporal CSF, several factors needs to be considered: 1) the sensitivity modeled by Equation (7) represents the inverse of distortion threshold; 2) the CSF threshold represented in the luminance needs to be scaled into the gray levels for digital image; 3) since Equation (7) comes from experimental data of one-dimensional spatial frequency, for any subband, the threshold is ac-tually higher than the one given by Equation (7), and therefore a compensat-ing needs to be introduced for a DCT sub-band. With all consideration men-tioned above, the base threshold for a DCT sub-band is determined as:
(
)
(
)
(
)
(
)
2max min ,
1 1
, , ,
, , , i j 1 cos i j
M T n i j t
G n i j t L L r r θ
= × ×
Φ Φ − + − (10)
where, Lmax and Lmin represent the display luminance values
correspond-ing to the maximum and minimum gray levels, respectively; M is the number of gray levels, which is generally valued at 256; Φi and Φj belong to the
DCT normalization factor; θi j, accounts for the effect of an arbitrary
[image:5.595.223.522.195.408.2]DOI: 10.4236/jcc.2018.64005 58 Journal of Computer and Communications
3.2. Luminance Adaptive Factor and Contrast Masking Factor
The luminance masking mechanism is related to the brightness change in the image. According to Weber-Fechner’s law, the minimum perceptible luminance of human eye shows a higher threshold in the areas with brighter or darker background brightness, which is called luminance adaptive effect. The calcula-tion formula of the luminance adaptive factor is:
( )
(
)
(
)
Lum
60 150 1, 60
, 1, 60 170
170 425 1, 170
I I
a n t I
I I − + ≤ = − + ≥
(11)
where I represents the average brightness.
The contrast masking effect is an important perceptual property in the HVS, usually related to the awareness of a signal in the presence of another signal. When the contrast sensitivity factor is calculated, the image is first detected by Canny edge, and the image blocks are divided into three types: plain, edge and texture region. Since the human eye is more sensitive to distortions that occur in plain areas and in edge areas, different weights need to be assigned to different areas. Based on the above considerations, the weighted factor for each classifica-tion block is determined by the following equaclassifica-tion:
(
)
(
)
2 2
2 2
in texture region a 1, in plain and edge region
2.25,
1.
nd 16
in texture regi
25, on and 16
i j i j ψ = + ≤ + > (12)
where i and j are the DCT coefficient indices.
Taking the masking effect in the intra frame into account, the final contrast masking factor is:
(
)
(
)
(
)
(
)
( )
2 2 0.36 contrast Lum, in plain and edge region 16
, , , , , ,
min 4, max 1, , others
, , , ,
i j
a n i j t C n i j t
T n i j t a n t
ψ ψ + ≤ = ⋅ ⋅ (13)
4. Simulation Results
4.1. Evaluation of the Improved JND Model Based on Transform
Domain
DOI: 10.4236/jcc.2018.64005 59 Journal of Computer and Communications
(a) (b) (c) (d)
[image:7.595.211.532.64.214.2](e) (f) (g) (h)
Figure 4. Eight test images. (a) Bikes; (b) Buildings; (c) Caps; (d) House; (e) Monarch; (f) Painted house; (g) Sailing 1; (h) Sailing 4.
(
)
(
)
random(
)
noise , , , , , , n i j, , JND , , ,
C n i j t =C n i j t +M ⋅ n i j t (14)
where, C n i j t
(
, , ,)
and Cnoise(
n i j t, , ,)
represent DCT coefficients and DCTcoefficients after noise injection; random , ,
n i j
M random takes +1 and −1.
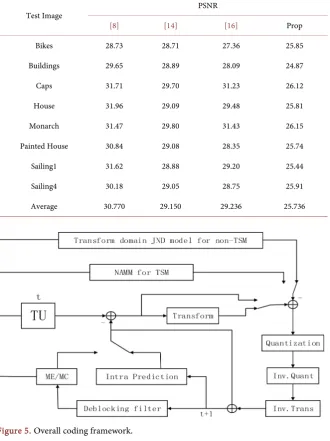
The JND model presented in this paper is compared with the three models shown in Table 1 respectively. As can be seen from the table, the PSNR meas-ured by this model is the smallest. Under the same visual quality, the smaller the PSNR value of the image is, the greater the energy is introduced into the noise and the larger the corresponding JND threshold is. This means that the larger JND threshold obtained by this model can tolerate more distortion, and the ac-curacy of the model has been further improved.
4.2. The Overall Performance of the Perceptual Video Coding
Scheme
In order to make full use of the JND characteristics of the human visual sys-tem to reduce the perceived redundancy of the input video, we integrated the designed JND model into the HEVC coding framework. For the transform skip mode, we chose the existing pixel domain JND model; and the proposed JND model based on DCT domain is utilized for the transform non-skip mode. Figure 5 shows the overall framework of the perceptual video coding scheme.
DOI: 10.4236/jcc.2018.64005 60 Journal of Computer and Communications
Table 1. PSNR between different models.
Test Image PSNR
[8] [14] [16] Prop
Bikes 28.73 28.71 27.36 25.85
Buildings 29.65 28.89 28.09 24.87
Caps 31.71 29.70 31.23 26.12
House 31.96 29.09 29.48 25.81
Monarch 31.47 29.80 31.43 26.15
Painted House 30.84 29.08 28.35 25.74
Sailing1 31.62 28.88 29.20 25.44
Sailing4 30.18 29.05 28.75 25.91
[image:8.595.210.541.94.536.2]Average 30.770 29.150 29.236 25.736
Figure 5. Overall coding framework.
Pro ref
Pro
Bitrate Bitrate
Bitrate 100%
Bitrate −
∆ = × (15)
Pro ref
Pro
Time Time
Time 100%
Time −
∆ = × (16)
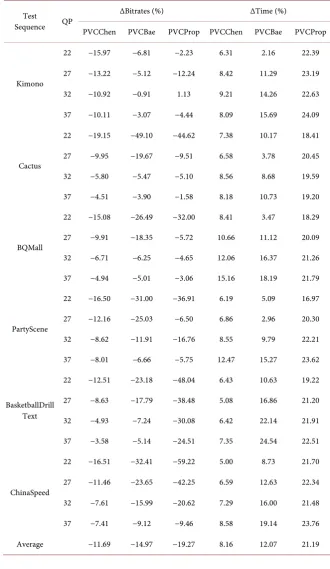
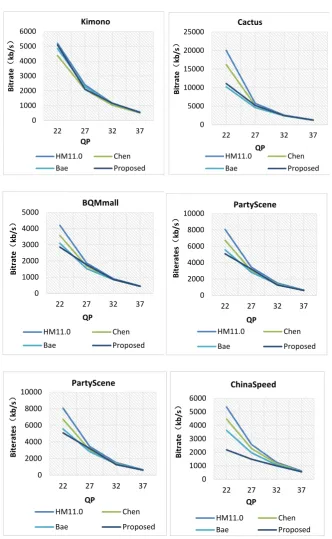
Table 2 shows the comparison of the performance of the proposed algorithm and Chen’s [17] and Bae’s [4] schemes under different quantization parameters. The experimental results show that compared with the algorithm of [4], the al-gorithm reduces the encoding bit rate by 4.3%, compared with Chen’s alal-gorithm, the encoding bit rate decreases by up to 7.58%.
In order to more intuitively show the bitrate reduction of each algorithm,
ob-DOI: 10.4236/jcc.2018.64005 61 Journal of Computer and Communications
[image:9.595.206.537.164.734.2]served that compared with other method, more bit saving can be obtained by our method in most cases. It also can be seen that the smaller the QP value is, the more bits are reduced. This is because finer quantification will result in a larger JND threshold.
Table 2. Comparison of the performance of each program.
Test
Sequence QP
∆Bitrates (%) ∆Time (%)
PVCChen PVCBae PVCProp PVCChen PVCBae PVCProp
Kimono
22 −15.97 −6.81 −2.23 6.31 2.16 22.39
27 −13.22 −5.12 −12.24 8.42 11.29 23.19
32 −10.92 −0.91 1.13 9.21 14.26 22.63
37 −10.11 −3.07 −4.44 8.09 15.69 24.09
Cactus
22 −19.15 −49.10 −44.62 7.38 10.17 18.41
27 −9.95 −19.67 −9.51 6.58 3.78 20.45
32 −5.80 −5.47 −5.10 8.56 8.68 19.59
37 −4.51 −3.90 −1.58 8.18 10.73 19.20
BQMall
22 −15.08 −26.49 −32.00 8.41 3.47 18.29
27 −9.91 −18.35 −5.72 10.66 11.12 20.09
32 −6.71 −6.25 −4.65 12.06 16.37 21.26
37 −4.94 −5.01 −3.06 15.16 18.19 21.79
PartyScene
22 −16.50 −31.00 −36.91 6.19 5.09 16.97
27 −12.16 −25.03 −6.50 6.86 2.96 20.30
32 −8.62 −11.91 −16.76 8.55 9.79 22.21
37 −8.01 −6.66 −5.75 12.47 15.27 23.62
BasketballDrill Text
22 −12.51 −23.18 −48.04 6.43 10.63 19.22
27 −8.63 −17.79 −38.48 5.08 16.86 21.20
32 −4.93 −7.24 −30.08 6.42 22.14 21.91
37 −3.58 −5.14 −24.51 7.35 24.54 22.51
ChinaSpeed
22 −16.51 −32.41 −59.22 5.00 8.73 21.70
27 −11.46 −23.65 −42.25 6.59 12.63 22.34
32 −7.61 −15.99 −20.62 7.29 16.00 21.48
37 −7.41 −9.12 −9.46 8.58 19.14 23.76
DOI: 10.4236/jcc.2018.64005 62 Journal of Computer and Communications
Figure 6. Comparisons of the bitrates.
Acknowledgements
In this paper, we introduce JND model based on pixel domain and JND model based on DCT domain into HEVC framework. Both models have their own ad-vantages: the JND model based on pixel domain can directly give the JND thre-shold in the pixel domain, and the calculation is easier. The JND model based on the DCT domain integrates the CSF function and the estimated value is more
0 1000 2000 3000 4000 5000 6000
22 27 32 37
Bi tr ate ( kb /s ) QP Kimono HM11.0 Chen Bae Proposed 0 5000 10000 15000 20000 25000
22 27 32 37
Bi tr ate ( kb /s ) QP Cactus HM11.0 Chen Bae Proposed 0 1000 2000 3000 4000 5000
22 27 32 37
Bi tr ate ( kb /s ) QP BQMmall HM11.0 Chen Bae Proposed 0 2000 4000 6000 8000 10000
22 27 32 37
Bi te ra te s ( kb /s ) QP PartyScene HM11.0 Chen Bae Proposed 0 2000 4000 6000 8000 10000
22 27 32 37
Bi te ra te s ( kb /s ) QP PartyScene HM11.0 Chen Bae Proposed 0 1000 2000 3000 4000 5000 6000
22 27 32 37
DOI: 10.4236/jcc.2018.64005 63 Journal of Computer and Communications
accurate. Based on the above analysis and combining the advantages of the two models, we choose the pixel domain JND model for the transform skip mode, and choose the more accurate DCT domain JND for the transform non-skip mode. Simulation experimental results show that compared with other models, this algorithm can save up to 7.58% of the coding rate.
References
[1] Sullivan, G.J., Ohm, J., Han, W.J. and Wiegand, T. (2012) Overview of the High Ef-ficiency Video Coding (HEVC) Standard. IEEE Transaction on Circuits & Systems for Video Technology, 21, 1649-1668.
https://doi.org/10.1109/TCSVT.2012.2221191
[2] Wu, H.R. and Rao, K.P. (2005) Digital Video Image Quality and Perceptual Coding. CRC Press, Boca Raton, FL, USA. https://doi.org/10.1201/9781420027822
[3] Jayant, N., Johnston, J. and Safranek, R. (1993) Signal Compression Based on Mod-els of Human Perception. Proceedings of theIEEE, 81, 1385-1422.
https://doi.org/10.1109/5.241504
[4] Kim, J., Bae, S.H. and Kim, M. (2015) An HEVC-Compliant Perceptual Video Coding Scheme Based on JND Models for Variable Block-Sized Transform Kernels.
IEEE Transactions on Circuits and Systems for Video Technology, 25, 1786-1800.
https://doi.org/10.1109/TCSVT.2015.2389491
[5] Ki, S., Bae, S.H., Kim, M. and Ko, H. (2018) Learning-Based Just Noticeable Quan-tization Distortion Modeling for Perceptual Video Coding. IEEE Transactions on Image Processing, 27, 3178-3193. https://doi.org/10.1109/TIP.2018.2818439 [6] Wan, W., Liu, J., Sun, J., Ge, C. and Nie, X. (2015) Logarithmic STDM
Watermark-ing UsWatermark-ing Visual Saliency-Based JND Model. Electronics Letters, 51, 758-760.
https://doi.org/10.1049/el.2014.4329
[7] Wang, H. (2016) MCL-JCV: A JND-Based H.264/AVC Video Quality Assessment Dataset. 2016 IEEE International Conference on Image Processing, 25-28 Septem-ber 2016, Phoenix, AZ, 1509-1513. https://doi.org/10.1109/ICIP.2016.7532610 [8] Chou, C.H. and Li, Y.C. (1995) A Perceptual Tuned Sub-Band Image Coder Based
on the Measure of Just-Noticeable-Distortion Profile. IEEE Transaction on Circuits & Systems for Video Technology,5, 467-476. https://doi.org/10.1109/76.475889 [9] Yang, X.K., Ling, W.S., Lu, Z.K., Ong, E.P. and Yao, S.S. (2005) Just Noticeable
Distortion Model and Its Applications in Video Coding. Signal Processing Image Communication,20, 662-680. https://doi.org/10.1016/j.image.2005.04.001
[10] Liu, A., Lin, W., Paul, M., Deng, C. and Zhang, F. (2010) Just Noticeable Difference for Images with Decomposition Model for Separating Edge and Textured Regions.
IEEE Transactions on Circuits & Systems for Video Technology, 20, 1648-1652.
https://doi.org/10.1109/TCSVT.2010.2087432
[11] Wu, J.J., Qi, F. and Shi, M. (2012) Self-Similarity Based Structural Regularity for Just Noticeable Difference Estimation. Journal of Visual Communication and Image Representation, 23, 845-852. https://doi.org/10.1016/j.jvcir.2012.04.010
[12] Ahumada Jr., A.J. and Peterson, H.A. (1992) Luminance-Model-Based DCT Quan-tization for Color Image Compression. Human Vision, Visual Processing, & Digital Display III,1666. https://doi.org/10.1117/12.135982
DOI: 10.4236/jcc.2018.64005 64 Journal of Computer and Communications [14] Zhang, X.H., Lin, W.S. and Xue, P. (2005) Improved Estimation for Just-Noticeable
Visual Distortion. Signal Processing,85, 795-808.
https://doi.org/10.1016/j.sigpro.2004.12.002
[15] Wei, Z. and Ngan, K.N. (2009) Spatio-Temporal Just Noticeable Distortion Profile for Grey Scale Image/Video in DCT Domain. IEEE Transaction on Circuits and Systems for Video Technology, 19, 337-346.
https://doi.org/10.1109/TCSVT.2009.2013518
[16] Wu, J., Shi, G., Lin, W., Liu, A. and Qi, F. (2013) Just Noticeable Difference Estima-tion for Images with Free-Energy Principle. IEEE Transactions on Multimedia, 15, 1705-1710. https://doi.org/10.1109/TMM.2013.2268053
[17] Chen, Z. and Guillemot, C. (2010) Perceptually-Friendly H.264/AVC Video Coding Based on Just-Noticeable-Distortion Model. IEEE Transactions on Circuits and Systems for Video Technology, 20, 806-819.