Quantifying electronic correlation strength in a complex oxide:
A combined DMFT and ARPES study of LaNiO
3E. A. Nowadnick,1,2,*J. P. Ruf,3H. Park,2,4,5,6P. D. C. King,3,7,†D. G. Schlom,7,8K. M. Shen,3,7and A. J. Millis2
1School of Applied and Engineering Physics, Cornell University, Ithaca, New York 14853, USA
2Department of Physics, Columbia University, New York, New York 10027, USA
3Department of Physics, Cornell University, Ithaca, New York 14853, USA
4Department of Applied Physics and Applied Mathematics, Columbia University, New York, New York 10027, USA
5Department of Physics, University of Illinois at Chicago, Chicago, Illinois 60607, USA
6Materials Science Division, Argonne National Laboratory, Argonne, Illinois 60439, USA
7Kavli Institute at Cornell for Nanoscale Science, Ithaca, New York 14853, USA
8Department of Materials Science and Engineering, Cornell University, Ithaca, New York 14853, USA
(Received 28 August 2015; revised manuscript received 26 October 2015; published 7 December 2015) The electronic correlation strength is a basic quantity that characterizes the physical properties of materials such as transition metal oxides. Determining correlation strengths requires both precise definitions and a careful comparison between experiment and theory. In this paper, we define the correlation strength via the magnitude of the electron self-energy near the Fermi level. For the case of LaNiO3, we obtain both the experimental and
theoretical mass enhancementsm/mby considering high resolution angle-resolved photoemission spectroscopy (ARPES) measurements and density functional+dynamical mean field theory (DFT+DMFT) calculations. We use valence-band photoemission data to constrain the free parameters in the theory and demonstrate a quantitative agreement between the experiment and theory when both the realistic crystal structure and strong electronic correlations are taken into account. In addition, by considering DFT+DMFT calculations on epitaxially strained LaNiO3, we find a strain-induced evolution ofm/min qualitative agreement with trends derived from optics
experiments. These results provide a benchmark for the accuracy of the DFT+DMFT theoretical approach, and can serve as a test case when considering other complex materials. By establishing the level of accuracy of the theory, this work also will enable better quantitative predictions when engineering new emergent properties in nickelate heterostructures.
DOI:10.1103/PhysRevB.92.245109 PACS number(s): 71.27.+a,79.60.−i
I. INTRODUCTION
Strongly correlated electron materials such as transition metal oxides display a rich variety of phenomena, including su-perconductivity, magnetism, and charge and orbital orders [1]. Electron-electron interactions (among the electrons in partially filled transition metald-orbitals in the transition metal oxide case) are a key source of this richness, but other factors including the crystal structure [2] and the relative energies of other orbitals [3] also are important. A defining property of a strongly correlated electron material is the “correlation strength,” which characterizes the degree to which a measured property of the material differs from that predicted by a reference calculation in which electron-electron interactions are neglected or treated in a mean-field manner. While the qualitative meaning of the term “correlation strength” is intuitively clear, a precise definition of correlation strength requires choices of a reference calculation and a physical property. The most widely used reference calculation is density functional theory (DFT), while the most basic property is the electron mass enhancement m/m, which can be accessed
by a variety of experimental probes. An important test of a theoretical method is whether it reproduces the correlation strength of a given material.
†Current address: SUPA, School of Physics and Astronomy, University of St. Andrews, St. Andrews KY16 9SS, UK.
In this paper, we investigate the mass enhancement of LaNiO3 both experimentally, via angle-resolved photoemis-sion spectroscopy (ARPES) [4] and theoretically, via density functional+dynamical mean field theory (DFT+DMFT) calculations. By comparing the experiment and theory at precisely the same points in momentum space, and to the same reference DFT band structure, we seek to quantify how well DFT+DMFT can reproduce the experimental mass enhancement. LaNiO3is an appropriate test case for this study because it has strong electronic correlations, yet remains a Fermi liquid down to low temperatures. In addition, there has been a great deal of interest in potential exotic physics in LaNiO3, including engineering orbital polarization with epitaxial strain [5–7] and a cupratelike Fermi surface via heterostructuring [8], and precise knowledge of the predictive capabilities of theory will aid in engineering new emergent properties in the nickelates.
LaNiO3is also an interesting choice for this study because there is a strong association between correlation effects such as metal-insulator transitions (MIT) and lattice distortions in the nickelates. Considering the phase diagram of the rare-earth nickelate family RNiO3, LaNiO3 is the only material that remains metallic to lowest temperatures; upon cooling, other
film thickness for an MIT and the coefficient of the T2 term in the resistivity depend on the value of the epitaxially induced strain. We thus expect that in LaNiO3the correlation strength is determined by a subtle interplay between a basic interaction parameter and the precise crystal structure. A precise determination of the correlation strength must untangle these two effects; this issue is relevant for many transition metal oxides.
LaNiO3 has already been characterized experimentally via ARPES [14–16], optical conductivity [17–19], and ther-modynamic measurements [20–22], as well as theoretically with DFT [23–25], DFT+DMFT [6,8,26–29], and model system [30–32] calculations, and a variety of measurements of
m/mhave previously appeared (to be discussed more later). ARPES offers a particularly direct measure of a material’s mass enhancement via momentum-resolved access to the electronic Green’s function, which is the fundamental quantity that characterizes electron propagation in a material:
G(k,ω)=(ω+μ−HDFT(k)−(k,ω))−1. (1)
Here, k is a momentum in the first Brillouin zone, μ is the chemical potential, andHDFTis the reference calculation Hamiltonian (here labeled by DFT because this is the reference used in this paper). The electron self-energy(k,ω) encodes the electronic correlations by parametrizing the difference between the observed electron propagation and that predicted byHDFT(k). Below, we briefly summarize the relevant theory for extracting a mass enhancement of a Fermi liquid from ARPES.
In a Fermi liquid at the lowest temperatures and frequencies and small (k−kF), the imaginary part of the self-energy (k,ω) may be neglected. In this case, the physical Fermi surface is given by the locus of momentum points k= kF for which det[HDFT(kF)+(kF,ω=0)]=μ, while the
DFT Fermi surface is defined as points k=kF for which
det[HDFT(kF)]=μDFT, whereμ andμDFT are chemical po-tentials chosen so that the electron density in each calculation is the same as that in the actual material. Remarkably, in many cases including that studied here, DFT correctly predicts the shapeof the Fermi surface; correlations are revealed only in the excitation spectrum. Of particular interest is the physical quasiparticle dispersion ωqp(k) of the correlated material, given by the solution of
det[ωqp(k)−HDFT(k)−(k,ωqp(k))+μ]=0. (2)
While Eq. (2) is defined for all k, the solution describes a propagating Fermi liquid quasiparticle only for k near kF.
In this range of momenta, comparison of the quasiparticle dispersion to the DFT dispersionωDFT(k) defined by
det[ωDFT(k)−HDFT(k)+μDFT]=0 (3)
gives a mass enhancement m/m relative to DFT. This
mass enhancement is widely regarded as a key measure of correlation strength. The mass enhancement can in principle be momentum-dependent, either through the intrinsic momentum dependence of the electron self-energy (k,ω), which is ignored in the single-site DMFT approximation, or if the orbital character varies substantially around the Fermi surface (for example, if the Fermi surface has regions of both
predominantly strongly correlated d and weakly correlated
pcharacter).
The plan for the rest of the paper is as follows. We describe our methods in Sec.II, and then consider the choice of the free parameters in the DFT+DMFT calculation (via comparison to high-energy features in the experimental angle-integrated photoemission spectra) and the choice of the reference DFT band structure in Sec.III. We present the results of our study in Sec.IV, and discuss our results in the context of the literature and conclude in Secs.VandVI.
II. METHODS
Epitaxial thin films of LaNiO3are grown on (001) oriented pseudocubic (pc) LaAlO3 substrates using reactive-oxide molecular-beam epitaxy and then transferred and measured under ultrahigh vacuum within situARPES via the methods described in Ref. [14]. All ARPES data reported here were obtained with a VG Scienta R4000 electron analyzer using He Iαradiation (hν =21.2 eV) at a measurement temperature of T =20 K and with 8 meV energy resolution. Because we are interested in the correlated-metal properties here, we use films with a 10 pseudocubic unit cell thickness where a bulklike Fermi surface has been observed, well away from the previously reported thickness-driven MIT [14].
DFT calculations are performed using the Perdew-Burke-Ernzerhof (PBE) functional and the projector augmented wave method as implemented in the Vienna ab initio simulation package (VASP) [33,34]. We use a 600-eV plane-wave cutoff and, for structural relaxations, a force convergence tolerance of 2 meV/A. We consider bulk LaNiO˚ 3in both the rhombohedral (space groupR¯3c,a−a−a−in Glazer notation) and idealized cubic (space groupP m¯3m) structures. For the rhombohedral and cubic structures, we use 7×7×7 and 8×8×8 k -point meshes, respectively. We also consider LaNiO3 under biaxial strain, in which case the symmetry is reduced from rhombohedral to monoclinic (space group C2/c, in Glazer notation a−a−c−). For biaxial strain calculations we use a 10-atom unit cell with lattice vectors (a,a, 0), (a+,,c), and (,a+,c). This choice of unit cell imposes an epitaxial constraint to a square substrate with in-plane pseudocubic lattice constant a. This cell allows for relaxation of the out-of-plane lattice parametercas well as a monoclinic tiltβ
of the unit cell (tanβ =c/). We relaxβby manually setting
to different values, relaxing the resulting structure, and choosing the value ofthat yields the minimum total energy. We make use ofVESTA[35] to visualize crystal structures.
family [28]. The filledt2gorbitals are treated with the
Hartree-Fock approximation while the partially occupiedeg orbitals
are treated with single-site DMFT. The DMFT impurity problem is solved using the hybridization expansion version of the continuous time quantum Monte Carlo method [39,40] with the temperature set to 0.01 eV ≈120 K. For analytic continuation to obtain the real frequency spectral function and density of states (DOS), we employ the maximum entropy method [41].
III. DETERMINATION OF INTERACTION STRENGTH AND REFERENCE BAND STRUCTURE
In making a quantitative comparison between experiment and theory, it is important to clarify the relevant uncertainties. For our comparison of the experimental and theoreticalm/m
for LaNiO3, the uncertainties arise from the free parameters in the DFT+DMFT calculation, and the choice of reference DFT band structure. We explore both of these issues in turn in this section.
A. Interaction parameters
We first fix the Hubbard U and Hund’s interaction J
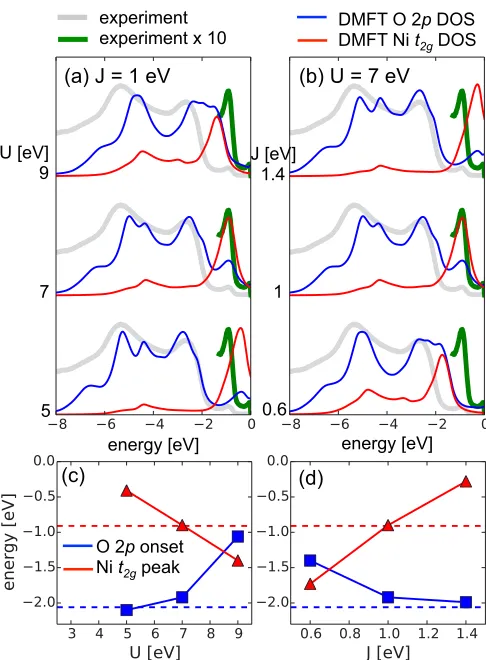
parameters by comparing experimental angle-integrated pho-toemission spectra to the DFT+DMFT DOS calculated with various choices of (U, J) in Fig. 1. The DFT+DMFT calculations are performed using an R¯3c crystal structure relaxed within DFT. The experimental spectra show a peak at ∼1 eV binding energy, arising from the Ni-t2g states,
and a broad higher-energy feature with onset at ∼2 eV binding energy, arising from the O-2pstates. We note that the calculation does not include matrix element effects, which are crucial in determining photoemission intensities. As a result, in comparing the measurement and the calculation, we focus on peak positions and the onset of spectral weight, rather than the precise shape and size of the peaks.
Figure 1(a) compares our experimental spectrum to DFT+DMFT DOS calculations with different values ofU
(5, 7, and 9 eV), while keeping J fixed to 1 eV. From the DOS in Fig. 1(a), we extract the onset of the O-2p feature (here we define this as the midpoint of the rising edge) and the location of the Ni-t2g peak and plot them in Fig. 1(c)
as a function of U. Both the U =5 and 7 eV calculations capture the energy of the O-2p feature at ∼2 eV binding energy, while the position of this feature is off by∼1 eV in the
U=9 eV calculation. Considering the Nit2g peak position,
the U =7 eV calculation correctly reproduces this, while the U=5 and 9 eV calculations place this peak at too low and high binding energies, respectively. As a result, only the
U=7 eV calculation is able to correctly reproduce the energy scale of both features observed in experiment.
Now constraining U to 7 eV, we consider the impact of varying J in Fig.1(b) and show the extracted O-2p onset and Ni-t2g peak locations as a function ofJ in Fig.1(d). We
find that the J =1.4 eV calculation captures the energy of the O-2ponset, while theJ =0.6 eV calculation places this feature at too low binding energy. The Nit2gpeak is located at
too high and low binding energies, respectively, in theJ =
0.6 eV and 1.4 eV calculations. From consideration of
(a) J = 1 eV (b) U = 7 eV
(c) (d)
U [eV] 9
7
5 0.6
1 J [eV] 1.4
energy [eV] energy [eV]
experiment experiment x 10
DMFT O 2p DOS DMFT Ni t2g DOS
O 2p onset Ni t2g peak
FIG. 1. (Color online) Comparison of experimental angle-integrated photoemission spectra (thick lines, grey and green online) to calculated DFT+DMFT partial density of states (thin lines, blue and red online) for (a)J =1 eV andU=5, 7, and 9 eV (bottom to top), and (b)U=7 eV andJ =0.6, 1.0, and 1.4 eV (bottom to top). Due to the experimental photon energy, the intensity of the Ni-t2gpeak is weak compared to the O-2pfeatures, so the low energy part of the spectrum enlarged by a factor of 10 (green) is shown for comparison to the calculated Ni-t2gpeak. Note that the spectra are artificially offset along the vertical axis for clarity. (c) and (d) plot the midpoint of the O-2ponset (blue squares) and the Ni-t2g peak position (red triangles) extracted from the DFT+DMFT calculations in (a) and (b) as a function ofUandJrespectively. The dashed lines indicate the position of these features in the experimental spectrum.
these DFT+DMFT calculations with five different (U, J) parameter sets, we find that only (U,J)=(7,1) eV is able to reproduce the experimental energy position of both features, while the other calculations misalign either one or both features. As a result we use this parameter set in the rest of our calculations. In addition to constraining the free parameters in our calculation, this comparison in Fig. 1
also highlights the sensitivity of the energies of features in the angle-integrated photoemission spectrum to the electron interaction parameters used in DFT+DMFT calculations. A previous study [42] on bulk LaNiO3 extracted a value of
[image:3.608.314.557.67.397.2]which may be why this value is different from that obtained from our photoemission/DMFT comparison.
B. Reference band structure
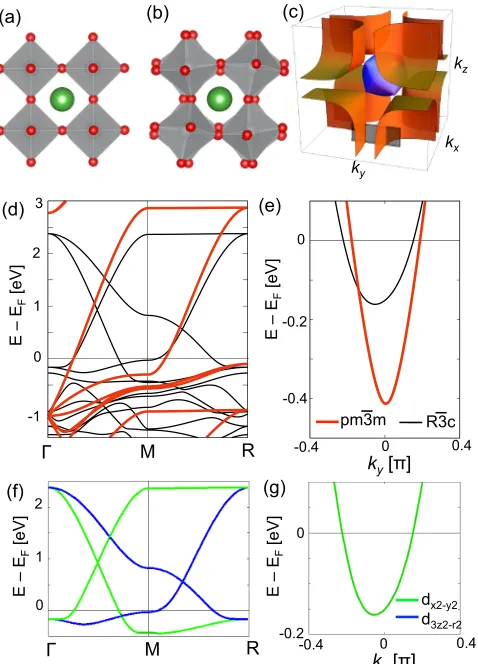
We now consider the choice of reference band structure. LaNiO3 exhibits a rhombohedral structural distortion [25], which has been observed experimentally in our films via superstructure in low-energy electron diffraction measure-ments [14]. We perform DFT calculations for two structures: a hypothetical cubic structure [shown in Fig. 2(a)] and the experimental rhombohedral (R¯3c) structure, where the NiO6 octahedra rotate out of phase about the [111] pseudocubic axis, which corresponds to rotations of equal amounts about each of the three pseudocubic axes, as shown in Fig.2(b). In each
(a) (b) (c)
kx ky
kz
E – E
F
[eV]
Γ M R
0 1 2 3
-1
(d)
E – E
F
[eV]
(e)
0
-0.2
-0.4
ky0 [π] 0.4
-0.4
pm3m R3c
E – E
F
[eV]
E – E
F
[eV]
0 1 2
(f) (g)
0
-0.2
Γ M R
k0 y [π] 0.4
-0.4
dx2-y2 d3z2-r2
FIG. 2. (Color online) Bulk DFT LaNiO3band structure in cubic
and rhombohedral structures. Comparison of cubic (a) and rhombohe-dral (b) structures: in the rhomboherhombohe-dral structure, the NiO6octahedra
rotate out of phase about each of the pseudocubic axes. (c) Fermi surface for LaNiO3in the cubic structure. The black slab indicates the
momentum space cut (π/2apc,ky, 0.7π/apc) that we measure in our ARPES experiment. (d) and (e) compare the cubic and rhombohedral band structures (thick red and thin black lines) along high-symmetry cuts and along the experimental cut, respectively. Note that in (d) we label high-symmetry points using notation for the cubic structure. (f) and (g) show the dominant orbital character (dx2−y2ord3z2−r2) of the
bands crossing the Fermi level (for the rhombohedral structure) for the same momentum space cuts as shown in (d) and (e).
case, we fully relax the structures; we find a Ni-O-Ni bond angle of 161.6◦ and a Ni-O bond length of 1.95 ˚A when we relax the rhombohedral structure with PBE. This compares to experimental values of 164.8◦and 1.93 ˚A for the bond angle and length, respectively, for bulk LaNiO3at 1.5 K [9].
Figure2(c)shows a schematic of the LaNiO3Fermi surface computed for the hypothetical cubic structure. It consists of two sheets with a small electron pocket centered at the
point, and large hole pockets centered at the Brillouin zone corners. In this work, we study the band structure along the momentum space cut (π/2apc,ky, 0.7π/apc), which is shown
as the black slab in the lower part of Fig.2(c)(this momentum space cut is determined by our experimental photon energy). We determine the value ofkz corresponding to this photon
energy as described in Ref. [14]. Due to surface sensitivity, the photoemission measurements integrate over a range ofkz,
which is represented by the finite height of the slab along
kzin Fig.2(c). However, the electronic structure has littlekz
dependence in this range, so this should minimally affect our results. We also consider calculated band structures along high-symmetry cuts through the Brillouin zone for comparison. LaNiO3 has a nominalt26ge1g electronic configuration, so the
bands crossing the Fermi level have predominatelyegcharacter
with a sizable O 2p component from hybridization. The dominant orbital character of the bands crossing the Fermi level is shown in Figs.2(f)–2(g).
The rhombohedral distortion present in LaNiO3is generally expected to reduce the bandwidth relative to that of the cubic structure, because rotations of the NiO6octahedra distort the Ni-O-Ni bond angle away from 180◦ and thus reduce the orbital overlap between the Ni-eg and the O-2p states. To
clarify how the octahedral rotations influence the specifics of the near-Fermi level band structure needed for obtaining
m/mfrom ARPES measurements, we compare DFT band
structures computed in the rhombohedral structure and in the idealized cubic structure both along high-symmetry Brillouin zone cuts [Fig.2(d)] and along our experimentally accessible momentum cut [Fig.2(e)].
Focusing first on the band structure along high-symmetry cuts in Fig.2(d), the two prominent near-Fermi level features are a band crossing the Fermi level on the-Mcut (two bands in the case of the rhombohedral band structure, due to zone folding), and a shallow band bottom at theMpoint. The Fermi velocityvF of the-Mband is reduced in the rhombohedral
band structure relative to that in the cubic band structure, and theM-point band bottom moves to significantly lower binding energy. Both of these changes are consistent with the reduction of Ni-O hybridization due to the rhombohedral distortion. However, the magnitude of these changes differs substantially: while there is only a small difference invFalong-Mbetween
the rhombohedral and cubic structures, the position of the band bottom at theMpoint moves from∼300 meV binding energy (cubic) to∼30 meV binding energy (rhombohedral).
Now turning to the momentum space cut accessed by our experiments [Fig.2(e)], we find that bothvF and the binding
[image:4.608.55.294.266.598.2]illustrates that the rhombohedral distortion present in LaNiO3 has a significant influence on the low-energy band structure, but the precise magnitude of this effect varies significantly in momentum space. Therefore a quantitative determination of
m/mdepends sensitively on the correct details of the crystal
structure and requires a comparison of theory and experiment at the same locations in momentum space.
IV. RESULTS
A. Bulklike rhombohedral structure
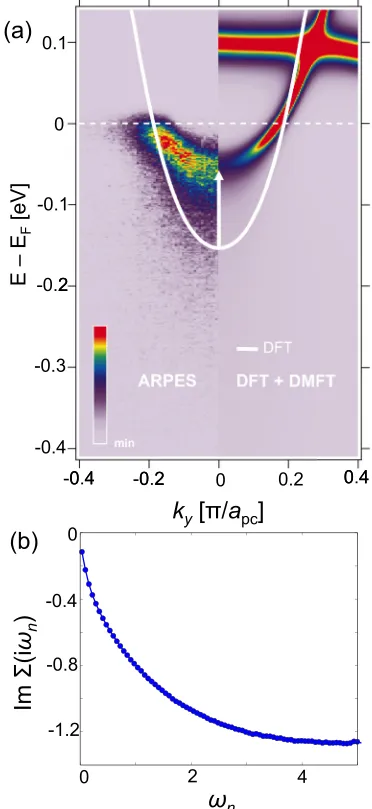
Figure3(a)compares the rhombohedral DFT band structure from Fig.2(e)to spectra measured by ARPES and calculated by DFT+DMFT. The experiment and calculations consider exactly the same momentum cut (π/2apc,ky, 0.7π/apc). In
(a)
(b)
E – E
F
[eV]
0 0.1
-0.1
-0.2
-0.3
-0.4
0
-0.4 -0.2 0.2 0.4
k
y[π/a
pc]
Im Σ(i
ω
n)
ω
n0
-0.4
-0.8
-1.2
0 2 4
2
0 4 0 2 0 4
FIG. 3. (Color online) (a) Comparison of ARPES spectrum (left side) and DFT+DMFT spectral function (right side), both along the momentum space cut (π/2apc,ky, 0.7π/apc) to the DFT band structure, calculated in the bulk R¯3c structure (white line). (b) Imaginary part of the Matsubara axis DFT+DMFT self-energy, used to calculate the theoretical value ofm/m.
both experiment (left side) and DFT+DMFT (right side), there is a shallow band crossing the Fermi level with a band bottom at ∼50 meV and a Fermi level crossing at
ky= −0.2π/apc. This band is substantially renormalized by
electron correlations relative to the rhombohedral DFT band structure, and the renormalization predicted by DFT+DMFT is in good agreement with that seen in experiment. It is important to emphasize that the DFT+DMFT calculation used the values ofU andJ obtained from matching features in the high-energy spectrum in Fig. 1, we do not further optimize these parameters to obtain the present comparison of the low-energy spectra.
We obtain a mass renormalization of m/m=3.1±0.5 by comparing the DFT and experimental/DFT+DMFT band bottom energies, andm/m=3.4±0.5 by comparing Fermi
velocitiesvF. An earlier report ofm/mof 7 in this system
from some of the present authors arose from using DFT calculations in the idealized cubic structure [14] which, as can be seen from Fig.2(e), are about a factor of two more dispersive.
Alternatively, the theoretical mass renormalization can be obtained by considering the frequency derivative of the electron self-energy∂(ω)/∂ω|ω=0(in the single-site DMFT approximation considered here, the self-energy has no k
dependence). This is related to the physical mass enhance-ment discussed in the previous paragraph by factors of the relative d and p content of the near-Fermi surface wave functions [43,44]. In the Fermi liquid regime relevant here, the imaginary part of the real-axis self-energy is negligible at low frequencies and one may estimate ∂(ω)/∂ω|ω=0 from the imaginary part of the self-energy on the Matsubara axis (iωn), shown in Fig. 3(b). We fit the five lowest
Matsubara points to a fourth order polynomial to obtain
m/m=(1−∂(iω
n)/ωn|ωn→0)=3.5. We also calculate
the mass renormalization from the analytically continued self-energy,m/m=(1−∂(ω)/∂ω|ω=0) (not shown) and obtain the same value, thus lending confidence to our analytic continuation procedure. The estimate we obtain is in good agreement with the experimentally determined value, and consistent with the observation that in this region of the Brillouin zone the states are of primarily Ni-d character. This quantitative comparison between experiment and theory in Fig. 3(a) demonstrates that DFT+DMFT is able to accurately describe correlated physics in LaNiO3. However, it also highlights the importance of considering realistic crystal structure, correct interaction parameters, and precisely the same momentum space points in experiment and theory.
B. Strained films
[image:5.608.75.261.271.676.2]E – E
F
[eV]
Γ M R
0 1 2
E – E
F
[eV]
0
-0.1
-0.3
ky[π]
0 0.4
-0.4 -0.2
(a)
(d) (c)
strain [%]
Ni – O – Ni angle [deg]
-1 % 0 % +1 %
(b)
Ni – O bond length [A]
strain [%]
155 160
1.92 1.94 1.96 1.98 2.0
165 170 175
0 1 2 -2 -1
0 1 2 -2 -1
180
in-plane θxy
out-of-plane θz
in-plane rxy
out-of-plane rz
FIG. 4. (Color online) Influence of biaxial strain on DFT band structure. The evolution with strain of (a) the Ni-O-Ni bond angles and (b) the Ni-O bond lengths that lie in (purple) and out (blue) of the plane in which biaxial strain is applied. Here, negative (positive) values correspond to compressive (tensile) strain. The band structure at−1%, 0, and+1% strain is shown in (c) along high-symmetry cuts and (d) along the experimental ARPES cut. Note that LaNiO3grown
on LaAlO3(the experimental setup) corresponds to 1% compressive
strain.
θxyandθz, which lie in and out of the plane of applied strain,
respectively. In addition, there are also two distinct Ni-O bond lengths,rxyandrzlying in (out of) the strain plane. The crystal
structure accommodates this biaxial strain via changes to both the Ni-O-Ni bond angles and the Ni-O bond lengths, as shown in Figs. 4(a) and 4(b). Upon moving from compressive to tensile strain, θxy moves closer to 180◦ and rxy expands to
accommodate the stretching of the crystal in this plane, while
θzmoves further from 180◦andrzcontracts.
Experimentally, an asymmetry in the response of the in-/out-of plane bond angles and lengths is observed in LaNiO3: the out-of-plane bond angle changes more with biaxial strain than the in-plane bond angle, while the in-plane bond length changes more than the out-of-plane bond length [25] (the same asymmetric response also is observed in strained LaAlO3 [45]). We find that our calculated bond angles in Fig. 4(a)
reproduce this asymmetric trend, while the bond lengths in Fig. 4(b) do not (rxy and rz change by roughly the same
amount). Improved agreement with experiment regarding these structural changes can be obtained by performing structural relaxations within DFT+U[25].
We compare the band structure at−1%, 0, and+1% biaxial strain along high symmetry cuts and along our experimental cut in Figs.4(c)and4(d). Focusing on the near-Fermi level band structure features, in Fig.4(c),vF of the band crossing
the Fermi level on the-M cut is essentially unchanged for
the strains we consider, while the position of the near-Fermi level band bottom at the M point changes substantially (note that the 0%-strainC2/cband structure does not need to agree precisely with the bulk R¯3c band structure due to the different symmetries of these structures). For our experimental momentum cut in Fig.4(d), the band displays moderate changes with strain. Interestingly, the response of the band structure to strain is remarkably different at different momentum points: compressive strain pushes the band bottom at theM point to higher binding energy in Fig. 4(c), while the band bottom in Fig.4(d)moves to lower binding energy. These differences can be understood in light of the fact that biaxial strain lifts the degeneracy of the eg orbitals, and
bands derived from the d3z2−r2 anddx2−y2 orbitals respond
differently to biaxial strain (both in terms of changes to the bandwidth and the band’s center of mass) [6]. As can be seen in Figs.2(f)and2(g), the band bottom atMis predominantly ofd3z2−r2 character, while the band on our experimental cut
is predominantlydx2−y2 character, so it is not surprising that
these bands display opposite trends with strain.
While these results reveal a complex evolution of the band structure with strain, the key observation for our chosen system of LaNiO3/LaAlO3 is that in Fig. 4(d) the band under 1% compressive strain is quite similar to the bulkR¯3cband used to obtainm/min Fig.3(both in terms of band bottom energy andvF). Therefore our use of the bulkR¯3cstructure rather than
the 1% compressively strainedC2/cstructure for the particular strain and momentum space cut considered in this work does not introduce significant errors in our determination ofm/m.
However, as illustrated in Fig.4, the bands at other strain values and momentum space cuts can be significantly different from the bulk band structure, so in general using a band structure computed at the strain imposed by the experimental substrate may be necessary to obtain a quantitative comparison between experiment and theory.
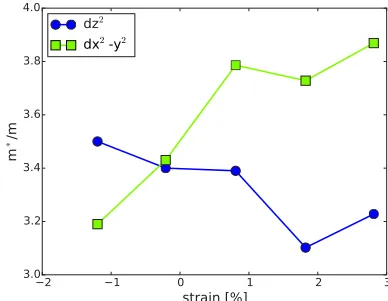
Finally, Fig. 5 shows the strain-dependence of the mass renormalizationm/mcalculated with DFT+DMFT. These
values ofm/mwere obtained from fitting Matsubara
self-energies, using the same procedure as in Sec.IV A. Because biaxial strain breaks the degeneracy of theeg orbitals, there
[image:6.608.51.293.69.328.2] [image:6.608.337.531.549.700.2]are now distinct self-energies corresponding to thedx2−y2and
d3z2−r2 orbitals, so Fig.5 shows the orbitally resolved mass
enhancements. We find that the dx2−y2 mass enhancement
increases upon stretching the in-plane lattice constant (moving from compressive to tensile strain), while the d3z2−r2 mass
enhancement decreases slightly. Because the dominant orbital character of the bands crossing the Fermi level varies in momentum space, as shown in Figs. 2(f) and2(g), at large compressive or tensile strains we would therefore expect a momentum-dependent mass enhancement if ARPES measure-ments were made at points around the Fermi surface with different dominant orbital characters.
The strain dependence of the orbitally resolvedm/mcan be understood in light of the changes to the Ni-O-Ni bond angles and Ni-O bond lengths presented in Figs.4(a)and4(b), which both couple to the electronic bandwidthW. Assuming strain does not strongly influence the electron-electron inter-action strengthU, strain-induced bandwidth changes will tune the ratioU/W, which controls the correlation strength [1]. Thus the increase (decrease) in the dx2−y2 (d3z2−r2)-orbitally
resolvedm/mwith tensile strain would arise from a decrease
(increase) in bandwidthWx2−y2(W3z2−r2). For bands formed by
hybridizedegand O 2porbitals,Wis related to the Ni-O bond
lengthrand the Ni-O-Ni bond angleθvia the expression [46]
W ∼ |cosθ|/r3.5. Here, the bandwidthWx2−y2 is controlled
byrxy andθxy, while the bandwidthW3z2−r2 is controlled by
rzandθz.
The expression for W above reveals that strain-induced changes torandθshown in Figs.4(a)and4(b)will generally affect the bandwidth in opposite ways. Taking the example of
Wx2−y2, tensile strain increasesrxyandθxyrelative to the
un-strained values, which will decrease (increase) the bandwidth, respectively. As a result, the net bandwidth response to strain depends on whether changes in bond angle or bond length are the primary mechanism for strain accommodation, and to what extent the changes cancel each other out. Comparing Figs.4(a),4(b), and5, it is clear that the changes to the orbitally resolved m/mwith strain follow the trends that one would
expect from the Ni-O bond distance changes, rather than the Ni-O-Ni bond angle (an increasingdx2−y2mass enhancement
arises from increased rxy, while a decreasingd3z2−r2 m/m
arises from a decreasing rz). The fact that the dx2−y2 mass
enhancement changes more with strain than thed3z2−r2 mass
enhancement can be understood becauseθxyresponds less to
strain thanθzas shown in Fig.4(a), so there is less cancellation
of the bond length/angle changes to the bandwidth.
While this analysis describes the strain induced changes to m/m solely in terms of bond angle and bond length
changes, the evolution of correlation strength with strain may be more complex, due to the strong coupling between electronic correlations and the lattice in theRNiO3family. For example, structural relaxations within DFT+U [24,25,47] predict that tensile strain will induce a bond length dis-proportionation phase in LaNiO3, similar to the correlation-induced disproportionation observed in the bulk insulating
RNiO3 compounds [48,49]. However, DFT+U generally overpredicts the tendency towards bond disproportionation (while DFT underpredicts it), and structural relaxations within DFT+DMFT are needed to correctly reproduce the structural and pressure phase diagram of the bulk nickelates [28]. On
the experimental side, there is mixed evidence regarding bond disproportionation in strained LaNiO3films [5,24].
V. DISCUSSION
To summarize the last sections, comparison of ARPES spectra to the DFT band structure computed in the rhombohe-dral structure establishes a mass enhancementm/m≈3–3.5
in LaNiO3, and DFT+DMFT using the same structure, and interaction parameters fixed by high binding energy features in the photoemission spectra, give quasiparticle bands in very good agreement with the data. This establishes LaNiO3 as a moderately correlated Fermi liquid material. For context, this value ofm/mis in the same regime as other correlated
metallic oxides, such as SrRuO3(m/m∼4) [50,51] and VO2 (m/m∼2) [52].
Other measurements ofm/mfor LaNiO3have previously appeared in the literature. Soft x-ray ARPES measure-ments [16] reportedm/m∼3 and∼0 on the electron- and
holelike bands, respectively, by comparing experiment to DFT calculations in the idealized cubic structure (as noted earlier, we obtain a renormalization of 7 when comparing our data to cubic DFT calculations). This difference of results could be due to measuring at different momentum space points, or to the energy resolution available with soft x rays.
Optical conductivity experiments [17,18] determine a cor-relation strength from the integral of the optical conductivity over a given frequency range [53–55]. One group [17] found an optical mass enhancementm/m∼3 for LaNiO
3 grown on LaAlO3, in good agreement with our results. They also reported that m/m increases from ∼3 to ∼5 as the strain
moves from compressive to tensile. As seen in Fig.5this trend is consistent with the results of our DFT+DMFT calculations, but the experimental variation is larger than the calculated one. Other optical conductivity experiments [18] found the same strain-dependent trend, but with larger mass enhancements. The differences, both between experiments and between experiment and calculation, could arise partly from the choice of frequency range used in the analysis of optical data.
In bulk LaNiO3, thermodynamic studies [20–22] report a Fermi surface averaged mass enhancement of 10 relative to free electrons at a density corresponding to one elec-tron per Ni site. Here, we compare the experimental [22] specific heat-based DOS at the Fermi level of g(EF)=
(1.1–1.3)×1023 eV−1cm−3 to the DOS obtained from our DFT calculations in the rhombohedral structure,gDFT(EF)=
4.1×10²² eV−1cm−3. Taking the ratio of the experimental and DFT DOS, we obtainm/m∼g(E
F)/gDFT(EF)=2.7–
3.2, in reasonable agreement with the value we obtain from ARPES and DFT+DMFT in this paper. (For comparison, for the idealized cubic structure, we obtaingDFT(EF)=2.1×
1022eV−1cm−3and thusm/m=5.2–6.2.) The enhancement
of the Fermi level DOS in the rhombohedral structure relative to the cubic structure is due to the flattening of the bands in the vicinity of the Fermi level in the rhombohedral structure as is visible in Fig.2(d); this was previously discussed in Ref. [6].
VI. CONCLUSION
the experimental and theoretical mass enhancement m/m,
which is a defining property of any correlated material, and demonstrate a quantitative comparison between experiment and theory. This result establishes LaNiO3 as a moderately correlated Fermi liquid, and that DFT+DMFT can accurately describe this correlated physics. We compare our value of
m/mto previous reports in the literature, and discuss possible
origins of differences where appropriate; in particular, we find that our results agree with those from thermodynamic measurements, if we compare those measurements to our DFT calculations.
We highlight the choices that must be made in such a experiment-theory comparison, in particular, the free param-eters U and J in the DFT+DMFT calculation, which we constrain using angle-integrated photoemission spectra. We also emphasize the key role played by the reference DFT band structure. Octahedral rotations and biaxial strain can change the near-Fermi level band structure features significantly, and there is substantial variation in the magnitude of these changes depending on the particular point in momentum space under consideration. In general, octahedral rotations and strain can “renormalize” the low-energy bands relative to an idealized cubic band structure by the same amount as electron correlations can, so it is key to consider the realistic crystal
structure and biaxial strain (and make comparisons at the same momentum-space point) to obtain a quantitative estimate of the mass enhancement arising from electron correlations. These results provide an important benchmark for the DFT+DMFT method, and thus will enable future studies of other nickelates and strongly correlated materials.
ACKNOWLEDGMENTS
This work was supported by the Cornell Center for Materials Research with funding from the NSF MRSEC program (DMR-1120296) and the Office of Naval Research (N00014-12-1-0791). J.P.R. acknowledges support from the NSF IGERT program (DGE-0903653). A.J.M. acknowledges support from the Basic Energy Sciences division of the Department of Energy under Grant ER-046169. H.P. gratefully acknowledges the support of start-up funds from University of Illinois at Chicago and Argonne National Laboratory. Part of the computational work was carried out at computing facilities supported by the Cornell Center for Materials Research. H.P. acknowledges the computing resources provided by Blues, a high-performance computing cluster operated by the Laboratory Computing Resource Center at Argonne National Laboratory.
[1] M. Imada, A. Fujimori, and Y. Tokura,Rev. Mod. Phys.70,1039 (1998).
[2] E. Pavarini, S. Biermann, A. Poteryaev, A. I. Lichtenstein, A. Georges, and O. K. Andersen, Phys. Rev. Lett. 92, 176403 (2004).
[3] J. Zaanen, G. A. Sawatzky, and J. W. Allen,Phys. Rev. Lett.55,
418(1985).
[4] A. Damascelli, Z. Hussain, and Z.-X. Shen,Rev. Mod. Phys.75,
473(2003).
[5] M. Wu, E. Benckiser, M. W. Haverkort, A. Frano, Y. Lu, U. Nwankwo, S. Br¨uck, P. Audehm, E. Goering, S. Mackeet al.,
Phys. Rev. B88,125124(2013).
[6] O. E. Peil, M. Ferrero, and A. Georges,Phys. Rev. B90,045128 (2014).
[7] Z. He and A. J. Millis,Phys. Rev. B91,195138(2015). [8] P. Hansmann, X. Yang, A. Toschi, G. Khaliullin, O. K. Andersen,
and K. Held,Phys. Rev. Lett.103,016401(2009).
[9] J. B. Torrance, P. Lacorre, A. I. Nazzal, E. J. Ansaldo, and C. Niedermayer,Phys. Rev. B45,8209(1992).
[10] A. V. Boris, Y. Matiks, E. Benckiser, A. Frano, P. Popovich, V. Hinkov, P. Wochner, M. Castro-Colin, E. Detemple, V. K. Malik
et al.,Science332,937(2011).
[11] A. X. Gray, A. Janotti, J. Son, J. M. LeBeau, S. Ueda, Y. Yamashita, K. Kobayashi, A. M. Kaiser, R. Sutarto, H. Wadati
et al.,Phys. Rev. B84,075104(2011).
[12] R. Scherwitzl, S. Gariglio, M. Gabay, P. Zubko, M. Gibert, and J.-M. Triscone,Phys. Rev. Lett.106,246403(2011).
[13] J. Son, P. Moetakef, J. M. Lebeau, D. Ouellette, L. Balents, S. J. Allen, and S. Stemmer, Appl. Phys. Lett. 96, 062114 (2010).
[14] P. King, H. Wei, Y. Nie, M. Uchida, C. Adamo, S. Zhu, X. He, I. Bozovic, D. Schlom, and K. Shen,Nat. Nanotechnol.9,443 (2014).
[15] H. K. Yoo, S. Ill Hyun, L. Moreschini, Y. J. Chang, D. W. Jeong, C. H. Sohn, Y. S. Kim, H.-D. Kim, A. Bostwick, E. Rotenberg, Ji Hoon Shim, and Tae Won Noh,Sci. Rep.5,8746 (2015).
[16] R. Eguchi, A. Chainani, M. Taguchi, M. Matsunami, Y. Ishida, K. Horiba, Y. Senba, H. Ohashi, and S. Shin,Phys. Rev. B79,
115122(2009).
[17] D. G. Ouellette, S. B. Lee, J. Son, S. Stemmer, L. Balents, A. J. Millis, and S. J. Allen,Phys. Rev. B82,165112(2010). [18] M. K. Stewart, C.-H. Yee, J. Liu, M. Kareev, R. K. Smith, B. C.
Chapler, M. Varela, P. J. Ryan, K. Haule, J. Chakhalianet al.,
Phys. Rev. B83,075125(2011).
[19] M. K. Stewart, J. Liu, R. K. Smith, B. C. Chapler, C. H. Yee, K. Haule, J. Chakhalian, and D. N. Basov,J. Appl. Phys.110,
033514(2011).
[20] X. Q. Xu, J. L. Peng, Z. Y. Li, H. L. Ju, and R. L. Greene,Phys.
Rev. B48,1112(1993).
[21] K. Sreedhar, J. M. Honig, M. Darwin, M. McElfresh, P. M. Shand, J. Xu, B. C. Crooker, and J. Spalek,Phys. Rev. B46,
6382(1992).
[22] K. P. Rajeev, G. V. Shivashankar, and A. K. Raychaudhuri,Solid
State Commun.79,591(1991).
[23] N. Hamada,J. Phys. Chem. Solids54,1157(1993).
[24] J. Chakhalian, J. M. Rondinelli, J. Liu, B. A. Gray, M. Kareev, E. J. Moon, N. Prasai, J. L. Cohn, M. Varela, I. C. Tunget al.,
Phys. Rev. Lett.107,116805(2011).
[25] S. J. May, J.-W. Kim, J. M. Rondinelli, E. Karapetrova, N. A. Spaldin, A. Bhattacharya, and P. J. Ryan,Phys. Rev. B82,
014110(2010).
[26] X. Deng, M. Ferrero, J. Mravlje, M. Aichhorn, and A. Georges,
Phys. Rev. B85,125137(2012).
[27] H. Park, A. J. Millis, and C. A. Marianetti,Phys. Rev. Lett.109,
[28] H. Park, A. J. Millis, and C. A. Marianetti,Phys. Rev. B89,
245133(2014).
[29] M. J. Han, X. Wang, C. A. Marianetti, and A. J. Millis,Phys.
Rev. Lett.107,206804(2011).
[30] S. B. Lee, R. Chen, and L. Balents,Phys. Rev. B84,165119 (2011).
[31] S. Johnston, A. Mukherjee, I. Elfimov, M. Berciu, and G. A. Sawatzky,Phys. Rev. Lett.112,106404(2014).
[32] B. Lau and A. J. Millis,Phys. Rev. Lett.110,126404(2013). [33] G. Kresse and J. Furthm¨uller,Phys. Rev. B54,11169(1996). [34] G. Kresse and J. Furthm¨uller,Comput. Mater. Sci.6,15(1996). [35] K. Momma and F. Izumi,J. Appl. Crystallogr.41,653(2008). [36] H. Park, A. J. Millis, and C. A. Marianetti,Phys. Rev. B90,
235103(2014).
[37] A. A. Mostofi, J. R. Yates, Y.-S. Lee, I. Souza, D. Vanderbilt, and N. Marzari,Comp. Phys. Commun.178,685(2008). [38] X. Wang, M. J. Han, L. de’ Medici, H. Park, C. A. Marianetti,
and A. J. Millis,Phys. Rev. B86,195136(2012).
[39] P. Werner, A. Comanac, L. de’ Medici, M. Troyer, and A. J. Millis,Phys. Rev. Lett.97,076405(2006).
[40] K. Haule,Phys. Rev. B75,155113(2007).
[41] M. Jarrell and J. E. Gubernatis,Phys. Rep.269,133(1996). [42] S. R. Barman, A. Chainani, and D. D. Sarma,Phys. Rev. B49,
8475(1994).
[43] L. de’ Medici, X. Wang, M. Capone, and A. J. Millis,Phys. Rev.
B80,054501(2009).
[44] X. Wang, L. de’ Medici, and A. J. Millis, Phys. Rev. B 83,
094501(2011).
[45] R. L. Johnson-Wilke, D. Marincel, S. Zhu, M. P. Warusawithana, A. Hatt, J. Sayre, K. T. Delaney, R. Engel-Herbert, C. M. Schlep¨utz, J.-W. Kimet al.,Phys. Rev. B88,174101(2013). [46] W. A. Harrison, Electronic Structure and the Properties of
Solids: The Physics of the Chemical Bond(W. H. Freeman and Company, San Francisco, 1980).
[47] A. Blanca-Romero and R. Pentcheva,Phys. Rev. B84,195450 (2011).
[48] J. A. Alonso, M. J. Mart´ınez-Lope, M. T. Casais, J. L. Garc´ıa-Mu˜noz, and M. T. Fern´andez-D´ıaz, Phys. Rev. B 61, 1756 (2000).
[49] M. Medarde, C. Dallera, M. Grioni, B. Delley, F. Vernay, J. Mesot, M. Sikora, J. A. Alonso, and M. J. Mart´ınez-Lope,Phys.
Rev. B80,245105(2009).
[50] C. S. Alexander, S. McCall, P. Schlottmann, J. E. Crow, and G.
Cao,Phys. Rev. B72,024415(2005).
[51] D. E. Shai, C. Adamo, D. W. Shen, C. M. Brooks, J. W. Harter, E. J. Monkman, B. Burganov, D. G. Schlom, and K. M. Shen,
Phys. Rev. Lett.110,087004(2013).
[52] M. M. Qazilbash, K. S. Burch, D. Whisler, D. Shrekenhamer, B. G. Chae, H. T. Kim, and D. N. Basov, Phys. Rev. B74,
205118(2006).
[53] D. Baeriswyl, J. Carmelo, and A. Luther,Phys. Rev. B33,7247 (1986).
[54] C. Gros, R. Joynt, and T. M. Rice, Phys. Rev. B 36, 381 (1987).