Sileika
Python System
Administr
ation
Companion eBook AvailableTHE EXPERT’S VOICE
®IN OPEN SOURCE
Pro
Python
System Administration
Rytis Sileika
Learn to manage and monitor your network,
web servers, and databases with Python
BOOKS FOR PROFESSIONALS BY PROFESSIONALS
®Pro Python System Administration
Dear Reader,
Pro Python System Administration takes you beyond standard management tools and quick-and-dirty shell scripts. You’ll discover real-world examples of customized tools built using Python and the Django and Jinja2 frameworks – tools that you can put to work in your own environment right away.
Each chapter explains how to determine your requirements, how to create your tools, and how to use them effectively. I chose the Python programming language because it's relatively simple to use, easy to learn, and elegant. It also comes with a large base of additional modules.
These are some of the practical solutions you’ll learn to create:
• How to manage network devices with SOAP and SNMP
• How to monitor web servers and databases using Django and Jinja2 • How to perform statistical computation with NumPy
• How to offload processing tasks to Amazon Web Services
Administering network systems, a complex task in itself, requires a variety of specialized skills. This book will help you build the customized solutions you need to create an efficient, productive environment.
Rytis Sileika, RHCE
Rytis Sileika
Shelve in: Python
User level:
Intermediate–Advanced
THE APRESS ROADMAP
Pro Python Pro Python System Administration Beginning Python Visualization Foundations of Agile Python
Development Python 3 for
Absolute Beginners Dive into Python 3 Beginning Python, Second Edition
www.apress.com
SOURCE CODE ONLINE Companion eBookSee last page for details on $10 eBook version
ISBN 978-1-4302-2605-5
9 781430 226055
5 49 9 9
Pro Python System
Administration
■ ■ ■
Pro Python System Administration
Copyright © 2010 by Rytis Sileika
All rights reserved. No part of this work may be reproduced or transmitted in any form or by any means, electronic or mechanical, including photocopying, recording, or by any information storage or retrieval system, without the prior written permission of the copyright owner and the publisher.
ISBN-13 (pbk): 978-1-4302-2605-5
ISBN-13 (electronic): 978-1-4302-2606-2
Printed and bound in the United States of America 9 8 7 6 5 4 3 2 1
Trademarked names, logos, and images may appear in this book. Rather than use a trademark symbol with every occurrence of a trademarked name, logo, or image we use the names, logos, and images only in an editorial fashion and to the benefit of the trademark owner, with no intention of infringement of the trademark.
The use in this publication of trade names, trademarks, service marks, and similar terms, even if they are not identified as such, is not to be taken as an expression of opinion as to whether or not they are subject to proprietary rights.
President and Publisher: Paul Manning
Lead Editors: Duncan Parkes and Michelle Lowman Technical Reviewer: Patrick Engebretson
Editorial Board: Clay Andres, Steve Anglin, Mark Beckner, Ewan Buckingham, Gary Cornell, Jonathan Gennick, Jonathan Hassell, Michelle Lowman, Matthew Moodie, Duncan Parkes, Jeffrey Pepper, Frank Pohlmann, Douglas Pundick, Ben Renow-Clarke, Dominic Shakeshaft, Matt Wade, Tom Welsh
Coordinating Editors: Mary Tobin and Jennifer L. Blackwell Copy Editors: Jim Compton, Heather Lang and Marilyn Smith Compositor: Lynn L’Heureux
Indexer: Julie Grady Artist: April Milne
Cover Designer: Anna Ishchenko
Distributed to the book trade worldwide by Springer Science+Business Media, LLC.,
233 Spring Street, 6th Floor, New York, NY 10013. Phone 1-800-SPRINGER, fax (201) 348-4505, e-mail [email protected], or visit www.springeronline.com.
For information on translations, please e-mail [email protected], or visit www.apress.com.
Apress and friends of ED books may be purchased in bulk for academic, corporate, or promotional use. eBook versions and licenses are also available for most titles. For more information, reference our Special Bulk Sales–eBook Licensing web page at www.apress.com/info/bulksales.
The information in this book is distributed on an “as is” basis, without warranty. Although every precaution has been taken in the preparation of this work, neither the author(s) nor Apress shall have any liability to any person or entity with respect to any loss or damage caused or alleged to be caused directly or indirectly by the information contained in this work.
Contents at a Glance
■
About the Author... xvi
■
About the Technical Reviewer... xvii
■
Acknowledgements ... xviii
■
Introduction...xix
■
Chapter 1: Reading and Collecting Performance Data Using SNMP...1
■
Chapter 2: Managing Devices Using the SOAP API...41
■
Chapter 3: Creating a Web Application for IP Address Accountancy ...75
■
Chapter 4: Integrating the IP Address Application with DHCP...107
■
Chapter 5: Maintaining a List of Virtual Hosts in an Apache Configuration File ...137
■
Chapter 6: Gathering and Presenting Statistical Data from Apache Log Files ...159
■
Chapter 7: Performing Complex Searches and Reporting on Application Log Files ...181
■
Chapter 8: A Web Site Availability Check Script for Nagios...211
■
Chapter 9: Management and Monitoring Subsystem ...231
■
Chapter 10: Remote Monitoring Agents...269
■
Chapter 11: Statistics Gathering and Reporting...297
■
Chapter 12: Automatic MySQL Database Performance Tuning...329
■
Chapter 13: Using Amazon EC2/S3 as a Data Warehouse Solution ...349
Contents
■
About the Author... xvi
■
About the Technical Reviewer... xvii
■
Acknowledgements ... xviii
■
Introduction...xix
■
Chapter 1: Reading and Collecting Performance Data Using SNMP...1
Application Requirements and Design ...1
Specifying the Requirements ...1
High-Level Design Specification...2
Introduction to SNMP ...2
The System SNMP Variables Node ...4
The Interfaces SNMP Variables Node ...5
Authentication in SNMP ...7
Querying SNMP from the Command Line ...7
Querying SNMP Devices from Python ...11
Configuring the Application ...11
Using the PySNMP Library ...13
Implementing the SNMP Read Functionality...18
Storing Data with RRDTool ...18
Introduction to RRDTool ...18
Using RRDTool from a Python Program ...20
Creating a RoundRobin Database...20
Writing and Reading Data from the RoundRobin Database ...22
Plotting Graphs with RRDTool ...25
Integrating RRDTool with the Monitoring Solution...28
Creating Web Pages with the Jinja2 Templating System...31
Loading Template Files with Jinja2 ...32
The Jinja2 Template Language ...33
Generating Web Site Pages...35
■CONTENTS
■
Chapter 2: Managing Devices Using the SOAP API...41
What Is the SOAP API?...41
The Structure of a SOAP Message...42
Requesting Services with SOAP ...42
Finding Information about Available Services with WSDL...44
SOAP Support in Python ...45
Converting WSDL Schema to Python Helper Module ...46
Defining Requirements for Our Load Balancer Tool...47
Basic Requirements...48
Code Structure...48
Configuration ...49
Accessing Citrix Netscaler Load Balancer with the SOAP API ...50
Fixing Issues with Citrix Netscaler WSDL...50
Creating a Connection Object...51
Logging In: Our First SOAP Call ...54
Gathering Performance Statistics Data ...59
SOAP Methods for Reading Statistical Data and Their Return Values ...59
Reading System Health Data...60
Reading Service Status Data...62
Automating Administration Tasks ...65
Device Configuration SOAP Methods...66
Setting a Service State...66
A Word About Logging and Error Handling ...68
Using the Python
logging
Module...68
Handling Exceptions ...72
Summary ...73
■
Chapter 3: Creating a Web Application for IP Address Accountancy ...75
Designing the Application ...75
Setting Out the Requirements ...75
Making Design Decisions...76
Defining the Database Schema ...77
The Basic Concepts of the Django Framework...80
What Is Django?...81
The Model/View/Controller Pattern...81
Installing the Django Framework...82
The Structure of a Django Application ...83
Using Django with Apache Web Server...85
Implementing Basic Functionality ...88
Defining the Database Model ...88
URL Configuration...91
Using the Management Interface ...93
Viewing Records ...96
Using Templates...99
Deleting Records ...102
Adding New Records...103
Modifying Existing Records ...105
Summary ...106
■
Chapter 4: Integrating the IP Address Application with DHCP...107
Extending the Design and Requirements ...107
Extending the Database Schema...109
Additions to the Workflow ...110
Adding DHCP Network Data...110
Defining Data Models...110
Additional Workflows ...111
The Add Function...111
The Modify Function ...113
The Delete Function...113
Extending DHCP Configuration with Address Pools ...113
The Address Pool Data Model ...114
Displaying DHCP Network Details...114
The Add and Delete Functions...116
Reworking the URL Structure ...116
Generating URLs in the Model Class...117
Reverse Resolution of URLs ...117
Assigning Names to URL Patterns ...118
■CONTENTS
Adding Client Classification ...120
Additions to the Data Model ...120
Using Template Inheritance...121
Class Rules Management...122
Generating the DHCP Configuration File...127
Other Modifications ...131
Resolving IPs to Hostnames ...131
Checking Whether the Address Is In Use ...132
Summary ...135
■
Chapter 5: Maintaining a List of Virtual Hosts in an Apache Configuration File ...137
Specifying the Design and Requirements for the Application...137
Functional Requirements ...138
High-Level Design ...138
Setting Up the Environment ...138
Apache Configuration...139
Creating a Django Project and Application...139
Configuring the Application ...140
Defining the URL Structure...141
The Data Model...142
The Basic Model Structure...143
Modifying the Administration Interface ...147
Improving the Class and Object Lists ...147
Adding Custom Object Actions ...152
Generating the Configuration File...154
Summary ...157
■
Chapter 6: Gathering and Presenting Statistical Data from Apache Log Files ...159
Application Structure and Functionality...159
Application Requirements ...160
Application Design ...160
Plug-in Framework Implementation in Python ...160
The Mechanics of a Plug-in Framework ...161
Log-Parsing Application ...167
Format of Apache Log Files...167
Log File Reader...169
Calling the Plug-in Methods ...173
Plug-in Modules ...177
Installing the Required Libraries...177
Writing the Plug-in Code ...179
Summary ...180
■
Chapter 7: Performing Complex Searches and Reporting on Application Log Files ...181
Defining the Problem...181
Why We Use Exceptions...184
Are Exceptions Always a Bad Sign?...184
Why We Should Analyze Exceptions ...184
Parsing Complex Log Files ...186
What Can We Find in a Typical Log File? ...186
The Structure of an Exception Stack Trace Log ...187
Handling Multiple Files ...189
Handling Multiple Files...189
Using the Built In Bzip2 Library ...193
Traversing Through Large Data Files...193
What Are Generators, And How Do We Use Them?...193
Detecting Exceptions...195
Detecting Potential Candidates ...195
Filtering Legitimate Exception Traces...196
Storing Data in Data Structures ...197
The Structure of Exception Stack Trace Data ...198
Generating an Exception Fingerprint for Unknown Exceptions ...198
Detecting Known Exceptions...201
Producing Reports...206
Grouping Exceptions ...207
Producing Differently Formatted Output for the Same Dataset...208
Calculating Group Statistics ...208
■CONTENTS
■
Chapter 8: A Web Site Availability Check Script for Nagios...211
Requirements for the Check System...211
The Nagios Monitoring System ...212
Nagios Plug-In Architecture ...212
The Site Navigation Check...213
Installing the Beautiful Soup HTML Parsing Library ...214
Retrieving a Web Page...214
Parsing the HTML Pages with Beautiful Soup ...216
Adding the New Check to the Nagios System ...222
Emulating the User Login Process...224
Summary ...229
■
Chapter 9: Management and Monitoring Subsystem ...231
Design ...231
The Components...231
The Data Objects ...233
The Data Structures ...234
Introduction to Data Normalization ...235
Configuration Data ...237
Performance Data...240
Scheduling ...241
Site Configuration ...242
Communication Flows ...243
XML-RPC for Information Exchange ...244
CherryPy...246
The Server Process ...247
Storing Data in a SQLite3 Database ...247
Actions ...252
The Scheduler...255
Actions ...255
Running Multiple Processes...255
Running Methods at Equal Intervals ...260
A Cron-Like Scheduler ...263
Ticket Dispatcher...264
■
Chapter 10: Remote Monitoring Agents...269
Design ...269
The Passive Component...269
Architecture...269
Actions ...269
The Security Model ...271
Configuration...271
The ConfigParser Library...271
The Configuration Class Wrapper ...277
The Sensor Design ...281
Running External Processes ...282
Using the subprocess Library...282
Controlling the Running Processes...286
Communicating with External Processes...289
Automatically Updating Sensor Code ...292
Sending and Receiving Binary Data with XML-RPC...292
Working with Files and Archives (TAR and BZip2)...293
Summary ...296
■
Chapter 11: Statistics Gathering and Reporting...297
Application Requirements and Design ...297
Using the NumPy Library ...297
Installing NumPy...298
NumPy Examples...298
Representing Data with matplotlib...309
Installing matplotlib ...309
Understanding the Library Structure...310
Plotting Graphs ...311
Saving Plots to a File...316
Graphing Statistical Data ...317
Collating Data from the Database...317
Drawing Timescale Graphs ...318
■CONTENTS
■
Chapter 12: Automatic MySQL Database Performance Tuning...329
Requirements Specification and Design...329
Basic Application Requirements...330
System Design...330
Modifying the Plug-in Framework...332
Changes to the Host Application...332
Modifying the Plug-in Manager ...333
Writing the Producer Plug-ins...334
Accessing the MySQL Database from Python Applications...334
Querying the Configuration Variables ...339
Querying the Server Status Variables ...341
Collecting the Host Configuration Data ...342
Writing the Consumer Plug-ins ...343
Checking the MySQL Version ...344
Checking the Key Buffer Size Setting ...346
Checking the Slow Queries Counter ...347
Summary ...348
■
Chapter 13: Using Amazon EC2/S3 as a Data Warehouse Solution ...349
Specifying the Problem and the Solution...349
The Problem ...349
Our Solution...350
Design Specifications...350
The Amazon EC2 and S3 Crash Course...351
Authentication and Security ...351
The Simple Storage System Concepts...352
The Elastic Computing Cloud Concepts ...354
User Interfaces ...358
Creating a Custom EC2 Image ...359
Reusing Existing Images ...359
Making Modifications...360
Controlling the EC2 Using the Boto Python Module ...364
Setting Up the Configuration Variables ...364
Initializing the EC2 Instance Programmatically ...365
Transferring the Data...369
Destroying the EC2 Instance Programmatically ...369
Summary ...372
■CONTENTS
About the Author
About the Technical Reviewer
■CONTENTS
Acknowledgments
I’d like to express my gratitude to everyone at Apress involved in the development and production of this book. First, I want to thank Duncan Parkes, who helped a lot with the initial proposal, set the general shape and structure of the book, and got the whole project moving forward.
Many thanks go to Michelle Lowman and Dr. Patrick Engebretson for correcting all technical and logical mistakes as well as providing valuable tips.
I would also like to thank Jennifer Blackwell and Mary Tobin for keeping the project and my writing on schedule and gently reminding me about the approaching deadlines.
Introduction
The scope of the system administrator role has changed dramatically over the years. The number of systems supported by a single engineer has also increased. As such, it is impractical to handcraft each installation, and there is a need to automate as many tasks as possible. The structure of systems varies from organization to organization, therefore system administrators must be able to create their own management tools. Historically, the most popular programming languages for these tasks were UNIX shell and Perl. They served their purpose well, and I doubt they will ever cease to exist. However, the complexity of current systems requires new tools, and the Python programming language is one of them.
Python is an object oriented programming language suitable for developing large-scale applications. Its syntax and structure make is very easy to read, so much so that the language is sometimes referred to as “executable pseudocode.” The Python interpreter allows for interactive execution, so in some situations, you can use it instead of a standard UNIX shell. Although Python is primarily an object-oriented language, you can easily adopt it for procedural and functional styles of programming. Given all that, Python makes a perfect fit as a new language for implementing system administration applications. There are a large number of Linux system utilities already written in Python, such as the Yum package manager and Anaconda, the Linux installation program.
Prerequisites for This Book
This book is about using the Python programming language to solve specific system administration tasks. We will look at the four distinctive system administration areas: network management, web server and web application management, database system management, and system monitoring. Although I will explain most of the technologies used in this book in detail, bear in mind that the main goal of this book is to show you the practical application of the Python libraries to solve rather specific issues. Therefore, I’m assuming that you are a seasoned system administrator.
As we go along with the examples, you will be asked to install additional packages and libraries. In most cases, I provide the commands and instructions to perform these tasks on a Fedora system, but you should be ready to adopt these instructions to the Linux distribution that you are going to use. Most of the examples work without many modifications on a recent OS X release (10.6.X) too.
I also assume that you have a background in the Python programming language. I will be focusing on introducing the specific libraries that are used in system administration tasks as well as some lesser known or less-often-discussed language functionality, such as the generator functions or the class internal methods, but the basic language syntax is not explained. If you want to refresh your Python skills I would recommend Beginning Python: From Novice to Professional, Second Edition by Magnus Lie Hetland (Apress, 2008).
■INTRODUCTION
■Note Because of the line length limitations of the printed page, some lines of the code had to be split into two lines. This is indicated by the backslash character (\) at the end of the split line. When you use the code examples,
you can either leave the structure as it is (i.e., with the wrapped lines), or you can join the two lines together, in which case you’ll have to remove the backslash character from the code.
Structure of This Book
This book contains 13 chapters, and each chapter solves a distinctive problem. Some examples span multiple chapters, but even then, each chapter deals with a specific aspect of the particular problem.
In addition to the chapters, several other organizational layers span this book. First, I grouped the chapters by the problem type. Chapters 1 to 4 deal with network management issues; Chapters 5 to 7 talk about the Apache web server and web application management; Chapters 8 to 11 are dedicated to monitoring and statistical calculations; and finally, Chapters 12 and 13 focus on database management issues.
Second, I am maintaining a common pattern in all chapters. I start with the problem statement and then move on to gather requirements and through the design phase before going into the
implementation section.
Third, each chapter focuses on one or more technologies and the Python libraries that provide the language interface to the particular technology. Examples of such technologies could be the SOAP protocol, application plug-in architecture, or cloud computing concepts.
Chapter 1: Reading and Collecting Performance Data Using SNMP
Most network attached devices expose the internal counters via the Simple Network Management Protocol (SNMP). This chapter explains basic SNMP principles and the data structure. We then look at the Python libraries that provide the interface to SNMP–enabled devices. We also investigate the Round Robin database, which is the de facto standard for storing the statistical data. Finally, we’ll look at the Jinja2 template framework, which allows us to generate simple web pages.
Chapter 2: Managing Devices Using the SOAP API
Complicated tasks, such as managing the device configuration, cannot be easily done by using SNMP, because the protocol is too simplistic. Therefore, advanced devices, such as the Citrix Netscaler load balanacers, provide the SOAP API interface to the device management system. In this chapter, we’ll investigate the SOAP API structure and the libraries that enable the SOAP–based communication from the Python programming language. We’ll also look at the basic logging functionality using the built-in libraries.
Chapter 3: Creating a Web Application for IP Address Accountancy
Chapter 4: Integrating the IP Address Application with DHCP
This chapter expands on the previous chapter, and we will implement the DHCP address range support. We will also look at some advanced Django programming techniques such as customizing the response MIME type as well as serving AJAX calls.
Chapter 5: Maintaining a List of Virtual Hosts in an Apache Configuration File
This is another Django application that we are going to develop, but this time, our focus will be the Django administration interface. While building the Apache configuration management application, you’ll learn how to customize the default Django administration interface with your own views and functions.
Chapter 6: Gathering and Presenting Statistical Data from Apache Log Files
In this chapter, our goal is to build an application that parses and analyses the Apache web server log files. Instead of taking the straightforward but inflexible approach of building a monolithic application, we’ll look at the design principles of building plug-in based applications. You will learn how to use the object and class type discovery functions and how to perform a dynamic module loading.
Chapter 7: Performing Complex Searches and Reporting on Application Log Files
This chapter also deals with the log file parsing, but this time I’ll show you how to parse complex, multiline log file entries. We are going to investigate the functionality of the open source log file parser tool called Exctractor, which you can download from http://exctractor.sourceforge.net/.
Chapter 8: A Web Site Availability Check Script for Nagios
Nagios is one of the most popular open source monitoring systems, because its modular structure allows users to implement their own check scripts and thus customize the monitoring tool to their needs. In this chapter, we are going to create two scripts that check the functionality of a web site. We’re going to investigate how to use the Beautiful Soup HTML parsing library to extract the information from the HTML web pages.
Chapter 9: Management and Monitoring Subsystem
This chapter starts a three chapter series in which we’ll build a complete monitoring system. The goal of this chapter is not to replace mature monitoring systems such as Nagios or Zenoss but to show you the basic principles of the distributed application programming. We’ll look at database design principles such as data normalization. We’re also going to investigate how to implement the communication mechanisms between network services using the RPC calls.
Chapter 10: Remote Monitoring Agents
■INTRODUCTION
Chapter 11: Statistics Gathering and Reporting
This is the last part of the monitoring series, where I’ll show you how to perform basic statistical analysis on the collected performance data. We’re going to use scientific libraries—NumPy to perform the calculations and matplotlib to create the graphs. You’ll learn how to find which performance readings fall into the comfort zone and how to calculate the boundaries of that zone. We’ll also do the basic trend detection, which provides a good insight for the capacity planning.
Chapter 12: Automatic MySQL Database Performance Tuning
In this chapter, I’ll show you how to obtain the MySQL database configuration variables and the internal status indicators. We’ll build an application that makes a suggestion on how to improve the database engine performance based on the obtained data.
Chapter 13: Amazon EC2/S3 as a Data Warehouse Solution
This chapter shows you how to utilize the Amazon Elastic Compute Cloud (EC2) and offload the infrequent computation tasks to it. We’re going to build an application that automatically creates a database server where you can transfer data for further analysis. You can use this example as a basis to build an on-demand data warehouse solution.
The Example Source Code
The source code of all the examples in this book, along with any applicable sample data, can be downloaded from the Apress web site at http://apress.com/book/view/1430226056. The source code stored at this location contains the same code that is described in the book.
■ ■ ■
Reading and Collecting
Performance Data Using SNMP
Most devices that are connected to a network report their status using SNMP (the Simple Network Management Protocol). This protocol was designed primarily for managing and monitoring network-attached hardware devices, but some applications also expose their statistical data using this protocol. In this chapter we will look at how to access this information from your Python applications. We are going to store the obtained data in an RRD (round robin database), using RRDTool—a widely known and popular application and library, which is used to store and plot the performance data. Finally we’ll investigate the Jinja2 template system, which we’ll use to generate simple web pages for our
application.
Application Requirements and Design
The topic of system monitoring is very broad and usually encompasses many different areas. A complete monitoring system is a rather complex system and often is made up of multiple components working together. We are not going to develop a complete, self sufficient system here, but we’ll look into two important areas of a typical monitoring system: information gathering and representation. In this chapter we’ll implement a system that queries devices using an SNMP protocol and then stores the data using the RRDTool library, which is also used to generate the graphs for visual data
representation. All this is tied together into simple web pages using the Jinja2 templating library. We’ll look at each of these components in more detail as we go along through the chapter.
Specifying the Requirements
Before we start designing our application we need to come up with some requirements for our system. First of all we need to understand the functionality we expect our system to provide. This will help us to create an effective (and we hope easy-to-implement) system design. In this chapter we are going to create a system that monitors network-attached devices, such as network switches and routers, using the SNMP protocol. So the first requirement is that the system needs to be able to query any device using SNMP.
CHAPTER 1 ■ READING AND COLLECTING PERFORMANCE DATA USING SNMP
Second, the information needs to be stored so that graphs can be produced. We are not going to use it for anything else, and therefore the data store should be optimized for the data representation tasks.
Finally, we need to generate the graphs and represent this information on easily accessible web pages. The information needs to be structured by the device names only. For example, if we are monitoring several devices for CPU and network interface utilization, this information needs to be presented on a single page. We don’t need to present this information on multiple time scales; by default the graphs should show the performance indicators for the last 24 hours.
High-Level Design Specification
Now that we have some ideas about the functionality of our system, let’s create a simple design, which we’ll use as a guide in the development phase. The basic approach is that each of the requirements we specified earlier should be covered by one or more design decisions.
The first requirement is that we need to monitor the network-attached devices, and we need to do so using the SNMP protocol. This means that we have to use appropriate Python library that deals with the SNMP objects. The SNMP module is not included in the default Python installation, so we’ll have to use one of the external modules. I recommend using the PySNMP library (available at
http://pysnmp.sourceforge.net/), which is readily available on most of the popular Linux distributions.
The perfect candidate for the data store engine is RRDTool (available at http://oss.oetiker.ch/ rrdtool/index.en.html). The Round Robin Database means that the database is structured in such a way that each “table” has a limited length, and once the limit is reached, the oldest entries are dropped. In fact they are not dropped; the new ones are simply written into their position.
The RRDTool library provides two distinct functionalities: the database service and the graph-generation toolkit. There is no native support for RRD databases in Python, but there is an external library available that provides an interface to the RRDTool library.
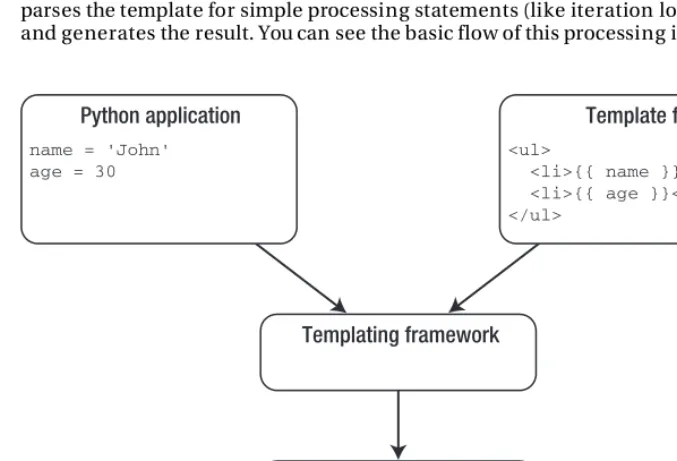
Finally, to generate the web page we will use the Jinja2 templating library (available at http:// jinja.pocoo.org/2/), which lets us create sophisticated templates and decouple the design and development tasks.
We are going to use a simple Windows INI-style configuration file to store the information about the devices we will be monitoring. This information will include details such as the device address, SNMP object reference, and access control details.
The application will be split into two parts: the first part is the information-gathering tool that queries all configured devices and stores the data in the RRDTool database, and the second part is the report generator, which generates the web site structure along with all required images. Both components will be instantiated from the standard UNIX scheduler application—cron. These two scripts will be named snmp-manager.py and snmp-pages.py respectively.
Introduction to SNMP
SNMP (Simple Network Management Protocol) is a UDP-based protocol used mostly for managing network-attached devices, such as routers, switches, computers, printers, video cameras, and so on. Some applications also allow access to internal counters via the SNMP protocol.
There are three main components in a system managed by SNMP:
• The management system, which is responsible for managing all devices
• The managed devices, which are all devices managed by the management system
• The SNMP agent, which is an application that runs on each of the managed devices and interacts with the management system
This relationship is illustrated in Figure 1-1.
Figure 1-1. The SNMP network components
This approach is rather generic. The protocol defines seven basic commands, of which the most interesting to us are get, get bulk, and response. As you may have guessed, the former two are the commands that the management system issues to the agent, and the latter is a response from the agent software.
How does the management system know what to look for? The protocol does not define a way of exchanging this information, and therefore the management system has no way to interrogate the agents to obtain the list of available variables.
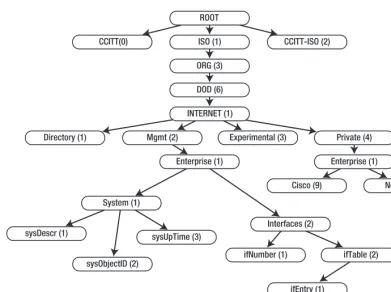
The issue is resolved by using a Management Information Base (or MIB). Each device usually has an associated MIB, which describes the structure of the management data on that system. Such a MIB would list in hierarchical order all object identifiers (OIDs) that are available on the managed device. The OID effectively represents a node in the object tree. It contains numerical identifiers of all nodes leading to the current OID starting from the node at the top of the tree. The node IDs are assigned and regulated by the IANA (Internet Assigned Numbers Authority). An organization can apply for an OID node and when assigned is responsible for managing the OID structure below the allocated node.
CHAPTER 1 ■ READING AND COLLECTING PERFORMANCE DATA USING SNMP
Figure 1-2. The SNMP OID tree
Let’s look at some example OIDs. The OID tree node that is assigned to the Cisco organization has a value of 1.3.6.1.4.1.9, which means that all proprietary OIDs that are associated with the Cisco
manufactured devices will start with these numbers. Similarly, the Novell devices will have their OIDs starting with 1.3.6.1.4.1.23.
I deliberately emphasized proprietary OIDs because some properties are expected to be present (if and where available) on all devices. These are under the 1.3.6.1.2.1.1 (System SNMP Variables) node, which is defined by RFC1213. For more details on the OID tree and its elements, please visit
http://www.alvestrand.no/objectid/top.html. This web site allows you to browse the OID tree and contains quite a large collection of the various OIDs.
The System SNMP Variables Node
In most cases the basic information about a device will be available under the System SNMP Variables OID node subtree. Therefore let’s have a close look at what you can find there.
Table 1-1. System SNMP OIDs
OID String OID Name Description
1.3.6.1.2.1.1.1 sysDescr A string containing a short description of the system or device. Usually contains the hardware type and operating system details.
1.3.6.1.2.1.1.2 sysObjectID A string containing the vendor-specific device OID node. For example, if the organization has been assigned an OID node 1.3.6.1.4.1.8888 and this specific device has been assigned a .1.1 OID space under the
organization’s space, this field would contain a value of 1.3.6.1.4.1.8888.1.1.
1.3.6.1.2.1.1.3 sysUpTime A number representing the time in hundreds of a second from the time when the system was initialized.
1.3.6.1.2.1.1.4 sysContact An arbitrary string containing information about the contact person who is responsible for this system.
1.3.6.1.2.1.1.5 sysName A name that has been assigned to the system. Usually this field contains a fully qualified domain name.
1.3.6.1.2.1.1.6 sysLocation A string describing the physical location of the system.
1.3.6.1.2.1.1.7 sysServices A number that indicates which services are offered by this system. The number is a bitmap representation of all OSI protocols, with the lowest bit representing the first OSI layer. For example, a switching device (operating on layer 2) would have this number set to 22 = 4. This field is
rarely used now.
1.3.6.1.2.1.1.8 sysLastChange A number containing the value of sysUpTime at the time of a change to any of the system SNMP objects.
1.3.6.1.2.1.1.9 sysTable A node containing multiple sysEntry elements. Each element
represents a distinct capability and the corresponding OID node value.
The Interfaces SNMP Variables Node
Similarly, the basic interface statistics can be obtained from the Interfaces SNMP Variables OID node subtree. The OID for the interfaces variables is 1.3.6.1.2.1.2 and contains two subnodes:
• An OID containing the total number of network interfaces. The OID value for this entry is 1.3.6.1.2.1.2.1; and it is usually referenced as ifNumber. There are no subnodes available under this OID.
CHAPTER 1 ■ READING AND COLLECTING PERFORMANCE DATA USING SNMP
[image:30.612.56.488.117.584.2]You can find detailed information about all ifEntry subnodes in Table 1-2.
Table 1-2. Interface entry SNMP OIDs
OID String OID Name Description
1.3.6.1.2.1.2.2.1.1 ifIndex A unique sequence number assigned to the interface.
1.3.6.1.2.1.2.2.1.2 ifDescr A string containing the interface name and other available
information, such as the hardware manufacturer’s name.
1.3.6.1.2.1.2.2.1.3 ifType A number representing the interface type, depending on the
interface’s physical link and protocol.
1.3.6.1.2.1.2.2.1.4 ifMtu The largest network datagram that this interface can
transmit.
1.3.6.1.2.1.2.2.1.5 ifSpeed The estimated current bandwidth of the interface. If the
current bandwidth cannot be calculated, this number should contain the maximum possible bandwidth for the interface.
1.3.6.1.2.1.2.2.1.6 ifPhysAddress The physical address of the interface, usually a MAC address on Ethernet interfaces.
1.3.6.1.2.1.2.2.1.7 ifAdminStatus This OID allows setting the new state of the interface. Usually limited to the following values: 1 (Up), 2 (Down), 3 (Testing).
1.3.6.1.2.1.2.2.1.8 ifOperStatus The current state of the interface. Usually limited to the following values: 1 (Up), 2 (Down), 3 (Testing).
1.3.6.1.2.1.2.2.1.9 ifLastChange The value containing the system uptime (sysUpTime) reading when this interface entered its current state. May be set to zero if the interface entered this state before the last system reinitialization.
1.3.6.1.2.1.2.2.1.10 ifInOctets The total number of bytes (octets) received on the interface.
1.3.6.1.2.1.2.2.1.11 ifInUcastPkts The number of unicast packets forwarded to the device’s network stack.
1.3.6.1.2.1.2.2.1.12 ifInNUcastPkts The number of non-unicast packets delivered to the device’s network stack. Non-unicast packets are usually either broadcast or multicast packets.
OID String OID Name Description
1.3.6.1.2.1.2.2.1.14 ifInErrors The number of received invalid packets.
1.3.6.1.2.1.2.2.1.15 ifInUnknownProtos The number of packets that were dropped because the protocol is not supported on the device interface.
1.3.6.1.2.1.2.2.1.16 ifOutOctets The number of bytes (octets) transmitted out of the interface.
1.3.6.1.2.1.2.2.1.17 ifOutUcastPkts The number of unicast packets received from the device’s network stack. This number also includes the packets that were discarded or not sent.
1.3.6.1.2.1.2.2.1.18 ifNUcastPkts The number of non-unicast - packets received from the
device’s network stack. This number also includes the packets that were discarded or not sent.
1.3.6.1.2.1.2.2.1.19 ifOutDiscards The number of valid packets that were discarded. It’s not an error but may indicate that the send buffer is too small to accept all packets.
1.3.6.1.2.1.2.2.1.20 ifOutErrors The number of outgoing packets that couldn’t be
transmitted because of the errors.
1.3.6.1.2.1.2.2.1.21 ifOutQLen The length of the outbound packet queue.
1.3.6.1.2.1.2.2.1.22 ifSpecific Usually contains a reference to the vendor-specific OID
describing this interface. If such information is not available the value is set to an OID 0.0, which is syntactically valid, but is not pointing to anything.
Authentication in SNMP
Authentication in earlier SNMP implementations is somewhat primitive and is prone to attacks. An SNMP agent defines two community strings—one for read-only access and the other for read/write access. When the management system connects to the agent, it must authenticate with one of those two strings. The agent accepts commands only from a management system that has authenticated with valid community strings.
Querying SNMP from the Command Line
Before we start writing our application, let’s quickly look at how to query SNMP from the command line. This is particularly useful if you want to check whether the information returned by the SNMP agent is correctly accepted by your application.
CHAPTER 1 ■READING AND COLLECTING PERFORMANCE DATA USING SNMP
The command-line tools are provided by the Net-SNMP-Utils package, which is available for most Linux distributions. This package includes the tools to query and set SNMP objects. Consult your Linux distribution documentation for the details on installing this package.
The most useful command from this package is snmpwalk, which takes an OID node as an argument and tries to discover all subnode OIDs. This command uses the SNMP operation getnext, which returns the next node in the tree and effectively allows you to traverse the whole subtree from the indicated node. If no OID has been specified, snmpwalk will use the default SNMP system OID (1.3.6.1.2.1) as the starting point. Listing 1-1 demonstrates the snmpwalk command issued against a laptop running Fedora Linux.
Listing 1-1. An example of the snmpwalk command
$ snmpwalk -c public -On 192.168.1.68
.1.3.6.1.2.1.1.1.0 = STRING: Linux fedolin.example.com 2.6.32.11-99.fc12.i686 #1 SMP Mon Apr 5 16:32:08 EDT 2010 i686
.1.3.6.1.2.1.1.2.0 = OID: .1.3.6.1.4.1.8072.3.2.10 .1.3.6.1.2.1.1.3.0 = Timeticks: (110723) 0:18:27.23
.1.3.6.1.2.1.1.4.0 = STRING: Administrator ([email protected]) .1.3.6.1.2.1.1.5.0 = STRING: fedolin.example.com
.1.3.6.1.2.1.1.6.0 = STRING: MyLocation, MyOrganization, MyStreet, MyCity, MyCountry .1.3.6.1.2.1.1.8.0 = Timeticks: (3) 0:00:00.03
.1.3.6.1.2.1.1.9.1.2.1 = OID: .1.3.6.1.6.3.10.3.1.1 .1.3.6.1.2.1.1.9.1.2.2 = OID: .1.3.6.1.6.3.11.3.1.1 .1.3.6.1.2.1.1.9.1.2.3 = OID: .1.3.6.1.6.3.15.2.1.1 .1.3.6.1.2.1.1.9.1.2.4 = OID: .1.3.6.1.6.3.1
.1.3.6.1.2.1.1.9.1.2.5 = OID: .1.3.6.1.2.1.49 .1.3.6.1.2.1.1.9.1.2.6 = OID: .1.3.6.1.2.1.4 .1.3.6.1.2.1.1.9.1.2.7 = OID: .1.3.6.1.2.1.50 .1.3.6.1.2.1.1.9.1.2.8 = OID: .1.3.6.1.6.3.16.2.2.1
.1.3.6.1.2.1.1.9.1.3.1 = STRING: The SNMP Management Architecture MIB.
.1.3.6.1.2.1.1.9.1.3.2 = STRING: The MIB for Message Processing and Dispatching. .1.3.6.1.2.1.1.9.1.3.3 = STRING: The management information definitions for the SNMP User-based Security Model.
.1.3.6.1.2.1.1.9.1.3.4 = STRING: The MIB module for SNMPv2 entities
.1.3.6.1.2.1.1.9.1.3.5 = STRING: The MIB module for managing TCP implementations .1.3.6.1.2.1.1.9.1.3.6 = STRING: The MIB module for managing IP and ICMP
implementations
.1.3.6.1.2.1.1.9.1.3.7 = STRING: The MIB module for managing UDP implementations .1.3.6.1.2.1.1.9.1.3.8 = STRING: View-based Access Control Model for SNMP. .1.3.6.1.2.1.1.9.1.4.1 = Timeticks: (3) 0:00:00.03
.1.3.6.1.2.1.2.2.1.1.1 = INTEGER: 1 .1.3.6.1.2.1.2.2.1.1.2 = INTEGER: 2 .1.3.6.1.2.1.2.2.1.1.3 = INTEGER: 3 .1.3.6.1.2.1.2.2.1.1.4 = INTEGER: 4 .1.3.6.1.2.1.2.2.1.1.5 = INTEGER: 5 .1.3.6.1.2.1.2.2.1.2.1 = STRING: lo .1.3.6.1.2.1.2.2.1.2.2 = STRING: eth0 .1.3.6.1.2.1.2.2.1.2.3 = STRING: wlan1 .1.3.6.1.2.1.2.2.1.2.4 = STRING: pan0 .1.3.6.1.2.1.2.2.1.2.5 = STRING: virbr0
.1.3.6.1.2.1.2.2.1.3.1 = INTEGER: softwareLoopback(24) .1.3.6.1.2.1.2.2.1.3.2 = INTEGER: ethernetCsmacd(6) .1.3.6.1.2.1.2.2.1.3.3 = INTEGER: ethernetCsmacd(6) .1.3.6.1.2.1.2.2.1.3.4 = INTEGER: ethernetCsmacd(6) .1.3.6.1.2.1.2.2.1.3.5 = INTEGER: ethernetCsmacd(6) .1.3.6.1.2.1.2.2.1.4.1 = INTEGER: 16436
.1.3.6.1.2.1.2.2.1.4.2 = INTEGER: 1500 .1.3.6.1.2.1.2.2.1.4.3 = INTEGER: 1500 .1.3.6.1.2.1.2.2.1.4.4 = INTEGER: 1500 .1.3.6.1.2.1.2.2.1.4.5 = INTEGER: 1500 .1.3.6.1.2.1.2.2.1.5.1 = Gauge32: 10000000 .1.3.6.1.2.1.2.2.1.5.2 = Gauge32: 0
.1.3.6.1.2.1.2.2.1.5.3 = Gauge32: 10000000 .1.3.6.1.2.1.2.2.1.5.4 = Gauge32: 10000000 .1.3.6.1.2.1.2.2.1.5.5 = Gauge32: 10000000 .1.3.6.1.2.1.2.2.1.6.1 = STRING:
.1.3.6.1.2.1.2.2.1.6.2 = STRING: 0:d:56:7d:68:b0 .1.3.6.1.2.1.2.2.1.6.3 = STRING: 0:90:4b:64:7b:4d .1.3.6.1.2.1.2.2.1.6.4 = STRING: 4e:e:b8:9:81:3b .1.3.6.1.2.1.2.2.1.6.5 = STRING: d6:f9:7c:2c:17:28 .1.3.6.1.2.1.2.2.1.7.1 = INTEGER: up(1)
.1.3.6.1.2.1.2.2.1.7.2 = INTEGER: up(1) .1.3.6.1.2.1.2.2.1.7.3 = INTEGER: up(1) .1.3.6.1.2.1.2.2.1.7.4 = INTEGER: down(2) .1.3.6.1.2.1.2.2.1.7.5 = INTEGER: up(1) .1.3.6.1.2.1.2.2.1.8.1 = INTEGER: up(1) .1.3.6.1.2.1.2.2.1.8.2 = INTEGER: down(2) .1.3.6.1.2.1.2.2.1.8.3 = INTEGER: up(1) .1.3.6.1.2.1.2.2.1.8.4 = INTEGER: down(2) .1.3.6.1.2.1.2.2.1.8.5 = INTEGER: up(1)
.1.3.6.1.2.1.2.2.1.9.1 = Timeticks: (0) 0:00:00.00 .1.3.6.1.2.1.2.2.1.9.2 = Timeticks: (0) 0:00:00.00 .1.3.6.1.2.1.2.2.1.9.3 = Timeticks: (0) 0:00:00.00 .1.3.6.1.2.1.2.2.1.9.4 = Timeticks: (0) 0:00:00.00 .1.3.6.1.2.1.2.2.1.9.5 = Timeticks: (0) 0:00:00.00 .1.3.6.1.2.1.2.2.1.10.1 = Counter32: 89275
CHAPTER 1 ■ READING AND COLLECTING PERFORMANCE DATA USING SNMP
.1.3.6.1.2.1.2.2.1.10.3 = Counter32: 11649462 .1.3.6.1.2.1.2.2.1.10.4 = Counter32: 0
.1.3.6.1.2.1.2.2.1.19.5 = Counter32: 0 .1.3.6.1.2.1.2.2.1.20.1 = Counter32: 0 .1.3.6.1.2.1.2.2.1.20.2 = Counter32: 0 .1.3.6.1.2.1.2.2.1.20.3 = Counter32: 0 .1.3.6.1.2.1.2.2.1.20.4 = Counter32: 0 .1.3.6.1.2.1.2.2.1.20.5 = Counter32: 0 .1.3.6.1.2.1.2.2.1.21.1 = Gauge32: 0 .1.3.6.1.2.1.2.2.1.21.2 = Gauge32: 0 .1.3.6.1.2.1.2.2.1.21.3 = Gauge32: 0 .1.3.6.1.2.1.2.2.1.21.4 = Gauge32: 0 .1.3.6.1.2.1.2.2.1.21.5 = Gauge32: 0 .1.3.6.1.2.1.2.2.1.22.1 = OID: .0.0 .1.3.6.1.2.1.2.2.1.22.2 = OID: .0.0 .1.3.6.1.2.1.2.2.1.22.3 = OID: .0.0 .1.3.6.1.2.1.2.2.1.22.4 = OID: .0.0 .1.3.6.1.2.1.2.2.1.22.5 = OID: .0.0
.1.3.6.1.2.1.25.1.1.0 = Timeticks: (8232423) 22:52:04.23
.1.3.6.1.2.1.25.1.1.0 = No more variables left in this MIB View (It is past the end of the MIB tree)
As an exercise, try to identify some of the listed OIDs using Tables 1-1 and 1-2 and find out what they mean.
Querying SNMP Devices from Python
Now we know enough about SNMP to start working on our own management system, which will be querying the configured systems on regular intervals. First let’s specify the configuration that we will be using in the application.
Configuring the Application
As we already know, we need the following information available for every check:
• An IP address or resolvable domain name of the system that runs the SNMP agent software
• The read-only community string that will be used to authenticate with the agent software
• The OID node’s numerical representation
We are going to use the Windows INI-style configuration file, because of its simplicity. Python includes a configuration parsing module by default, so it is also convenient to use. Chapter 9 discusses the ConfigParser module in great detail; please refer to that chapter for more information about the module.
CHAPTER 1 ■ READING AND COLLECTING PERFORMANCE DATA USING SNMP
Listing 1-2. The management system configuration file
[system_1]
description=My Laptop address=192.168.1.68 port=161
communityro=public
[check_1]
description=WLAN incoming traffic oid=1.3.6.1.2.1.2.2.1.10.3
system=system_1
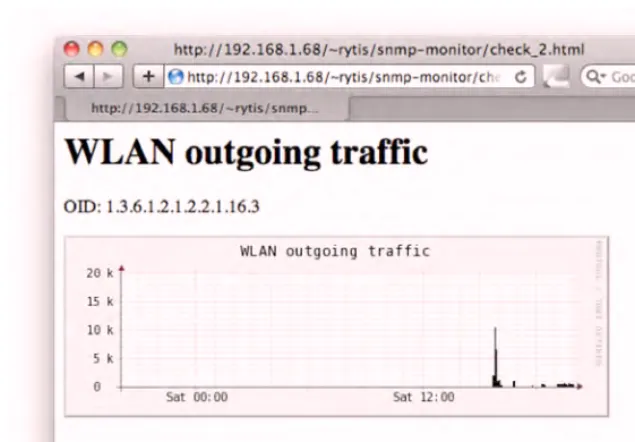
[check_2]
description=WLAN incoming traffic oid=1.3.6.1.2.1.2.2.1.16.3
system=system_1
Make sure that the system and check section IDs are unique, or you may get unpredictable results. We’re going to create an SnmpManager class with two methods, one to add a system and the other to add a check. As the check contains the system ID string, it will automatically be assigned to that particular system. In Listing 1-3 you can see the class definition and also the initialization part that reads in the configuration and iterates through the sections and updates the class object accordingly.
Listing 1-3. Reading and storing the configuration
import sys
from ConfigParser import SafeConfigParser
class SnmpManager: def __init__(self): self.systems = {}
def add_system(self, id, descr, addr, port, comm_ro): self.systems[id] = {'description' : descr,
'address' : addr, 'port' : int(port), 'communityro' : comm_ro, 'checks' : {} }
def add_check(self, id, oid, descr, system):
oid_tuple = tuple([int(i) for i in oid.split('.')])
def main(conf_file=""): if not conf_file: sys.exit(-1)
config = SafeConfigParser() config.read(conf_file) snmp_manager = SnmpManager()
for system in [s for s in config.sections() if s.startswith('system')]: snmp_manager.add_system(system,
config.get(system, 'description'), config.get(system, 'address'), config.get(system, 'port'),
config.get(system, 'communityro'))
for check in [c for c in config.sections() if c.startswith('check')]: snmp_manager.add_check(check,
config.get(check, 'oid'),
config.get(check, 'description'), config.get(check, 'system'))
As you see in the example, we first have to iterate through the system sections and update the object before proceeding with the check sections.
■Note This order is important, because if we try to add a check for a system that hasn’t been inserted yet, we’ll get a dictionary index error.
Also note that we are converting the OID string to a tuple of integers. You’ll see why we have to do this later in this section. The configuration file is loaded and we’re ready to run SNMP queries against the configured devices.
Using the PySNMP Library
In this project we are going to use the PySNMP library, which is implemented in pure Python and doesn’t depend on any precompiled libraries. The pysnmp package is available for most Linux distributions and can be installed using the standard distribution package manager. In addition to pysnmp you will also need the ASN.1 library, which is used by pysnmp and is also available as part of the Linux distribution package selection. For example, on a Fedora system you can install the pysnmp module with the following commands:
$ sudo yum install pysnmp
$ sudo yum install python-pyasn1
Alternatively, you can use the Python Package manager (PiP) to install this library for you:
CHAPTER 1 ■ READING AND COLLECTING PERFORMANCE DATA USING SNMP
If you don’t have the pip command available, you can download and install this tool from http:// pypi.python.org/pypi/pip. We will use it in later chapters as well.
The PySNMP library hides all the complexity of SNMP processing behind a single class with a simple API. All you have to do is create an instance of the CommandGenerator class. This class is available from the pysnmp.entity.rfc3413.oneliner.cmdgen module and implements most of the standard SNMP protocol commands: getCmd(), setCmd() and nextCmd(). Let’s look at each of those in more detail.
The SNMP GET Command
All the commands we are going to discuss follow the same invocation pattern: import the module, create an instance of the CommandGenerator class, create three required parameters (an authentication object, a transport target object, and a list of arguments), and finally invoke the appropriate method. The method returns a tuple containing the error indicators (if there was an error) and the result object.
In Listing 1-4, we query a remote Linux machine using the standard SNMP OID (1.3.6.1.2.1.1.1.0).
Listing 1-4. An example of the SNMP GET command
>>> from pysnmp.entity.rfc3413.oneliner import cmdgen >>> cg = cmdgen.CommandGenerator()
>>> comm_data = cmdgen.CommunityData('my-manager', 'public') >>> transport = cmdgen.UdpTransportTarget(('192.168.1.68', 161)) >>> variables = (1, 3, 6, 1, 2, 1, 1, 1, 0)
>>> errIndication, errStatus, errIndex, result = cg.getCmd(comm_data, transport, variables)
>>> print errIndication None
>>> print errStatus 0
>>> print errIndex 0
>>> print result
[(ObjectName('1.3.6.1.2.1.1.1.0'), OctetString('Linux fedolin.example.com
2.6.32.11-99.fc12.i686 #1 SMP Mon Apr 5 16:32:08 EDT 2010 i686'))] >>>
Let’s look at some steps more closely. When we initiate the community data object, we have provided two strings—the community string (the second argument) and the agent or manager security name string; in most cases this can be any string. An optional parameter specifies the SNMP version to be used (it defaults to SNMP v2c). If you must query version 1 devices, use the following command:
>>> comm_data = cmdgen.CommunityData('my-manager', 'public', mpModel=0)
The transport object is initiated with the tuple containing either the fully qualified domain name or the IP address string and the integer port number.
Finally, we call the API command getCmd(), which implements the SNMP GET command, and pass these three objects as its arguments. The command returns a tuple, each element of which is described in Table 1-3.
Table 1-3. CommandGenerator Return Objects
Tuple Element Description
errIndication If this string is not empty, it indicates the SNMP engine error.
errStatus If this element evaluates to True, it indicates an error in the SNMP communication; the object that generated the error is indicated by the errIndex element.
errIndex If the errStatus indicates that an error has occurred, this field can be used to find the SNMP object that caused the error. The object position in the result array is
errIndex-1.
result This element contains a list of all returned SNMP object elements. Each element is a tuple that contains the name of the object and the object value.
The SNMP SET Command
The SNMP SET command is mapped in PySNMP to the setCmd() method call. All parameters are the same; the only difference is that the variables section now contains a tuple: the OID and the new value. Let’s try to use this command to change a read-only object; Listing 1-5 shows the command-line sequence.
Listing 1-5. An example of the SNMP SET command
>>> from pysnmp.entity.rfc3413.oneliner import cmdgen >>> from pysnmp.proto import rfc1902
>>> cg = cmdgen.CommandGenerator()
>>> comm_data = cmdgen.CommunityData('my-manager', 'public') >>> transport = cmdgen.UdpTransportTarget(('192.168.1.68', 161))
>>> variables = ((1, 3, 6, 1, 2, 1, 1, 1, 0), rfc1902.OctetString('new system description'))
>>> errIndication, errStatus, errIndex, result = cg.setCmd(comm_data, transport, variables)
>>> print errIndication None
>>> print errStatus 6
CHAPTER 1 ■ READING AND COLLECTING PERFORMANCE DATA USING SNMP
1
>>> print errStatus.prettyPrint() noAccess(6)
>>> print result
[(ObjectName('1.3.6.1.2.1.1.1.0'), OctetString('new system description'))] >>>
What happened here is that we tried to write to a read-only object, and that resulted in an error. What’s interesting in this example is how we format the parameters. You have to convert strings to SNMP object types; otherwise; they won’t pass as valid arguments. Therefore the string had to be encapsulated in an instance of the OctetString class. You can use other methods of the rfc1902 module if you need to convert to other SNMP types; the methods include Bits(), Counter32(), Counter64(), Gauge32(), Integer(), Integer32(), IpAddress(), OctetString(), Opaque(), TimeTicks(), and Unsigned32(). These are all class names that you can use if you need to convert a string to an object of a specific type.
The SNMP GETNEXT Command
The SNMP GETNEXT command is implemented as the nextCmd() method. The syntax and usage are identical to getCmd(); the only difference is that the result is a list of objects that are immediate child nodes of the specified OID node.
Let’s use this command to query all objects that are immediate child nodes of the SNMP system OID (1.3.6.1.2.1.1); Listing 1-6 shows the nextCmd() method in action.
Listing 1-6. An example of the SNMP GETNEXT command
>>> from pysnmp.entity.rfc3413.oneliner import cmdgen >>> cg = cmdgen.CommandGenerator()
>>> comm_data = cmdgen.CommunityData('my-manager', 'public') >>> transport = cmdgen.UdpTransportTarget(('192.168.1.68', 161)) >>> variables = (1, 3, 6, 1, 2, 1, 1)
>>> errIndication, errStatus, errIndex, result = cg.nextCmd(comm_data, transport, variables)
>>> print errIndication requestTimedOut
>>> errIndication, errStatus, errIndex, result = cg.nextCmd(comm_data, transport, variables)
>>> print errIndication None
>>> print errStatus 0
>>> print errIndex 0
>>> for object in result: ... print object
[(ObjectName('1.3.6.1.2.1.1.1.0'), OctetString('Linux fedolin.example.com 2.6.32.11-99.fc12.i686 #1 SMP Mon Apr 5 16:32:08 EDT 2010 i686'))]
[(ObjectName('1.3.6.1.2.1.1.2.0'), ObjectIdentifier('1.3.6.1.4.1.8072.3.2.10'))] [(ObjectName('1.3.6.1.2.1.1.3.0'), TimeTicks('340496'))]
[(ObjectName('1.3.6.1.2.1.1.4.0'), OctetString('Administrator ([email protected])'))]
[(ObjectName('1.3.6.1.2.1.1.5.0'), OctetString('fedolin.example.com'))] [(ObjectName('1.3.6.1.2.1.1.6.0'), OctetString('MyLocation, MyOrganization,
MyStreet, MyCity, MyCountry'))]
[(ObjectName('1.3.6.1.2.1.1.8.0'), TimeTicks('3'))]
[(ObjectName('1.3.6.1.2.1.1.9.1.2.1'), ObjectIdentifier('1.3.6.1.6.3.10.3.1.1'))] [(ObjectName('1.3.6.1.2.1.1.9.1.2.2'), ObjectIdentifier('1.3.6.1.6.3.11.3.1.1'))] [(ObjectName('1.3.6.1.2.1.1.9.1.2.3'), ObjectIdentifier('1.3.6.1.6.3.15.2.1.1'))] [(ObjectName('1.3.6.1.2.1.1.9.1.2.4'), ObjectIdentifier('1.3.6.1.6.3.1'))]
[(ObjectName('1.3.6.1.2.1.1.9.1.2.5'), ObjectIdentifier('1.3.6.1.2.1.49'))] [(ObjectName('1.3.6.1.2.1.1.9.1.2.6'), ObjectIdentifier('1.3.6.1.2.1.4'))] [(ObjectName('1.3.6.1.2.1.1.9.1.2.7'), ObjectIdentifier('1.3.6.1.2.1.50'))] [(ObjectName('1.3.6.1.2.1.1.9.1.2.8'), ObjectIdentifier('1.3.6.1.6.3.16.2.2.1'))] [(ObjectName('1.3.6.1.2.1.1.9.1.3.1'), OctetString('The SNMP Management
Architecture MIB.'))]
[(ObjectName('1.3.6.1.2.1.1.9.1.3.2'), OctetString('The MIB for Message Processing and Dispatching.'))]
[(ObjectName('1.3.6.1.2.1.1.9.1.3.3'), OctetString('The management information
definitions for the SNMP User-based Security Model.'))]
[(ObjectName('1.3.6.1.2.1.1.9.1.3.4'), OctetString('The MIB module for SNMPv2 entities'))]
[(ObjectName('1.3.6.1.2.1.1.9.1.3.5'), OctetString('The MIB module for managing TCP implementations'))]
[(ObjectName('1.3.6.1.2.1.1.9.1.3.6'), OctetString('The MIB module for managing IP
and ICMP implementations'))]
[(ObjectName('1.3.6.1.2.1.1.9.1.3.7'), OctetString('The MIB module for managing UDP implementations'))]
[(ObjectName('1.3.6.1.2.1.1.9.1.3.8'), OctetString('View-based Access Control Model for SNMP.'))]
[(ObjectName('1.3.6.1.2.1.1.9.1.4.1'), TimeTicks('3'))] [(ObjectName('1.3.6.1.2.1.1.9.1.4.2'), TimeTicks('3'))] [(ObjectName('1.3.6.1.2.1.1.9.1.4.3'), TimeTicks('3'))] [(ObjectName('1.3.6.1.2.1.1.9.1.4.4'), TimeTicks('3'))] [(ObjectName('1.3.6.1.2.1.1.9.1.4.5'), TimeTicks('3'))] [(ObjectName('1.3.6.1.2.1.1.9.1.4.6'), TimeTicks('3'))] [(ObjectName('1.3.6.1.2.1.1.9.1.4.7'), TimeTicks('3'))] [(ObjectName('1.3.6.1.2.1.1.9.1.4.8'), TimeTicks('3'))] >>>
CHAPTER 1 ■READING AND COLLECTING PERFORMANCE DATA USING SNMP
Implementing the SNMP Read Functionality
Let’s implement the read functionality in our application. The workflow will be as follows: we need to iterate through all systems in the list, and for each system we iterate through all defined checks. For each check we are going to perform the SNMP GET command and store the result in the same data structure.
For debugging and testing purposes we will add some print statements to verify that the application is working as expected. Later we’ll replace those print statements with the RRDTool database store commands. I’m going to call this method query_all_systems(). Listing 1-7 shows the code.
Listing 1-7. Querying all defined SNMP objects
def query_all_systems(self): cg = cmdgen.CommandGenerator() for system in self.systems.values():
comm_data = cmdgen.CommunityData('my-manager', system['communityro']) transport = cmdgen.UdpTransportTarget((system['address'], system['port'])) for check in system['checks'].values():
oid = check['oid']
errInd, errStatus, errIdx, result = cg.getCmd(comm_data, transport, oid) if not errInd and not errStatus:
print "%s/%s -> %s" % (system['description'], check['description'], str(result[0][1]))
If you run the tool you’ll get results similar to these (assuming you correctly pointed your configuration to the working devices that respond to the SNMP queries):
$ ./snmp-manager.py
My Laptop/WLAN outgoing traffic -> 1060698 My Laptop/WLAN incoming traffic -> 14305766
Now we’re ready to write all this data to the RRDTool database.
Storing Data with RRDTool
RRDTool is an application developed by Tobias Oetiker, which has become a de-facto standard for graphing monitoring data. The graphs produced by RRDTool are used in many different monitoring tools, such as Nagios, Cacti, and so on. In this section we’ll look at the structure of the RRTool database and the application itself. We’ll discuss the specifics of the round-robin database, how to add new data to it, and how to retrieve it later on. We will also look at the data-plotting commands and techniques. And finally we’ll integrate the RRDTool database with our application.
Introduction to RRDTool
complex data-manipulation tasks, such as data-resampling and rate calculations. And finally, it allows you to create sophisticated graphs incorporating data from various source databases.
Let’s start by looking at the round robin database structure. I must apologize for the number of acronyms that you’ll come across in this section, but it is important to mention them here, as they all are used in the configuration of RRDTool, so it is vital to become familiar with them.
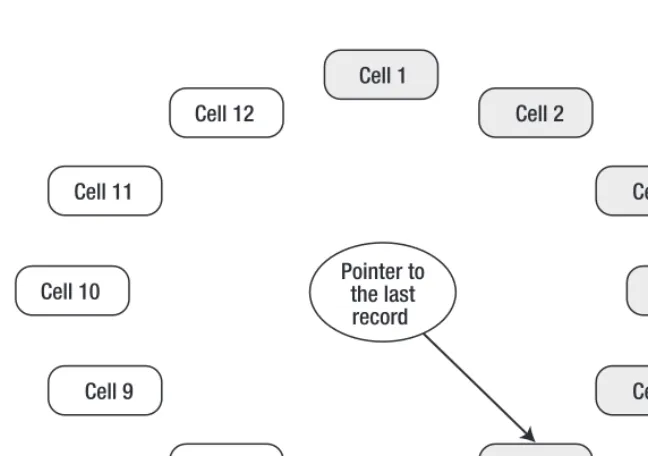
[image:43.612.58.382.185.413.2]The first property that makes an RRD different from conventional databases is that the database has a limited size. This means that the database size is known at the time it is initialized, and the size never changes. New records overwrite old data, and that process is repeated over and over again. Figure 1-3 shows a simplified version of the RRD, to help you to visualize the structure.
Figure 1-3. The RRD structure
Let’s assume that we have initialized a database that is capable of holding 12 records, each in its own cell. When the database is empty, we start by writing data to cell number 1. We also update the pointer with the ID of the last cell we’ve written the data to. Figure 1-3 shows that 6 records have already been written to the database (as represented by the grayed-out boxes). The pointer is on cell 6, and so when the next write instruction is received, the database will write it to the next cell (cell 7) and update the pointer accordingly. Once the last cell (cell 12) is reached, the process starts again, from cell number 1.
The RRD data store’s only purpose is to store performance data, and therefore it does not require maintaining complex relations between different data tables. In fact, there are no tables in the RRD, only the individual data sources (DSs).
CHAPTER 1 ■ READING AND COLLECTING PERFORMANCE DATA USING SNMP
The data that is stored in the RDD is called a RoundRobin Archive (RRA). The RRA is what makes the RRD so useful. It allows you to consolidate the data gathered from the DS by applying an available consolidation function (CF). You can specify one of the four CFs (average, min, max and last) that will be applied to a number of the actual data records. The result is stored in a round-robin “table”. You can store multiple RRAs in your database with different granularity. For example, one RRA stores average values of the last 10 records, and the other one stores an average of the last 100.
This will all come together when we look at the usage scenarios in the next sections.
Using RRDTool from a Python Program
Before we start creating the RRDTool databases, let’s look at the Python module that provides the API to RRDTool. The module we are going to use in this chapter is called the Python RRDTool and is available to download at http://sourceforge.net/projects/py-rrdtool/.
However, most Linux distributions have this already prepackaged and available to install using the standard package management tool. For example, on a Fedora system you would run the following command to install the Python RRDTool module:
$ sudo yum install rrdtool-python
Once the package is installed, you can validate that the installation was successful:
$ python
Python 2.6.2 (r262:71600, Jan 25 2010, 18:46:45) [GCC 4.4.2 20091222 (Red Hat 4.4.2-20)] on linux2
Type "help", "copyright", "credits" or "license" for more information. >>> import rrdtool
>>> rrdtool.__version__ '$Revision: 1.14 $' >>>
Creating a RoundRobin Database
Let’s start by creating a simple database. The database we are going to create will have one data source, which is a simple increasing counter. The counter value increases over time. A classical example of such a counter is bytes transmitted over the interface. The readings are performed every 5 minutes.
We also are going to define two RRAs. One is to average over a single reading, which effectively instructs RRDTool to store the actual values, and the other will average over 6 measurements. Following is an example of the command-line tool syntax for creating this database:
$ rrdtool create interface.rrd \ > DS:packets:COUNTER:600:U:U \ > RRA:AVERAGE:0.5:1:288 \ > RRA:AVERAGE:0.5:6:336
>>> import rrdtool
>>> rrdtool.create('interface.rrd',
... 'DS:packets:COUNTER:600:U:U', ... 'RRA:AVERAGE:0.5:1:288', ... 'RRA:AVERAGE:0.5:6:336') >>>
The structure of the DS (data source) definition line is
DS:<name>:<DS type>:<heartbeat>:<lower limit>:<upper limit>
Thename field is what you name this particular data source. Since RRD allows you to store the data from multiple data sources you must provide a unique name to each so that you can access them later. If you need to define more than one data source, simply add another DS line.
The DS type (or data source type) field indicates what type of data will be supplied to this data source. There are four types available: COUNTER, GAUGE, DERIVE and ABSOLUTE:
• The COUNTER type means that the measurement value is increasing over time. To calculate a rate, RRDTool subtracts the last value from the current and divides by the measurement step (or sampling rate) to obtain the rate figure. If the result is a negative number, it needs to compensate for the counter rollover. A typical use is monitoring ever-increasing counters, such as total number of bytes transmitted through the interface.
• The DERIVE type is similar to COUNTER, but it also allows for a negative rate. You can use this t