A DAILY REPORT
by
Md Hasinur Rahaman Khan, PhD
Associate Professor of Applied Statistics
University of Dhaka, Bangladesh
Report Number: 23-30042020
INTRODUCTION
NEW
What is Covid-19?
First Covid-19 Infection in Bangladesh
Current Statistics (as of April 29)
Infection growth rate
1.77
Active case rate
95.6%
Test increased in 24h
Cases per 100 tests
11.9
Recovery rate
2.1%
636
7103
150
No of tests in last 24h
163
6790
4968
59698
1
Male cases (Ap 23)
2.3
43
2846
11
1
Female cases (Ap 23)
8
363
1340
Total infections:
Total deaths:
Total tests:
Case fatality rate:
Covid-19 (Coronavirus) in Bangladesh
According to Wikipedia [1], coronavirus disease 2019 (COVID-19) is an infectious disease caused by severe acute respiratory syndrome coronavirus (SARS-CoV-2). The disease was first identified in December 2019 in Wuhan, the capital of China's Hubei province, and has since spread globally, resulting in the ongoing 2019–20 coronavirus pandemic. Common symptoms include fever, cough and shortness of breath. Other symptoms may include fatigue, muscle pain, diarrhea, sore throat, loss of smell and abdominal pain.
On 8 March, the first three coronavirus cases were confirmed. The IEDCR director Prof. Meerjady Sabrina Flora announced at a press conference that 2 men and 1 woman had tested positive for COVID-19. The patients were aged between 20 and 35. Of them, two men were Italy returnees and the woman was a family member of one of these two. Approximately about 111 tests were conducted in Bangladesh.
No. of days to double infections:
Total recovered:
Total active cases:
Current serious critical:
Total cases per 1 million:
Deaths per 1 million:
Test per 1 million:
This report is published by the author himself and the research results are based on the reported data including other secondary sources. The main objective of this report is to analyse the current situation of coronavirus in Bangladesh and to predict Covid-19 infections, deaths and other parameters on daily basis.
New projection (until May 15) added. Plots of daily deaths, infections, test vs infection added. Changes in report structure added
Highest number of
infections in a day so
far is 641 that was
reported on April 29.
First infection was
reported on March
8, 2020.
Figure 2: Daily infections of COVID-19 in Bangladesh
Highest number of
deaths in a day so
far is 15 that was
reported on April 17.
First death was
reported on March
18, 2020.
Figure 1: Daily deaths of COVID-19 in Bangladesh
00 00 00 00 00 1 00 1 0 11 1 00 00 00
0 1
00 2
1 3 5
1 3 6
4 5 7
4 10 15
9
7 9 10
10 7
4 5 9
7
3 8
0.0 2.0 4.0 6.0 8.0 10.0 12.0 14.0 16.0
8-Mar
11-Mar
14-Mar
17-Mar
20-Mar
23-Mar
26-Mar
29-Mar
1-Apr
4-Apr
7-Apr
10-Apr
13-Apr
16-Apr
19-Apr
22-Apr
25-Apr
28-Apr
Daily deaths
3 00 00 0023 0027
7 366 054 00 1223 25918
3554 112 94
58 139 182
209219 341 266 306312
492 434 390414 503
309 418 497 549
641
0.0 100.0 200.0 300.0 400.0 500.0 600.0 700.0
8-Mar
11-Mar
14-Mar
17-Mar
20-Mar
23-Mar
26-Mar
29-Mar
1-Apr
4-Apr
7-Apr
10-Apr
13-Apr
16-Apr
19-Apr
22-Apr
25-Apr
28-Apr
Figure 3: Days to double the number of infections and deaths of COVID-19 in
Bangladesh
Figure 4: Case fatality rate, infections growth rate and confirm case rate per 100 tests of COVID-19
in Bangladesh
Doubling time was
much smaller in the
beginning of April
but it increases as
days goes for both
deaths and
infections. The
growth of doubling
time for deaths
recently gets faster
than that of
infections.
3 3 3 4 4
5 5 6
5 6
5 5 5 6 5 6 6 7 8 9 10 10 11
3 3 3
2 3 3
4 4 3
4 4 4 4
5 5 5 5
6 6 6 7 7 8
0
2
4
6
8
10
12
7 -Ap r 8 -Ap r 9 -Ap r 10 -… 11 -… 12 -… 13 -… 14 -… 15 -… 16 -… 17 -… 18 -… 19 -… 20 -… 21 -… 22 -… 23 -… 24 -… 25 -… 26 -… 27 -… 28 -… 29 -…No
o
f d
ay
s
Death doubling day Infection doubling day
0.00.00.00.00.00.00.00.00.00.0 12.5 10.0 5.9 8.3 7.4 9.110.3 12.8 11.4
10.410.410.410.29.8 15.7
14.816.114.815.7 13.6 10.4 9.2 6.46.46.2 5.54.94.5 4.13.84.13.93.73.43.33.23.02.82.82.72.62.42.3 0.00.00.00.00.00.00.0 7.4 10.7 0.00.0 4.3 19.419.4 4.6 10.7 6.5 0.0 4.03.8 0.00.00.71.41.3 2.1 0.41.2 2.53.9 5.25.5 10.2 7.9 6.1
10.411.611.0 12.6 16.9 12.1 14.5 11.8 17.7 14.6 12.612.113.6
9.3
12.013.012.712.9
-5.0 0.0 5.0 10.0 15.0 20.0 25.0 30.0 35.0 9 -Ma r 11 -Ma r 13 -Ma r 15 -Ma r 17 -Ma r 19 -Ma r 21 -Ma r 23 -Ma r 25 -Ma r 27 -Ma r 29 -Ma r 31 -Ma r 2 -Ap r 4 -Ap r 6 -Ap r 8 -Ap r 10 -Ap r 12 -Ap r 14 -Ap r 16 -Ap r 18 -Ap r 20 -Ap r 22 -Ap r 24 -Ap r 26 -Ap r 28 -Ap r
Ra
te
Day
0.68 0.32
Very strong positive correlation is
found between the number of
tests conducted in last 24 hours
and the reported number of
infections by analysing data of
April month. The reported
correlation coefficient is
0.98
Sex ratio (males to females) in
infected pop. Is (as of Ap23)
Figure 5: Scatter plot bet. no. of tests and repoted no. of
infections based on April data.
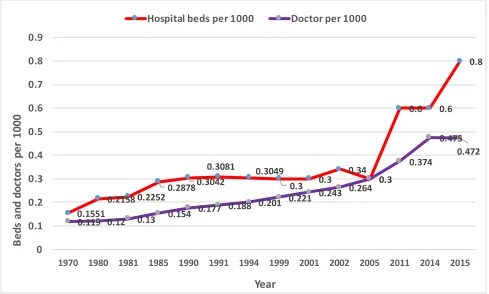
Figure 6: Number of beds and doctors per 1000 in Bangladesh (data source: our world in data)
0100 200 300 400 500 600 700
0 1000 2000 3000 4000 5000 6000
No
o
f r
ep
or
te
d
in
fe
ct
io
ns
Tests in last 24 hours
0.1551
0.2158 0.22520.28780.3042
0.3081 0.3049
0.3 0.3
0.34 0.3
0.6 0.6
0.8
0.119 0.12 0.13 0.154 0.177
0.188 0.201 0.221 0.243
0.264 0.3
0.374 0.475
0.472
0 0.1 0.2 0.3 0.4 0.5 0.6 0.7 0.8 0.9
1970 1980 1981 1985 1990 1991 1994 1999 2001 2002 2005 2011 2014 2015
Be
ds
a
nd
d
oc
to
rs
p
er
1
00
0
Year
PROJECTION
Projection for Infections
Figure 6 describes how the capacity of the healthcare system in Bangladesh has been evolving over
the years. The figure shows two curves: the red curve for the number of hospital beds per 1000
people and the black curve for the number of doctors per 1000 people for the period 1970-2015. For
some of the years, the ratios have been estimated through interpolation method before drawing this
figure. It is seen that there was an increasing trend in the number of hospital beds per 1000 people
from 1970 to 1991 during which the ratio increased from 0.1551 to 0.3081. Over the next 11 years
the ratio remained relatively steady and then increased sharply after 2005 reaching a value of 0.8 per
1000 people in 2015. Thus, there has been a 166.6% increase in the number of hospital beds per 1000
people during 2005-2015 indicating significant improvements in healthcare infrastructure in the
country. Figure 6 shows that there has been a slow exponential growth in the number of doctors per
1000 people during the 45 year period.
Figure 7: Projected and Actual Covid-19 Cumulative Infections in Bangladesh until May 15, 2020.
Full projection data is given at the end of this report in Table-A including 95% CI in Table-B.
Covid-19 cumulative infection cases are projected based on the 2nd order polynomial regression. The first projection was made on April 12 based on April-1 to 11 data. This projection was revised on April 19 based on April 1-18 data. This projection was revised on April 30 based on April 1-30 data and this was done for
predicting for May 1-15, 2020. This polynomial regression based projection is suitable for short term projection (ref. 6). It reveals that the projection was reasonably good for making prediction for near future statistics. For example, Figure-1 shows that projectied infections (actual infections) on April 20 and 25 were 2722 (2948), 4687 (4998) and respectively. These reported infections will be updated in this graph on regular basis. It reveals that Bangladesh will cross 14816 and 19253 mark of infections by May 10 and 15 respectively.
0 5000 10000 15000 20000 25000
25
-Ap
r
26
-Ap
r
27
-Ap
r
28
-Ap
r
29
-Ap
r
30
-Ap
r
1
-Ma
y
2
-Ma
y
3
-Ma
y
4
-Ma
y
5
-Ma
y
6
-Ma
y
7
-Ma
y
8
-Ma
y
9
-Ma
y
10
-Ma
y
11
-Ma
y
12
-Ma
y
13
-Ma
y
14
-Ma
y
15
-Ma
y
To
ta
l n
o
of
c
as
es
Projection for Deaths
INFECTION AND DEATH TRAJECTORY
Figure 8: Projected
and Actual Covid-19 Cumulative Deaths in Bangladesh until May 15, 2020
Bangladesh is one of the some countries who have passed the threshold of 7000 confirmed cases, with many more countries on the cusp [2]. By comparing infection trajectories from the 100 case mark, we’re able to see a clearer picture of how quickly the virus spreadsß within similar countries like Austria, Isreal, India Belarus (see Figure 9). It is very likely that Bangladesh may experience the similar death pathways like Norway, South Korea (see Figure 10).
Covid-19 cumulative deaths are projected based on two methods--(i) the ad-hoc doubling time and (ii) the 2nd order polynomial regression. The first projection was made on April 8 using April-1 to 7 data and it was based on method (i). This projection was made for April 8-26. The projection was revised on April 27 using April 1-26 data and it was carried out by method (ii). Here the ad-hoc doubling time method is based on one fundamental assumption that Bangladesh could experience the similar doubling time pathways (5 days; average of 4 days for India and 6 days for Pakistan days as reported as of April 6) as India and Pakistan experienced. The death prrojections by this ad-hoc method was surprisingly to be very accurate from April 8 to April 21. For example, the projected deaths were 44 and 80 for April 14 and 18 respectively and the actual deaths were respectively 46 and 84. The reported deaths by IDECR will be updated in this graph on regular basis. It reveals that
Bangladesh will cross 297 and 365 mark of deaths by May 10 and 15 respectively.
0 50 100 150 200 250 300 350 400
25
-Ap
r
26
-Ap
r
27
-Ap
r
28
-Ap
r
29
-Ap
r
30
-Ap
r
1
-Ma
y
2
-Ma
y
3
-Ma
y
4
-Ma
y
5
-Ma
y
6
-Ma
y
7
-Ma
y
8
-Ma
y
9
-Ma
y
10
-Ma
y
11
-Ma
y
12
-Ma
y
13
-Ma
y
14
-Ma
y
15
-Ma
y
No
o
fd
ea
th
s
CASE FATALLITY IN BANGLADESH
Figure 9: Infection Trajectory on Data Repoted on April 28, 2020 for the Countries since 100
Confirmed Cases (figure source: our world in data).
5/1/20@Hasinur
Table- A
Date
infections
Cum.
Cum.
hospital
patients*
Cum. ICU
patients*
Cum.
deaths
11-Apr
504
101
30
24
12-Apr
623
125
37
34
13-Apr
756
151
45
40
14-Apr
902
180
54
44
15-Apr
1061
212
64
48
16-Apr
1234
247
74
48
17-Apr
1421
284
85
68
18-Apr
1621
324
97
80
19-Apr
2394
479
144
88
20-Apr
2722
544
163
96
Figure 11: Current Case Fatality Rate as of April 28 Data for Bangladesh, India, Pakistan and
SriLanka (figure source: our world in data).
Figure-11 shows Bangladesh has CFR nearly similar to India but has higher CFR rate which is currently 2.6% (as of April 27) compared to other south asian countries Pakistan and SriLanka. Note that CFR stands for the case fatality rate that is the ratio between the number of confirmed deaths from the disease and the number of confirmed cases, not total cases. Full trend of CFR is reported in Figure 4.
According to reference [5], 20%
of all patients are treated as
hospital aadmitted and In
Bangladesh 6% cases go for ICU
service. The 20% patients need
hospital admissions along with
other symptomatice patients
with reasonable symptoms. We
found that by the 10-th and 15-th
of May, Bangladesh need over
889 and 1155 ICU beds whie 2963
and 3851 hospital beds for severe
patients respectively. Here the
deaths are caibrated with fitting
polynomial regression method
until May 15 . The infections are
calibrated with also by fitting
polynomial regression. The 95%
confidence interval estimates are
given in Table-B for infections,
Projection of Infections, deaths, hospital
beds and ICU beds (latest projection made
21-Apr
3072
614
184
112
22-Apr
3444
689
207
136
23-Apr
3837
767
230
160
24-Apr
4251
850
255
176
25-Apr
4687
937
281
192
26-Apr
5143
1029
309
224
27-Apr
5622
1124
337
153
28-Apr
6121
1224
367
164
29-Apr
6642
1328
399
176
30-Apr
7185
1437
431
188
1-May
8294
1659
498
192
2-May
8926
1785
536
202
3-May
9581
1916
575
213
4-May
10259
2052
616
224
5-May
10961
2192
658
236
6-May
11689
2338
701
247
7-May
12433
2487
746
259
8-May
13204
2641
792
272
9-May
13999
2800
840
284
10-May
14816
2963
889
297
11-May
15657
3131
939
310
12-May
16521
3304
991
323
13-May
17409
3482
1045
337
14-May
18319
3664
1099
351
15-May
19253
3851
1155
365
Date
11-Apr
449
560
90
112
27
34
12-Apr
558
689
112
138
33
41
13-Apr
675
836
135
167
41
50
14-Apr
802
1001
160
200
48
60
15-Apr
939
1183
188
237
56
71
16-Apr
1085
1383
217
277
65
83
17-Apr
1241
1600
248
320
74
96
18-Apr
1408
1834
282
367
84
110
19-Apr
2250
2537
450
507
135
152
20-Apr
2566
2879
513
576
154
173
21-Apr
2899
3246
580
649
174
195
22-Apr
3250
3638
650
728
195
218
23-Apr
3619
4054
724
811
217
243
24-Apr
4007
4495
801
899
240
270
25-Apr
4413
4960
883
992
265
298
*No of severe and icu patients have been estimated based on ref [5].
95% CI for cum. infections
(LT, UT)
95% CI for cum. hospital
patients (LT, UT)
95% CI for Cum. ICU patients (LT,
UT)
Table- B: 95% confidence interval for the projected infections, hospital patients, and
ICU patients as presented in Table-A. (latest projection made on April 30)
According to reference [5], 20%
of all patients are treated as
hospital aadmitted and In
Bangladesh 6% cases go for ICU
service. The 20% patients need
hospital admissions along with
other symptomatice patients
with reasonable symptoms. We
found that by the 10-th and 15-th
of May, Bangladesh need over
889 and 1155 ICU beds whie 2963
and 3851 hospital beds for severe
patients respectively. Here the
deaths are caibrated with fitting
polynomial regression method
until May 15 . The infections are
calibrated with also by fitting
polynomial regression. The 95%
confidence interval estimates are
26-Apr
4838
5449
968
1090
290
327
27-Apr
5281
5962
1056
1192
317
358
28-Apr
5743
6500
1149
1300
345
390
29-Apr
6224
7061
1245
1412
373
424
30-Apr
6724
7646
1345
1529
403
459
1-May
8105
8483
1621
1697
486
509
2-May
8730
9122
1746
1824
524
547
3-May
9377
9785
1875
1957
563
587
4-May
10046
10473
2009
2095
603
628
5-May
10736
11185
2147
2237
644
671
6-May
11449
11922
2290
2384
687
715
7-May
12183
12683
2437
2537
731
761
8-May
12940
13469
2588
2694
776
808
9-May
13718
14280
2744
2856
823
857
10-May
14518
15115
2904
3023
871
907
11-May
15340
15974
3068
3195
920
958
12-May
16184
16858
3237
3372
971
1011
13-May
17051
17767
3410
3553
1023
1066
14-May
17939
18699
3588
3740
1076
1122
15-May
18850
19656
3770
3931
1131
1179
USEFUL LINKS
2. COVID-19 Resource Centre - The Lancet. https://www.thelancet.com/coronavirus
REFERENCES
1. Wikipedia. https://en.wikipedia.org/wiki/Coronavirus. Accessed on April 7, 2020 2. Our World in Data. https://ourworldindata.org/coronavirus. Accessed April 29, 2020 3. Worldometer. https://www.worldometers.info/coronavirus. Accessed April 29, 2020 4. IEDCR. https://www.iedcr.gov.bd. Accessed April 29, 2020
How to cite:
Khan, M.H.R. (2020). Covid-19 (Coronavirus) in Bangladesh, Report No.23-30042020
5. Intensive care management of coronavirus disease 2019 (COVID-19): challenges and recommendations, Lancet resp med 2020.
1. Coronavirus disease (COVID-19) advice for the public: Myth busters. WHO.
https://www.who.int/emergencies/diseases/novel-coronavirus-2019/advice-for-public/myth-busters