Spatio-Temporal Neural Data Mining Architecture in Learning Robots
James Malone, Mark Elshaw, Ken McGarry, Chris Bowerman and Stefan Wermter
Centre for Hybrid Intelligent SystemsSchool of Computing and Technology University of Sunderland St Peter’s Way, Sunderland, SR6 0DD
UNITED KINGDOM http://www.his.sunderland.ac.uk Abstract – There has been little research into the use of
hybrid neural data mining to improve robot performance or enhance their capability. This paper presents a novel neural data mining technique that analyses robot sensor data for imitation learning. Learning by imitation allows a robot to learn from observing either another robot or a human to gain skills, understand the behaviour of others and create solutions to problems. We demonstrate a hybrid approach of differential ratio data mining to perform analysis on spatio-temporal robot behavioural data. The technique offers classification performance gains for recognition of robot actions by highlighting points of covariance and hence interest within the data.
I. INTRODUCTION
Although most robots are currently used in industry, in the next decade it is anticipated that the need for service robots for retail, leisure and health care will grow significantly [3]. However, robots are still not yet able to perform activities that are seen as routine by humans [20]. In this paper we consider the development of a hybrid neural data mining and knowledge extraction approach to aid research towards robot learning through demonstration and imitation. We examine how a robot is able to learn to recognise its own actions and those of a teacher robot so it can perform imitation and demonstration learning.
Imitation and demonstration learning allows the observer to gain skills by creating an abstract representation of the teacher's behaviour, understand the aims of the teacher and create the solution [5, 11]. Imitation can take the form of mimicking the behaviour of the demonstrator or learning how the demonstrator behaves. Robot imitation offers the opportunity for learning through demonstration and so allows non-robot programmers the chance to teach a robot.
The brain is able to achieve imitation learning through the use of the mirror neuron system [18] which involves neurons located in the F5 area of a primate’s brain being activated by both the performance of the action and its observation. The recognition of motor actions is based on the presence of a goal which implies that the motor system does not solely control movement [8]. The role of these mirror neurons is to depict actions so they are understood or can be imitated. Our long term aim is to incorporate
imitation learning techniques into an autonomous robot system. The first step of this process is to enable a robot to recognise what actions are being undertaken, without being specifically told.
We demonstrate a new hybrid combination of a neural data mining technique, namely differential ratio data mining, which can be used to identify the salient trends within spatio-temporal data combined with a neural multi-layer perceptron (MLP) classifier. Using this hybrid approach it is possible to classify this spatio-temporal robot sensor data to identify the actions performed. A comparison of networks trained on the unprocessed sensor data and the results from the data mining stage is conducted. Finally, we consider the future directions for the combination of hybrid neural data mining techniques with robotics.
II. SPATIO-TEMPORAL NEURAL DATA MINING IN ROBOTICS
Most modern robots are equipped with sensors which extract readings which are often spatial and/or temporal in nature. These sensor readings, for instance, can take the form of sonar, infra-red, laser or camera values that indicate the state of the robot at a specific time step. Hence, the amount of data that can be obtained from such robots can quickly increase as multiple sensor readings are taken over time. This has led to a growth in real-time spatio-temporal sensor readings data, which is often inherently multi-dimensional and complex in nature.
Identification of spatio-temporal objects within the data, characterising what these objects are, i.e. the class they belong to, is one major aspect of this work [4]. Similarly, in robotics, the classification of robot action data is an important area of research [7]. This would appear to be mutually beneficial, i.e. spatio-temporal data mining used as a technique to analyse robotics data, whilst the challenges of domains such as robotics motivates the need for sophisticated spatio-temporal data mining algorithms.
There has been growing interest in research into techniques to improve classification of spatio-temporal data [19]. Scalability of extremely large data sets (in terms of dimensionality or volume) has seen a growth of interest [9]
and is one example of such an area. Techniques, such as Principal Component Analysis (PCA), have been used to reduce dimensionality to a projection which represents most variance across the data. However, such techniques result in the loss of specific attribute values which are often useful when attempting to relate results to the original data. Other conventional techniques suffer from the inability to either fully or partially integrate the spatial and/or temporal elements, which renders them unsuitable to analyse such spatio-temporal data.
Fig 1. Hybrid architecture incorporating differential ratio data mining and a neural multi-layer perceptron.
Our proposed hybrid architecture is illustrated in Fig. 1. Following the initial encapsulation of robot actions into a spatio-temporal data set, the data is normalised and differential ratio data mining is performed. Then, the results of this data mining are classified using a neural multi-layer perceptron, the outputs of which are the particular type of action being executed. This enables a robot to analyse its actions and determine what class of behaviour is being performed without being told.
III. DIFFERENTIAL RATIO DATA MINING The first stage of our architecture, the spatio-temporal data analysis, is achieved through differential ratio (dFr) data mining, originally discussed by Malone et al [16]. This technique draws on some elements of ratio rules [12] and covariance measures. Ratio rules data mining is a technique that employs eigensystem analysis to calculate correlations between values of attributes. Ratio rules address the issue of reconstructing missing/hidden values as well as being able to perform ‘what-if’ type scenarios, where an item and corresponding value is required for a given set of antecedents. This technique is useful for predicting attribute trends, given empirical data, however, the process does not incorporate either spatial or temporal elements and would be unsuitable for the analysis of such data.
Covariance is a measure of how two variables change together [6]; i.e. captures the linear dependencies between variables [10]. Considering the two variables X and Y, and n objects (in this research an object is a single action), with
X taking values x(1…n) and Y values y(1…n), the sample covariance between X and Y is given in Eq. (1).
∑
= − − = n 1 i ) y )(y(i) x (x(i) n 1 Y) Cov(X, (1) Where:xis sample mean of X values yis sample mean of
Y values A. Performing differential ratio data mining
Differential ratio data mining is used to measure variation of a given object in terms of the pair-wise ratios of the elements describing the data over time. The robot data considered here is particularly suited since it contains both spatial and temporal elements, as well as complex trends of attribute variation within a single action. Consider two variables x and y as elements of a given object. Calculation of a single differential ratio (herein, differential ratio, or dFr, will be referred to as the measure of difference calculated by this process) between two time points, t and t + 1 is given by:
dFrt ⎪ ⎪ ⎭ ⎪ ⎪ ⎬ ⎫ ⎪ ⎪ ⎩ ⎪ ⎪ ⎨ ⎧ ⎟⎟ ⎠ ⎞ ⎜⎜ ⎝ ⎛ ⎟⎟ ⎠ ⎞ ⎜⎜ ⎝ ⎛ = + + 1 1 log t t t y x y xt (2) Where: x ≤y
When this is not the case, that is y < x, the variables are inverted to ensure the measures remain consistent. Since it is the magnitude of difference in ratios we are looking for, that is, how they increase or decrease together, we are not concerned with maintaining the two variables juxtaposition as numerator and denominator. When considering the instance of y < x, then the following is used;
dFrt ⎪ ⎪ ⎪ ⎭ ⎪⎪ ⎪ ⎬ ⎫ ⎪ ⎪ ⎪ ⎩ ⎪⎪ ⎪ ⎨ ⎧ ⎟ ⎟ ⎠ ⎞ ⎜ ⎜ ⎝ ⎛ ⎟ ⎟ ⎠ ⎞ ⎜ ⎜ ⎝ ⎛ = + + 1 1 log t t t x y x yt (3)
Such a calculation would be performed for a time series (t=1 … t=n) and for all pairs of variables that were deemed as representative of the dataset. For a single pair of
variables, this describes the covariance that occurs over time for a given object. This can be summarised for a series of differential ratios (dFr) for a given time series for variables x and y in the form;
Object: x,y[dFrt, dFrt+1 … dFrt+n] (4)
An actual example of this is given below. This describes the covariance for the LiftAction class from our robot data. The lift and gripper are two sensor readings from this data. The covariance is shown over time within the square brackets. It can be noted that there is a peak of covariance at time point 7 (interpretation of results is discussed later in the paper).
LiftAction: lift,gripper[1.4, 1.1, 1.6, 1.0, 1.2, 1.4, 2.8] (5) Crucially, the variables used in this calculation can include spatial elements. This would be achieved by first normalising the datasets and then placing values for absolute vectors. Such variables can then be included when performing the trend analysis to ensure comprehensive data mining. In this way, the technique can incorporate spatio-temporal data mining; however, it can also be used with temporal data, without a spatial element.
It is also possible to know, prior to the process of data mining, the total number of differential ratios that can be calculated. For v number of variables, over time series (t= 1 … t =n) this is given by;
(
)
∑
= = ⎭ ⎬ ⎫ ⎩ ⎨ ⎧ − n t t t tv v 1 2 1 (6) With the use of this equation, a prediction of the lengthof the data mining process can be estimated. Differential ratio data mining also has the feature of requiring only a single sweep of the dataset which can greatly increase the speed of the process. This is unlike other techniques such as association rules [1] which require multiple sweeps over the dataset. A single sweep over each dataset is all that is required since the covariance at each time point is calculated only once; that is, the differential ratios between time point t1 and t2, then t2 and t3 and so on to tn-1 to tn. Furthermore, the technique only requires that, at any one time, the ratios for two datasets are required in memory. Once the differential ratios have been calculated for those two particular time points, the earliest of the two time series ratios can be removed from memory. For example, ratios t1 and t2 create dFr1, then t2 and t3 create dFr2, hence when creating dFr2, t1 is no longer required and can be removed from memory.
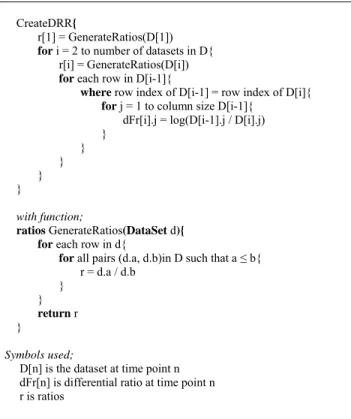
The algorithm describing the full data mining process is given in Fig. 2.
CreateDRR{
r[1] = GenerateRatios(D[1]) for i = 2 to number of datasets in D{ r[i] = GenerateRatios(D[i]) for each row in D[i-1]{
where row index of D[i-1] = row index of D[i]{ for j = 1 to column size D[i-1]{
dFr[i].j = log(D[i-1].j / D[i].j)
} } } } } with function;
ratios GenerateRatios(DataSet d){ for each row in d{
for all pairs (d.a, d.b)in D such that a ≤ b{ r = d.a / d.b } } return r } Symbols used;
D[n] is the dataset at time point n dFr[n] is differential ratio at time point n r is ratios
Fig. 2. The differential ratio data mining algorithm B. Measuring variation: Interpreting the results
For interpretation of the algorithm’s results, we will first explain what the measure represents. For each dFrt extracted the following can be said about the ratio between variable x and y over time point t and t+1;
dFrt ~ 0 Ratio has remained constant
dFrt < 0 Ratio of difference has decreased over time
dFrt > 0 Ratio of difference has increased over time
That is, a positive dFr value indicates that the two variable’s values are growing further apart in terms of the two ratios over time. A negative value is the opposite of this, that is, the two variable’s values are becoming closer together in terms of the two ratios over time. A value of around 0 indicates that the ratios between the variables has barely altered over time; exactly 0 meaning no difference at all. The magnitude of the measure also has a proportional meaning since the greater the value the more change has occurred. For instance, a larger positive dFrt value means a larger difference in ratios over time, comparatively.
Given such a measure, it becomes a simple process to automatically extract those objects that are displaying the most variation at any, or specific, time points. One simple method is to filter out all those objects that do not contain a level of dFr at least once over the time series using a threshold constraint. Similarly, a mean can be taken of
each object’s dFr over time and a filter applied to those which, again, fall below a specified threshold criteria.
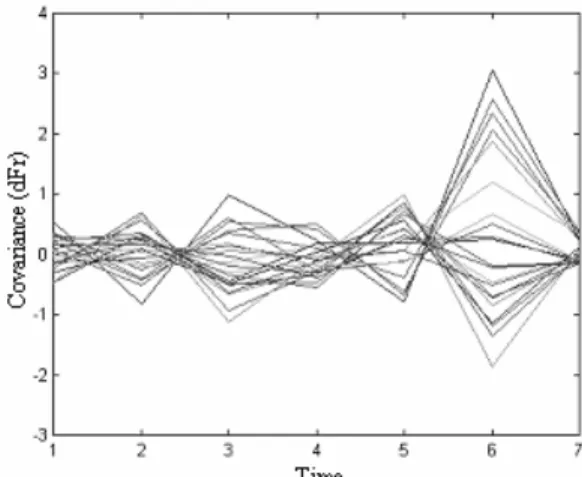
The results of data mining can also be visualised to assist with interpretation. Fig. 3 shows a simple line graph plot of some of the various differential ratios produced for the action ‘lift’. Each line within the graph represents a single differential ratio for a pair of variables over time. There are several smaller peaks at which covariance is occurring, however at time point 6 there is a clearly a large peak of covariance. This is indicative of some interesting trend which would be flagged for further analysis.
Fig. 3. A simple visualisation of differential ratios for a single experiment. X-axis represents time, Y-axis represents covariance measured in dFr
IV. EXPERIMENTAL METHOD
The MIRA robot (shown in Fig. 4) performed fourteen actions; ‘turn left’, ‘turn right’, ‘forward’, ‘backward’, ‘head up’, ‘move’, ‘head down’, ‘head right’, ‘head left’, ‘pick’, ‘put’, ‘lift’, ‘drop’ and ‘touch’. One action can consist of several basic subtasks, as described in [21]. Sensor readings, such as velocity of wheels, gripper height and tilt of camera, were taken for sequences of actions.
Fig. 4. MIRA robot performing the pick action
In order to provide sufficient training and test data the actions were performed 20 times under diverse conditions. For example, the speed the robot moved or the distance to
the table was varied. Sensor readings were taken every tenth of a second while MIRA performed these actions which provided a significant amount of data. To reduce the size of the input to a manageable level, 10 sets of the readings were taken over time to represent the action. We took the first, last and eight equi-distant sets of readings and combined them to create a single input for a sample. Finally, the data is normalised between 0 and 1.
The data collected from the robot contained both discrete and continuous values. The continuous data was for instance, velocity of the left wheel and the discrete data included the robot gripper state. We represented the discrete data using values which partitioned the space in proportion to the amount of states. Two sets of data mining experiments were conducted on the robot action data. In each experiment, each action was used as a discrete class. 75% of the sensor readings data was used to train and 25% was used as unseen data to test the classification accuracy. The experiments conducted were, (i) a back-propagation, multi-layer perceptron (MLP) neural network trained on normalised data, and, (ii) a back-propagation MLP neural network trained on results from differential ratio data mining performed on data.
The back-propagation, multi-layer, feed-forward neural network is a supervised learning approach which involves training the network using both the inputs and the required outputs. A MLP [13] organizes computational neurons into at least three layers, the input layer, the middle hidden layer and output layer. The learning rule typically used for the multi-layer neural network is the back-propagation rule that allows the network to learn to classify. This rule creates the output of the network, compares this with the required output and, by propagating the error back through the network, alters the weights to reduce the error [2]. This supervised neural network was selected as it is able to learn the salient features produced from the data mining in the first stage and produce output as pre-defined classes corresponding to an action. The ability to recognise an action enables us to move towards the creation of a stereotypical behaviour derived from the training samples by identifying the main subtasks that form a single, complete action and so move toward imitation learning.
V. RESULTS AND DISCUSSION
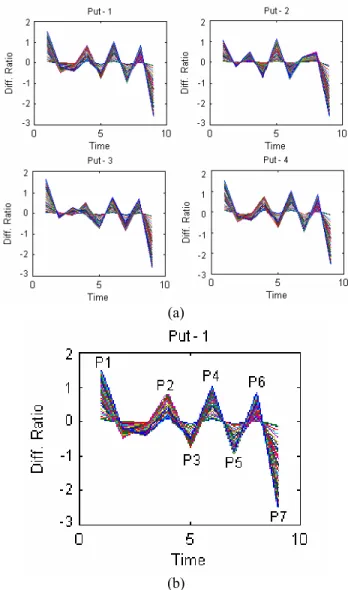
The results of the data mining showed similarity within each class in terms of covariance peaks at given time points and in general terms of the overall ‘shape’ of behaviour extracted. Fig. 5(a) shows four sets of results for the differential ratio’s extracted for the ‘put’ action. From the graphs, it can be seen that there are several ‘peaks’ of covariance over time. The peaks are highlighted in Fig. 5(b) and correspond with the following decomposition of the ‘put’; P1 - robot moves forward; P2 – robot decreases velocity; P3 - head-camera tilts down; P4 – robot continues to decrease in velocity and head tilts down; P5 – aligns
gripper; P6 – close gripper and raise; P7 – detects object contained in gripper.
(a)
(b)
Fig. 5. Differential Ratio data mining results on ‘put’ action shown graphically. (a) Several different experiments, showing similar patterns
(b) Peaks of covariance labelled
Several different architectures were selected when considering the classification accuracy of the two back-propagation, feed-forward neural networks. The number of input units was equal to the number of sensor readings (12) over time (10) which equates to 120. The 14 output unit’s corresponded to each class of action. The range in which an output was considered correct (boundary threshold) was introduced to analyse number of ‘strong’ class members compared with less strong. Alterations to the number of hidden units were the biggest factor in change in accuracy; the optimum architecture is shown in Table I, listed in the third column, along with other details of results.
The first two rows show the results of the neural networks with a boundary threshold of 0.1. For example,
for class 1 we would expect an output of ~1 for output unit number 1. Using a boundary threshold an output in the range of 0.9-1.0 would be accepted as class 1. Similarly, for boundary constraint of 0.2 an output in the range of 0.8-1.0 would be accepted as class 1.
TABLE I.
EXPERIMENTAL RESULTS OF CLASSIFICATION OF ROBOT ACTION DATA Experiment with Neural Network Trained Using Input Units Hidden Units Boundary Constraint % Correct Classification on Test Data Mean Squared Error Normalised Data 120 60 0.1 52.0 0.26 Data Mining results 240 166 0.1 81.4 0.09 Normalised Data 120 60 0.2 75.1 0.26 Data Mining results 240 166 0.2 95.1 0.09
The first set of experiments using the normalised data to train the neural network showed reasonable performance for wider boundary constraints, quickly dropping off as the boundary was constrained further. The neural networks trained on the data mining results faired better, with an improvement of 20% over the normalised data only neural networks. For the tighter boundary constraint they showed an improvement of 31% over the normalised data only neural networks. Both neural network solutions fully encapsulated the behaviour over time for both experiments and therefore would be useful for imitation learning.
As demonstrated, the data mining trained neural network encapsulated the behaviour in terms of difference in covariance over time and classified with high accuracy. A further advantage of using this data mining technique is that the trends extracted are directly related to the original data. Each individual trend (shown as graph in Figure 4) represents the covariance between two variables which can be related back to specific attributes. This differs from techniques such as PCA which reduce the dimensionality of the data without providing knowledge about specific attributes following the process. Finally, the technique has also highlighted ‘points’ of covariance, and hence interest, within each action. This is useful when trying to determine specific temporal points of possible interest.
For imitation learning purposes, a particular behaviour is recognised through the observation of actions and the inputting of such data into the data mining neural network technique. The student robot would then identify which action was being performed using the neural network previously trained from such actions.
VI. CONCLUSIONS AND FURTHER WORK In this paper we have demonstrated the use of a hybrid neural data mining technique to classify robot action data for imitation learning purposes. In doing so we perform data mining on data that encapsulates both spatial and temporal elements, whilst enabling a level of generalisation to occur to allow classification. This is achieved through a hybrid approach that combines a data analysis technique with a neural network. The initial data mining process is able to identify salient trends within the data over time which is then used to train a neural network to classify each type of behaviour. The technique has also highlighted ‘points’ of covariance, and hence interest, within each action.
To be effective, robots require the fusion of a significant amount of sensor data from multiple modalities, which are often noisy and incomplete in nature. The use of data mining to identify the salient features is fundamental to improving the effectiveness of such robots. It is our belief that this hybrid differential ratio data mining and neural network technique will be able to contribute towards this.
Further work includes the possible use of rule extraction techniques to perform knowledge extraction on the neural networks trained with the data mining identified trends [14, 15, 17]. These rules will further aid explanation of the classification process and can be used to create the required action in robots. A comparative analysis with our proposed technique and the use of an MLP trained using Back-Propagation Through Time and a recurrent network will also form future work.
ACKNOWLEDGMENT
The authors would like to acknowledge the support of EPSRC (grant GR/P01205), Nonlinear Dynamics and the MirrorBot project supported by the EU in the FET-IST programme under grant IST- 2001-35282.
REFERENCES
[1] R. Agrawal, and R. Srikant, “Fast algorithms for mining association rules”, Proceedings 20th International Conf. on Very
Large Databases, 1994, pp. 487-499
[2] R. Beale and T. Jackson, Neural computing an introduction, IOP Ltd, 1990, pp. 39-128
[3] R. Bischoff and T. Jain,, “Natural communication and interaction with humanoid robots”, Second International Symposium on Humanoid Robots, Toykyo, Japan, 1999
[4] T. Bittner, “Rough sets in spatio-temporal data mining”, 1st
International Workshop TDSM 2000, 2001, pp. 89-104
[5] R. Dillmann, “Teaching and learning of robot tasks via observation of human performance”, Proceedings of IROS-03 Workshop on Programming by Demonstration, 2003
[6] M. Dunham, Data Mining: Introductory and Advanced Topics,
Prentice Hall, 2002
[7] M. Elshaw, C. Weber, A. Zochois and S. Wermter, “An associator network approach to robot learning by imitation through vision, motor control and language”, Proceedings of the International Joint Conference on Neural Networks, Budapest, Hungary, 2004
[8] V. Gallese and A. Goldman, "Mirror neurons and the simulation theory of mind-reading", Trends in Cognitive Science, 12(2),
1998, pp. 493-501.
[9] V. Ganti, J. Gehrke and R. Ramakrishnan, “Mining very large databases”, Computer, 1999, pp. 38-45
[10] D. Hand, H. Mannila and P. Smyth, Principles of data mining,
MIT Press: Cambridge CA, 2001
[11] I. Infantino, A. Chella, Dzindo and I. Macaluso, “A posture sequence learning system for an anthropmorphic robotic hand”,
Proceedings IROS-03 Workshop on Programming by Demonstration, 2003
[12] F. Korn, A. Labrinidis, Y. Kotidis and C. Faloutsos, “Quantifiable data mining using ratio rules”, The VLDB Journal, 2000, pp.
254-266
[13] J. McClelland and D. Rumelhart, “Mechanisms of sentence processing: assigning roles to constituents of sentences”, Parallel Distributed Processing: Explorations in the Microstructure of Cognition, MIT Press, Cambridge MA, 1986, pp. 272-325
[14] K. McGarry, S. Wermter and J. MacIntyre, “The extraction and comparison of knowledge from local function networks”,
International Journal of Computational Intelligence and Applications, 2001, 1(3) pp. 369-382
[15] K. McGarry and J. Malone, “Analysis of rules discovered by the data mining process”, Applications and Science in Soft Computing Series: Advances in Soft Computing, Springer-Verlag, 2004, pp.
219-224
[16] J. Malone, K. McGarry and C. Bowerman, “Performing trend analysis on spatio-temporal proteomics data using differential ratio data mining”, Proceedings of the 6th EPSRC Conference on Postgraduate Research in Electronics, Photonics, Communications and Software (Prep 2004), 2004, pp. 103-105 [17] J. Malone, K. McGarry and C. Bowerman, “Using an adaptive
fuzzy logic system to optimise knowledge discovery in proteomics”, 5th International Conference on Recent Advances in Soft Computing (RASC) 2004, pp.80-85
[18] G. Rizzolatti and M. Arbib, "Language within our grasp", Trends in Neuroscience, 21(5), 1998, pp. 188-194
[19] J. F. Roddick, K. Hornsby and M. Spiliopoulou, “An updated bibliography of temporal, spatial, and spatio-temporal data mining research”, 1st International Workshop TDSM 2000, 2001, pp.
147-163
[20] Y. Sakagami, R. Watanabe, C. Aoyama, S. Matsunaga, N. Higaki and K. Fujimura, “The intelligent ASIMO: System overview and integration”, Proceedings of the 2002 IEEE/RSJ International Conference on Intelligent Robots and Systems, Lausanne,
Switzerland, 2002, pp. 2478-2483
[21] S. Wermter and M. Elshaw, “Learning robot actions based on self-organising language memory”, Neural Networks, Vol 16, No. 5-6, 2003, pp. 691-99