440
Estimating Rainfall Prediction using Machine
Learning Techniques on a Dataset
R Vijayan, V Mareeswari, P Mohankumar, G Gunasekaran K SrikarAbstract—Machine learning seems to be an artificially intelligent application that demonstrates systems with both the ability to analyze and enhance inherently via experience whilst being specifically programmed. Algorithms rely on software programs that are developed that could also access information and using that to learn for itself. The prediction of rainfall is regarded as very significant in everyday life, from cultivation to event. Previous prediction of rainfall was using the complex combination of mathematical abstractions and it was inadequate to get such a high classification rate Prediction of rainfall is rendered via acquiring quantitative data about the present atmospheric state. Algorithms models could learn complicated mappings, based solely on samples, from inputs to outputs, and require minimal mapping. Due to the dynamic nature of the atmosphere, a precise prediction of weather conditions is a difficult task. To forecast the rainfall state of the future, the variability in situations in earlier years need to be used. The likelihood it will fit throughout the past year's neighboring fortnight is a very high Random forest rainfall prediction algorithm with factors including temperature, humidity, and wind. Therefore this forecast will prove accurate, it will predict rainfall based on previous records.The platform used is anaconda and the language is python which is portable and interactive. The libraries used for implementation are numpy, matlib, seaborn and pandas.
Index Terms— Classification, Data Analysis, Decision Tree, Feature Extraction, Machine Learning, Neural Network, Random Forest, Regression, Support Vector Machine.
—————————— ——————————
1 I
NTRODUCTIONrainfall Prediction seems to be primarily concerned with forecasting the state of rainfall in the specified future time. Prediction of rainfall provides crucial information on the conditions ahead. Different approaches are applicable in the prediction of rainfall, from a comparatively simple examination of both the sky to extremely complex automated mathematical models. For different applications the prediction of weather conditions is important. Some of these include climate monitoring, drought prediction, severe weather forecasting, agriculture and development, energy industry planning, aviation industry, connectivity, pollution dispersal, and so on. The information included in this sequence is to be obtained from Kaggle. When collected, the information must be interpreted and collated in a format appropriate for analytics and then wiped.
In the final part, we would concentrate on interpreting data patterns with just the purpose of choosing desirable features
to construct a logical regression model to use the stats models and learning Python libraries scikit. We would emphasize the importance of knowing the assumptions required for using a Logistic Regression model and illustrate how and when to test the functionality needed to build a strong model. This article would end with a review of the testing and validation of the logical Regression model.
The prediction of rainfall has serious importance in various dimensions and scope Reducing the impact of sudden and heavy rainfall can be very beneficial by taking appropriate pre-emptive safety measures. An accurate prediction of rainfall has become more difficult than before due to climate variations. Machine learning methods could forecast the rainfall via extraction of the hidden patterns from historical data among weather attributes. It leads via investigating the need for multiple data mining methods for forecasting rainfall in Lahore urban. The dataset is derived from a weather prediction database, which composed of many atmospheric parameters. Effective prediction is based on the pre-processing method which comprises of dusting and normalizing procedures. The performance of the used Machine Learning methods is examined with different training and test data ratios in rapports of exactness, recollection, and f-measurement.
Because of the chaotic nature of the atmosphere in the existing system means the need for enormous computational power necessary to solve the equations that explain the atmospheric conditions. It results out of an incorrect interpretation of atmosphere processes, meaning that predictions be less reliable as the time difference between the current moment and the date for which the prediction is produced rises. Weather is a continuous, data-intensive, multidimensional, dynamic, and chaotic process, making weather forecasting a major challenge.
R
.————————————————
R Vijayan is working as Associate Professor at the School of Information Technology and Engineering, VIT-Vellore Institute of Technology, Vellore, India. He received his Ph.D. in Information Technology and Engineering from VIT University, India.E-mail: [email protected]
V. Mareeswari is working as Assistant Professor (Senior) at the School of Information Technology and Engineering (SITE), Vellore Institute of Technology (VIT), Vellore, India. She received his Ph.D. in Information Technology and Engineering from VIT University, India. E-mail: [email protected]
P Mohankumaris working as Associate Professor at the School of Information Technology and Engineering, VIT-Vellore Institute of Technology, Vellore, India. He received his Ph.D. in Information Technology and Engineering from VIT University, India. E-mail: [email protected]
G Gunasekaran is working as Assistant Professor(Selection Grade) at the School of Information Technology and Engineering, VIT-Vellore Institute of Technology, Vellore, India. He received his Ph.D. in Information Technology and Engineering from VIT University, India. E-mail: [email protected] K Srikar is a student at the School of Information Technology and
1.1 Machine Learning algorithms
Random forest is a kind of machine-supervised learning algorithm on understanding the ensemble. Ensemble training is indeed a form of erudition whereby you multiply combine various kinds of algorithms or just a similar procedure to create a more efficient model of forecasting. This algorithm combines many algorithms of a similar kind i.e. multiple decision trees, resulting in forest of trees, hence the term "Random Forest". This algorithm may be used for tasks of regression as well as classification. The initial steps involved in applying the random forest algorithm are selecting M arbitrary archives from the dataset, constructing a decision tree largely dependent on those M archives, choosing the amount of trees we want to see in the algorithm and repeating steps one and two. For classification issues, the group to which the new record belongs is predicted by each forest tree. At last, the new record was allocated to the division where the majority vote is received. The algorithm of random forests is also not bias, as there have been various trees and then each tree is proficient on a data subset. The random forest algorithm relies on the influence of "the audience;" hence, the algorithm's common bias reduce. That is a very robust algorithm. Although a new information theme is added in the dataset, the final algorithm is not much impacted because new information that affects one tree, although it is very difficult for it to influence all trees. The algorithm for the random forest workings fit when both categorical and mathematical features are present. Decision Tree has been one of the algorithms with the most efficiency and popularity. The Decision-tree algorithm comes below the supervised learning algorithms group. It operates for variables of both continuous and categorical production. Decision tree Pros are easy to understand and view. After a brief explanation, people can understand the decision tree models, have importance with very little real data. Significant perspectives could be produced based on professionals discussing a scenario with some of its alternative options, likelihoods, costs, and outcome preferences, helping to evaluate the worst, best and also most expected values for different situations. The downside of the decision tree is that it is dynamic, which means that perhaps a minor change in the data would lead to a major change throughout the framework of the optimal decision tree, they are often fairly imprecise. These can be rectified through replacing a decision tree with just a random decision tree forest and it isn't as difficult to interpret a random forest as a single decision tree. Logistic regression is equivalent to linear regression in classification. Through the logistic function, predictions are mapped to be between 0 and 1 which implies forecasts could be construed as category probabilities. The logistic regression performance pros have a good probabilistic interpretation, and to prevent overfitting, the algorithm can be regularised. Logistic models could be reliably modified by new information via probabilistic gradient descent, there is no uniformity of variance presumption, generally distributed error parameters are not presumed, the independents are not needed being an intervals and the independents are not required to be unbounded. The Cons are that it appears to perform poorly whenever there are various or anti-linear
borders of decision, because they are not agile enough yet to gather more interrelationships. Support vector machines Vector support machines use a method called kernels which generally computes the distance between two findings. The SVM algorithm then finds a boundary of decision, maximizing the distance between the closest members of different classes. The Pros of support vector machines are capable of displaying non-direct choice limits, there are numerous portions to browse, they are likewise genuinely hearty against overfitting, particularly in high-dimensional space, and their classifier is a powerful classifier that works well on a wide range of classified issues, including high-dimensional problems, and is not linearly separable. The drawbacks are memory expensive, tougher to configure owing to the significance of choosing the right kernel, and therefore don't scalable well with the larger datasets, currently in the industry, random forests are generally favored over support vector machines, SVMs have strong generalization efficiency, they can be abysmally slow in the test phase and discrete data poses another issue.
1.2 Libraries and tool used
NUMPY is a numerical python framework that offers quick computation mathematical functions. Here arrays and for processing procedures, it can be used to read data. PANDAS used the varying files to read and write. And data exploitation of information frames can be accomplished with ease. SKLEARN is a machine learning package that comprises many Python ML algorithms. Most of its components are used here, such as the train test split, the Decision Tree Classifier, and the precision value. SEABORN is a matplotlib-based Python data visualization library that offers an elevated-level framework for illustrating appealing and comprehensive statistical graphics. MATPLOTLIB is a Python 2D plotting library that generates quality figures for publications over platforms throughout a range of hardcopy format and dynamic formats. Matplotlib could be used in Python scripts, Python and IPython containers, Jupyter notebook, Web application servers, and four interface toolkits for graphical users. Matplotlib attempts to make things simpler, quick and hard things possible. With just a few lines of ' c ' language, you can produce maps, histograms, power spectra, bar charts, error charts, scatterplots and so on. Anaconda Navigator is a graphical user interface (GUI) software application used in the Anaconda ® distribution which encourages you to initiate apps and navigate conda packages, settings, and channels quickly without using command-line commands. It can browse for packages in Anaconda Cloud or a local repository in Anaconda. It's available for Windows, Linux and macOS
2
R
ELATEDW
ORKS442 Support Vector wherein the main goal introduces a coupling
term. This method of coupling allowing for whatever amount of freedom to model the various interpretations whilst being able to integrate the data in the training phase from all perspectives. This research was inspired by the weather foretelling task of predicting the temperature. Climate anticipating Black-box manages a wide scope of forecasts and usefulness and is among the most troublesome learning exercises around. To foresee a city's temperature, account is taken of the historical data from that city as well as the neighboring cities. In the past, the data is usually simply concatenated for different cities. Investigational outcomes on the lowest and highest prediction of temperature in Brussels indicate the progress of the multi-view approach concerning earlier effort and that this methodology is competitive with existing state-of-the-art weather prediction methods. A novel method for forecasting rainfall was proposed in [2]. A dual-step process was used. The biased forward selection algorithm is being used to lower the range of features and to consider the most promising features for forecasting rainfall. Firstly, the dataset is clustered by application of the k-means algorithm in the training phase, then a separate Neural Network is trained for each cluster. In terms of several statistical output assessment parameters, the proposed two-step prediction model was compared with the classifier. Dumdum meteorological station collects the data for experimental purposes over the period 1989-1995. Creators in [3] express that Rainfall expectation focuses on the assurance of precipitation conditions over a particular area. It is viewed as crucial for the horticultural business and different enterprises. As far as anyone is concerned, this is the first run through applying a somewhere down in anticipating month to month precipitation. The proposed approach was thought about against the Australian Community Climate and Earth-System Simulator-Seasonal Prediction System, which is a gauging model discharged by the Bureau of Meteorology. The suggested method was contrasted with the Australian Weather and Earth-System Simulator-Seasonal Prediction Environment, a forecasting model published by the Meteorology Bureau. The better mean absolute error, Pearson correlation root mean square error, and the proposed efficiency coefficient Nash Sutt cliff were obtained. More investigation showed that in months with higher annual averages, the was generally performing better with lower annual averages in months. The performance produced is encouraging and can be expanded extensively in this type of application. [4]Full-sky, ground-based imagers are common for the monitoring of cloud formations needed for various applications. Present two new models of the Wide Angle High-Resolution Sky Imaging System, designed especially to withstand Singapore's hot and humid climate. The first one uses a completely sealed casing and uses a Peltier cooler to control the interior temperature. The secondary features the dual roof design with sided ventilation panels, enabling the system to pass through the outside air. Inside these two devices, temperature measurements show their ability to
International GNSS Service Global Positioning System Regional Geodetic Observing System, and the database of interferometry of long benchmark. Results show understanding among estimations figured utilizing the proposed model just as those processed utilizing temp-subordinate models of 99%, 98%, and 93% of mistake inside ±1 mm.
3
R
AINFALL ESTIMATION PREDICTION USINGM
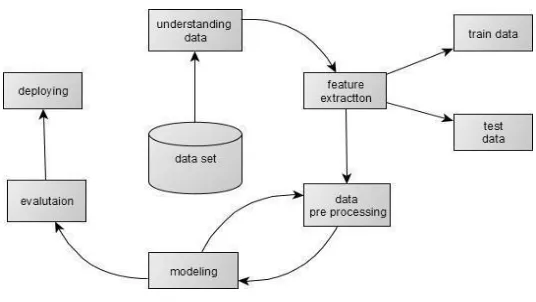
ACHINE LEARNINGThe data set used for this work comprises of many parameters, along with the recognized class of output. Output class is one that will be predicated based on other attributes available. The reason why the output class is included in the dataset is to evaluate the efficiency and accuracy of the Machine Learning techniques, The outcome results upon processing is comparable to the recognized class and performance is measured by the amount of accuracy, recall and f test. The classification model used in this work comprises of four phases: selection of the correct dataset, pre-processing, prediction and results simulation. The input data set for Rainfall forecasting is derived from both the webpage of weather prediction and comprises of many atmosphere parameters The insufficient data would impact the precision of the result as the parameter which has the incomplete value could not take part in the prediction process. Besides the missing values, there was also noise in the dataset where the value remains below or exceeds certain limits. For effective results of data mining, it is proposed that the values be kept within some limits. The pre-processing of input data is a pivotal point in the classification system that guarantees high mining results accuracy. A classification framework is utilized for the expectation of precipitation in which the dataset experienced the way toward cleaning and standardization before the arrangement. Cleanup is done to deal with the missed qualities and the goal of institutionalization is to safeguard the estimations of the traits inside specific points of confinement. Such pre-preparing assignments are basic to the smoother characterization process just as to victories Prediction execution of the pre-owned AI strategies is determined in perspective on precision, review, and estimation, which are the significant measurements of data recovery. Next, the figures are appeared in tables and charts. The data set consists of data and it has to undergo future extraction for cleaning the data and after that, it has to be divided into test and train data then it undergoes for preprocessing and modeling and it undergoes for prediction using algorithm in modeling after that it is evaluated and deployed. As shown in Figure No. 1 .the data set consists of data and it has to undergo future extraction for cleaning the data and after that it has to be divided into test and train data then it undergoes for preprocessing and modeling and it undergoes for prediction using algorithm in modeling after that it is evaluated and deployed.
Fig 1: Estimation Prediction Process
3.1 Exploring Data Analysis
During this progression playing out some enlightening examination and deciding the objective variable. At that point investigating what number of classes were in the objective and a determination of other potentially hazardous factors and Visualizing the objective variable in a histogram which is a decent method for understanding the dissemination of the information to aid parameter tuning.
3.2 Data Preprocessing
Three common data pre-processing phases are:
Formatting: The information we have picked probably won't be in an arrangement that permits one to work with. The information can be in a social database, and you might want to be in a plain document, or the information may be in a restrictive record configuration, and you need it in a social database or content record.
Cleaning: Information cleaning includes the disposal or fixing of missing information. Occasions of information might be fragmented and don't hold the information that you trust you have to address the issue. We might need to erase these cases. Also, a portion of the qualities may contain delicate data and these ascribes may should be anonymized or expelled from the information. Sampling: The information accessible might be significantly more separated than you have to work with. For calculations and more prominent computational and memory prerequisites, more information can bring about any longer running occasions. While assessing the whole dataset, you can take a littler agent test of the chosen information, which might be a lot simpler to investigate and test arrangements.
3.3 Feature Extraction
444 attributes, or characteristics. Eventually, we train our models
using the Classifier Algorithm. Classify module is used on Python's Natural Language Toolkit library. Using collected named dataset. The remainder of our classified data will be used to test the models. Some algorithms of machine learning were used to classify the pre-processed data. The classifiers selected were Random Forests. Such algorithms are very common in tasks relating to text classification.
3.4 Applying Algorithms
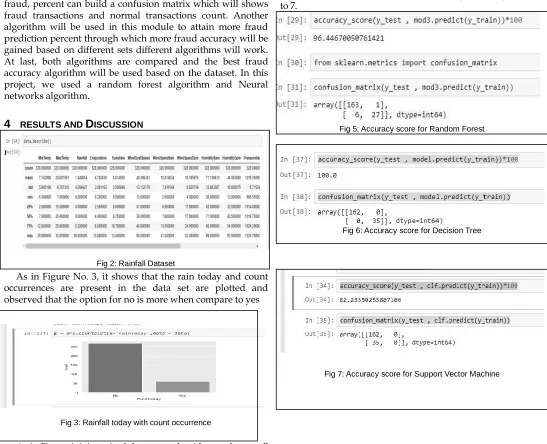
In this module, a random forest algorithm is applied by training the test data with training data that are separated in the last module. There will be a prediction or fraud percentage that will be gain as output through trained data. With this fraud, percent can build a confusion matrix which will shows fraud transactions and normal transactions count. Another algorithm will be used in this module to attain more fraud prediction percent through which more fraud accuracy will be gained based on different sets different algorithms will work. At last, both algorithms are compared and the best fraud accuracy algorithm will be used based on the dataset. In this project, we used a random forest algorithm and Neural networks algorithm.
4
RESULTS ANDD
ISCUSSIONThe dataset is taken from Kaggle which describes the rainfall occurrences in different days during different months.
Fig 2: Rainfall Dataset
As in Figure No. 3, it shows that the rain today and count occurrences are present in the data set are plotted and observed that the option for no is more when compare to yes
Fig 3: Rainfall today with count occurrence
As in Figure 4, it is noticed that every algorithm perform well based on their strategy And preform with full-fledged with fast and consume less time
Fig 4: Comparison of algorithms
The accuracy score for rainfall prediction by random forest, decision tree and support vector machine is given in Figure No. 5 to 7.
Fig 5: Accuracy score for Random Forest
Fig 6: Accuracy score for Decision Tree
Results show that the order procedures utilized performed well for no-downpour class yet for downpour class, the systems didn't perform well. The explanations for the lower downpour class exactness may incorporate missing qualities, absence of significant climatic traits in the dataset and a lower by and large precipitation rate in the area.
5 C
ONCLUSIONThe prediction of rainfall in the city utilizing five methods of data mining: supporting vector machine, random forest, and multilayer perceptron. In this study, 12 years of historical weather data from 1 December 2005 until 31 November 2017 are used for prediction. User data mining techniques performance analysis is performed, and results are displayed in tables and graphs. A classification system is used for successful prediction in which the input data goes via a preprocessing stage and was cleaned and normalized until the classification process. Ten preparing and test information proportions are utilized from 10:90 to 90:10 to investigate the exhibition reliance of arrangement methodologies on preparing information. Results show that the characterization procedures utilized performed well for no-downpour class however for downpour class, the systems didn't perform well. The purposes for the lower downpour class exactness may incorporate missing qualities, absence of significant climatic characteristics in the dataset and a lower in general precipitation rate in the district. For future work, it is proposed that further forecasts should be carried out by testing further techniques of classification and climate attributes on different weather dates. Henceforth, accuracy is based on random forest and logistic regression and future support vector machine is used to estimate accuracy.
R
EFERENCES[1] L. Houthuys, Z. Karevan and J.A.Suykens, “Multi-view LS-SVM regression for black-box temperature prediction in weather forecasting”, International Joint Conference on Neural Networks, pp. 1102-1108, May 2017, IEEE
[2] Ali Haidar and Brijesh Verma. "Monthly rainfall forecasting using one-dimensional deep convolutional neural network." IEEE Access 6,pp. 69053-69063,Nov 2018 [3] S. Chatterjee, B. Datta, S. Sen, N. Dey and N.C Debnath,”
Rainfall prediction using hybrid neural network approach”,2nd International Conference on Recent Advances in Signal Processing, Telecommunications & Computing, pp. 67-72. IEEE
[4] S. Dev, F.M. Savoy, Y.H. Lee, and S. Winkler,” Design of low-cost, compact and weather-proof whole sky imagers for High-Dynamic-Range captures”, IEEE International Geoscience and Remote Sensing Symposium, pp. 5359-5362, Jul 2015. IEEE. [5] S. Manandhar, Y.H Lee and S. Dev,” GPS derived PWV for
rainfall monitoring”, IEEE International Geoscience and Remote Sensing Symposium, pp. 2170-2173, Jul 2016. IEEE.
[6] M. Fujita and T. Sato,” Observed behaviours of precipitable water vapour and precipitation intensity in response to upper air profiles estimated from surface air temperature”, Scientific Reports, vol. 7, no. 1, pp. 1-6, Jul 2017.
[7] S. Manandhar, Y.H. Lee, Y.S. Meng, and J.T. Ong,” A simplified
model for the retrieval of precipitable water vapor from GPS signal”, IEEE Transactions on Geoscience and Remote Sensing, vol. 55, no. 11, pp. 6245-6253, Jul 2017.
[8] S. Chatterjee, S. Sarkar, S. Hore, N. Dey, A.S. Ashour and V.E.Balas, “Particle swarm optimization trained neural network for structural failure prediction of multistoried RC buildings”, Neural Computing and Applications, vol. 28, no. 8, pp. 2005-2016, Aug 2017.
[9] S. Chatterjee, S. Ghosh, S. Dawn, S. Hore, S. and N. Dey, “Forest Type Classification: A hybrid NN-GA model-based approach”, In Information systems design and intelligent applications, pp. 227-236, Springer, New Delhi,2016.
[10]A.D Dubey, "Artificial neural network models for rainfall prediction in Pondicherry", International Journal of Computer Applications, vol120, no. 3, Jan 2015.