Volume 2006, Article ID 67467, Pages1–8 DOI 10.1155/ASP/2006/67467
Partial Equalization of Non-Minimum-Phase
Impulse Responses
Ahfir Maamar,1Izzet Kale,2, 3Artur Krukowski,2, 4and Berkani Daoud5
1Department of Informatics, University of Laghouat, BP 37G, Laghouat 03000, Algeria
2Department of Electronic Systems, University of Westminster, 115 New Cavendish Street, London W1W 6UW, UK 3Department of Electronic Systems, Eastern Mediterranean University, Gazimagusa, Mersin 10, Cyprus
4National Center of Scientific Research “Demokritos,” Agia Paraskevi, Athens 153 10, Greece 5Department of Electronics, Ecole Nationale Polytechnique, BP 182, Algiers 16000, Algeria
Received 1 March 2005; Revised 5 December 2005; Accepted 26 February 2006
Recommended for Publication by Piet Sommen
We propose a modified version of the standard homomorphic method to design a minimum-phase inverse filter for non-mini-mum-phase impulse responses equalization. In the proposed approach some of the dominant poles of the filter transfer function are replaced by new ones before carrying out the inverse DFT. This method is useful when partial magnitude equalization is intended. Results for an impulse response measured in the car interior show that by using the modified version we can control the sound quality more precisely than when using the standard method.
Copyright © 2006 Hindawi Publishing Corporation. All rights reserved.
1. INTRODUCTION
In sound-reproduction systems an equalization filter is often used to modify the frequency spectrum of the original source before feeding it to the loudspeaker. The purpose is to make the impulse response of the equalized sound-reproduction chain as close as possible to the desired one [1]. In princi-ple the direct inversion of mixed-phase (or non-minimum-phase) measured impulse responses of the systems is not pos-sible since it leads to unstable equalization filter realizations. Since any mixed-phase impulse response can be represented mathematically by the convolution of a minimum-phase se-quence and a maximum-phase (or all-pass) sese-quence [2], it is possible to derive and implement an approximate and sta-ble inverse filter for such systems [3]. This is because a causal and stable sequence can invert the minimum-phase compo-nent of any mixed-phase sequence and an infinite acausal (anticipatory) and stable sequence can similarly invert the maximum-phase component of such sequences [3]. For the reason of the implementation complexity of such combined equalization filters as it will be discussed in Section 2, the work presented in this paper focuses on the equalization of the minimum-phase component of the system and its par-tial equalization importance. One method to design such a minimum-phase equalization filter is the homomorphic one based on the measured impulse response of the system. This
method known as standard used for the case of single-point equalization is described inSection 2. InSection 3, a mod-ified version of the standard homomorphic method is pro-posed. It takes into account that the listener is able to de-tect gradual response variations of less than 0.5 dB [4,5] and hence is able to control the sound quality more accurately.
Section 4shows the magnitude equalization performance
re-sults for an impulse response measured in a car interior using both objective and subjective measurements.
2. STANDARD HOMOMORPHIC METHOD
A non-minimum-phase discrete impulse response,h(n), of a system can be described as [2]
h(n)=hmp(n)⊗hap(n), (1)
where⊗denotes the discrete convolution. This can be shown in the frequency domain as
H(k)=Hmp(k)Hap(k), (2)
where hmp(n) is a minimum-phase sequence, such that its
DFT,Hmp(k), satisfies the relation
whereH(k) is the DFT ofh(n) given by
H(k)=
N−1 n=0
h(n)e−j(2πkn/N), (4)
whereN is the length of h(n) andhap(n) is an all-pass
se-quence of|Hap(k)| =1, fork=0, 1,. . .,N−1.
The convolution operation of hmp(n) and hap(n) can
be expressed as the algebraic addition of their correspond-ing complex cepstra hmp(n) and hap(n) by the
homomor-phic transformation [6]. This leads to a decomposition of a non-phase impulse response into its minimum-phase and all-pass components. The standard homomorphic method algorithm is outlined as follows [4,7,8].
(1) Compute the DFT ofh(n). (2) Compute
H(k)=logH(k). (5)
(3) Compute the real part of the complex cepstrum of h(n),
h(n)=N1
N−1
k=0
logH(k)ej(2πkn/N), (6)
forn=0, 1,. . .,N−1.
(4) Compute the corresponding real cepstrum of the minimum-phasehmp(n),
hmp(n)=
⎧ ⎪ ⎪ ⎪ ⎪ ⎪ ⎪ ⎪ ⎪ ⎪ ⎨ ⎪ ⎪ ⎪ ⎪ ⎪ ⎪ ⎪ ⎪ ⎪ ⎩
h(n)
L , n=0, N
2, 2h(n)
L , 1≤n≤ N
2,
0, N
2 < n≤N−1,
(7)
whereLis a positive real parameter [8]. (5) Compute the DFT ofhmp(n),
Hmp(k)= N−1
n=0
hmp(n)e−j(2πkn/N). (8)
(6) Computethe minimum-phase partHmp(k),
Hmp(k)=exp Hmp(k)
. (9)
(7) Compute the equalized response,Heq(k),
Heq(k)=H(k)Gmp(k), (10)
whereGmp(k) represents the inverse ofHmp(k),
Gmp(k)=H 1 mp(k)
. (11)
In the time domain, this is equivalent to a deconvolution,
heq(n)=h(n)⊗gmp(n), (12)
withgmp(n), being the inverse DFT ofGmp(k).
In the case ofL=1, the algorithm corresponds to a mag-nitude equalization. If a sufficiently large numberNis used for DFT computation, the effect of magnitude distortion caused by the system can be perfectly removed in practice by convolvingh(n) with the inverse minimum-phase impulse responsegmp(n) [3,7]. The effect of phase distortion can also
be solved by convolving the all-pass sequence,hap(n),
(ob-tained after deconvolution ofh(n) withgmp(n)) with its time
reversed version,hap(−n), [4,9]. As a result, implementation
of such combined equalization (complete equalization) re-quires very long FIR filters. But this is not always required in practice. For this reason, the equalization of the all-pass com-ponent (phase equalization) will not be considered in this work.
In the case ofL >1, the algorithm corresponds to a par-tial magnitude equalization. This requires a shorter FIR filter to keep the phase distortion below the threshold of audibility [4].
Sometimes, the frequency response of the system,H(k), and hence its minimum-phase part, Hmp(k), can be
repre-sented by a low number of isolated dominant zeros. In such a case, increasing the parameterLby a significant value dur-ing the control process may shorten the length of the equal-ization filter too, resulting in an unsatisfactory equalequal-ization performance. This is because an increase inLresults in a de-crease of all the radii of the complex poles ofGmp(k) together
according to the relation derived from (3), (7), and (9) (see the appendix),
logGmp(k)= −
1
LlogH(k). (13) This means that the complex poles ofGmp(k) appear to
be pushed together towards the origin of the unit circle. In the next section, we propose an alternative approach in which, instead of pushing all the poles ofGmp(k), we push
the most dominant of them selectively and slightly towards the origin of the unit circle by decreasing the corresponding high values of theQfactors (values of the steady-state reso-nances). This allows controlling the magnitude equalization performance more precisely—especially applicable in prac-tice. The reason is that the listener is able to detect gradual response variations of less than 0.5 dB [4,5]. Furthermore, the proposed technique is advantageous when the parame-terLcannot be calculated theoretically, for example, for the case of the direct inverse filtering (no cepstral analysis, i.e., no steps 2 to 6) of a small reverberant room where the dom-inant poles can be identified even if they are closely spaced [10,11].
3. MODIFIED VERSION
A replacing method of some dominant poles of the inverse minimum-phase function Gmp(k) is described in this
and then replaced before doing the inverse DFT in order to calculate the corresponding discrete time sequence gmp(n)
representing the impulse response of the new equalization filter.
Theztransform function of a complex pole pair is ex-pressed as [10,12]
Hp(z)= 1
1− |a|ejθz−1 1− |a|e−jθz−1,
or
Hp(z)= 1
1−2|a|cosθz−1+|a|2z−2,
(14)
where|a|is the pole radius in thezplane andθ=2π(fp/ fe) is its phase angle with febeing the sampling frequency and
fpthe frequency of the complex pole.
Taking the inverseztransform ofHp(z) the correspond-ing impulse response is [10,12]
hp(n)=|a|
nsin(nθ+θ)
sin(θ) u(n), (15)
whereu(n) is a unit step function.
The transfer function of the selective filter for a complex pole pair is
Hs(z)=
Hp(z)
Hp(z), (16)
where the transfer function Hp(z) contains a new complex pole pair at the same frequency of the old pair but at a de-sired smaller radius,|a|. This technique allows us to decrease selectively the Q factors values of a low order of isolated pole pairs in the frequency responseGmp(k). The new inverse
minimum-phase function becomes
Gmp(z)=Gmp(z)Hs(1)(z)· · ·Hs(P)(z), (17)
and its discrete version
Gmp(k)=Gmp(k)Hs(1)(k)· · ·Hs(P)(k), (18)
wherePis the number of identified and replaced dominant pole pairs fromGmp(k), andHs(P)(k), p = 1,. . .,P, are the
sampled frequency responses of selective filters equal to the number of replaced pole pairs,P.
This function is then inverted using the inverse DFT in order to obtain its discrete time domain equivalentgmp(n),
shorter thangmp(n) calculated by standard method forL=1
and longer thangmp(n) obtained forL >1.
One method to identify frequencies of the isolated poles is to iteratively search for the increased magnitude response level ofGmp(k) caused by poles (peaks) residing within the
frequency range of interest (in our case below 4 kHz). In each iteration a maximum magnitude levelGmp(fp)
correspond-ing to the highest pole frequency fpis found. This technique was found robust even in the case of very closely spaced poles
[10, 11]. After determining the frequency fp of the high-est pole, the corresponding pole radius must be determined based on theQfactor value according to the following rela-tion, since our work here is restricted to a low order of iso-lated poles [10,13–15],
Q=Gmp fp= 1
1− |a|. (19)
The replacing method means that the dominant poles of Gmp(k) are identified one by one and then replaced iteratively
by new ones, where each corresponds to a desiredQ factor,
Q=1/(1− |a|), starting from the most dominant one. The implementation algorithm of the proposed modified method (useful for partial magnitude equalization) is as fol-lows.
(1) Compute the steps 1 to 6 as in the standard method for L=1.
(2) Compute the inverse minimum-phase
Gmp(k)=H 1 mp(k)
, (20)
usingGmp(k)=Gmp(k).
(3) Setpto 1.
(4) Estimate the most dominant pole fromGmp(k) as
de-scribed above, (determinefpand|a|). (5) Design its selective filter using (16).
(6) Replace the estimated pole fromGmp(k) using (18).
(7) Increment p = p+ 1 and repeat the steps 4, 5, and 6 untilp=P.
(8) Computegmp(n) as inverse DFT ofGmp(k).
(9) Compute the equalized responseHeq(k),
Heq(k)=H(k)Gmp(k). (21)
In the time domain, this is equivalent to a deconvolution
heq(n)=h(n)⊗gmp(n). (22)
In the next section we present the performance evalua-tion of the magnitude equalizaevalua-tion performed by the pro-posed version as compared to that from standard method, using both objective measures based on an error criterion and subjective tests of speech quality.
4. RESULTS
In order to assess the performance of our algorithms, we used a frequency domain error criterion, which estimates the stan-dard deviation of the magnitude response from a constant level [4]. The error criterionΔ(dB) is given as follows:
Δ=
1 N
N−1
k=0
10 log10Heq(k)−Hm
2
1/2
−1.5 −1 −0.5 0 0.5 1 1.5 Real part
−1.5
−1
−0.5 0 0.5 1 1.5
Im
ag
inar
y
par
t
x x x x
Figure1: Complexzplane of six known zeros (poles after inversion of the minimum-phase part): (o) pole pairs and (x) replacing pole pairs.
where
Hm=N1 N−1
k=0
10 log10Heq(k). (24)
Two examples of non-minimum-phase impulse respons-es were used to compare both algorithms. The first one was synthetic, used just to enlighten the replacing approach of a low order of isolated poles, and the second one used real measurements taken in a car interior. We also introduced in the proposed version a real parameterl(l > 1), in order to selectively decrease the highestQfactors of dominant poles. This means that the new replacement poles correspond to desiredQfactors,Q=Q/l.
4.1. Synthetic impulse response
We first considered a simple synthetic impulse response. This was obtained by successive convolution of six known ze-ros sequences somewhat isolated in the complex z plane
(Figure 1) and with at least one placed outside the unit circle,
which make the impulse response a non-minimum-phase one. These are defined as (fe=8 kHz):
|a| =0.99 at fp=200 Hz,
|a| =0.99 at fp=1000 Hz,
|a| =0.85 at fp=1500 Hz,
|a| =0.70 at fp=2000 Hz,
|a| =1.5 at fp=2500 Hz,
|a| =0.95 at fp=3000 Hz.
(25)
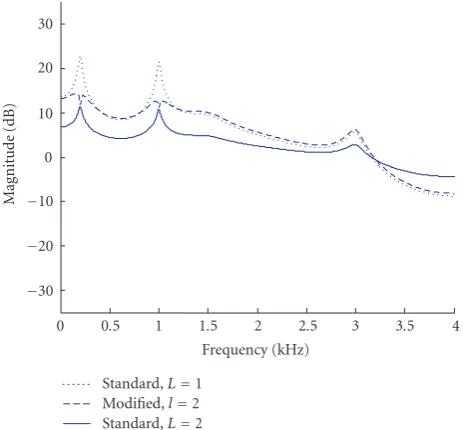
Figure 2 shows the inverse frequency response Gmp(k)
from which the two (P = 2) most dominant poles are
es-0 0.5 1 1.5 2 2.5 3 3.5 4 Frequency (kHz)
−30
−20
−10 0 10 20 30
M
ag
nitude
(dB)
Standard,L=1 Modified,l=2 Standard,L=2
Figure2: Inverse frequency responseGmp(k) calculated using dif-ferent methods.
timated and corresponding to
|a1| =0.9947 atf1=200 Hz, |a2| =0.9915 atf2=1000 Hz.
(26)
These two (P =2) poles are selectively replaced by two new poles of smaller radius corresponding toQ1/landQ2/l
factors, respectively, with a significant value of l, (l = 2)
(Figure 1). InFigure 2, even with some error in the
estima-tion of poles, we still can observe a decrease in the Q fac-tors depending on the position of the new poles. This cor-responds to a reduction ofgmp(n) length when compared to
gmp(n). When using the standard method and considering
the same significant value ofL(L = l = 2), we can see in
Figure 2that all the poles have been pushed together towards
the origin of the unit circle too, resulting also in the reduc-tion of thegmp(n) length, but this is considerably shorter than
that ofgmp(n).
The evaluation of the objective error criterion for this ex-ample is not considered because of its little practical interest.
4.2. Practical impulse response
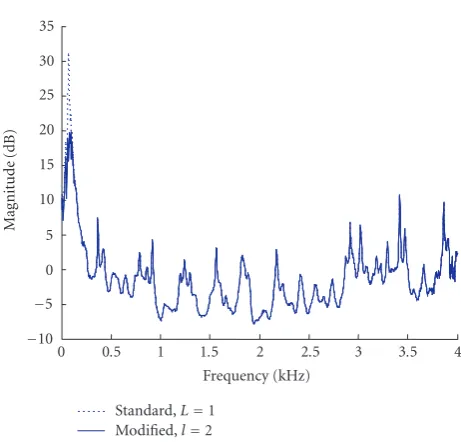
A real impulse response was measured for the car interior at a sampling frequency of 8 kHz. A record of 1024 samples was zero padded up toN =2048. This impulse response is shown inFigure 3. InFigure 4an unstable direct inverse im-pulse response is shown, demonstrating its non-minimum-phase character.
Figure 5shows the inverse minimum-phase frequency
re-sponseGmp(k). It was calculated using the standard method
0 50 100 150 200 250 Time (ms)
−1
−0.8
−0.6
−0.4
−0.2 0 0.2 0.4 0.6 0.8 1
A
m
plitude
Figure3: Impulse response measured in the car interior.
minimum-phase impulse response gmp(n) to be of a very
long duration (Figure 7).
When using the standard version for a significant value ofL, (L = 2), (Figure 6) we observed that all the poles of Gmp(k) were pushed together towards the origin of the unit
circle too, resulting in an inverse minimum-phase impulse responsegmp(n) (Figure 7) to be reduced in time too.
When using a modified version, in order to gradually duce the length of the inverse minimum-phase impulse re-sponsegmp(n), only the most dominant pole needed to be
replaced by a new pole with smaller radius. This pole corre-sponded to aQ/lfactor with the same value ofl, (l=L=2), but at the same frequency. InFigure 5we can see the inverse minimum-phase frequency response ofGmp(k), where only
the most dominant pole appears to be pushed towards the origin, withl=2.
Figure 7 also shows the corresponding inverse
mini-mum-phase impulse response ofgmp(n). Interestingly, its
du-ration is not reduced here too. This may correspond to a desired magnitude equalization (Figure 8), if the system im-pulse response was minimum phase (no phase distortion ef-fects). This is because the magnitude spectrum of the second case (modified method,l = 2,Δ(dB)= 0.7) is flatter than that of the first case (standard method,L=2,Δ(dB)=2.4). This means less magnitude distortion of the system.
4.3. Performance testing
The experiment was performed by developing models in Matlab and Simulink and carrying out listening tests using headphones. A reproduced speech signal of few seconds in duration was generated by filtering a clean speech (male and female measured in anechoic chamber) by the measured im-pulse response of the car interior (Figure 3). In order to avoid undesirable convolution effects, we considered a sufficient large numberN =8192 for DFT computations. The repro-duced speech signal was then filtered using equalizing filters calculated by the standard method withL = 1 andL = 2
0 50 100 150 200 250 300
Time (ms)
−4
−3
−2
−1 0 1 2 3 4
A
m
plitude
Figure4: Direct inverse impulse response.
0 0.5 1 1.5 2 2.5 3 3.5 4 Frequency (kHz)
−10
−5 0 5 10 15 20 25 30 35
M
ag
nitude
(dB)
Standard,L=1 Modified,l=2
Figure5: Inverse minimum-phase frequency responseGmp(k) cal-culated by the different methods.
(Figure 7) and the modified version (P=1), respectively. For
the latter case, the inverse impulse responses corresponded to each error criterion, function of the parameterlsuch as that
ofFigure 7withl=2, for example. Test signals were played to
ten untrained listeners with normal hearing at a comfortable listening level. The qualitative assessment of the test signals was based on subjective judgment of three listening sessions per each recording scheduled on six consecutive days.
0 0.5 1 1.5 2 2.5 3 3.5 4 Frequency (kHz)
−10
−5 0 5 10 15 20 25 30 35
M
ag
nitude
(dB)
Standard,L=1 Standard,L=2
Figure6: Inverse minimum-phase frequency responseGmp(k) cal-culated by the different methods.
0 50 100 150 200 250
Time (ms)
−4
−3
−2
−1 0 1 2 3 4
A
m
plitude
Standard (L=1) Modified (l=2) Standard (L=2)
Figure7: Inverse minimum-phase impulse responsesgmp(n) calcu-lated by the different methods.
signals for l > 1), respectively. The quantification of sub-jective judgments was performed according to the following scale [4]:
(i) 7, 8: good; (ii) 5, 6: fair; (iii) 3, 4: poor; (iv) 1, 2: bad.
Number 8 denotes a sound quality equivalent to the clean
0 0.5 1 1.5 2 2.5 3 3.5 4 Frequency (kHz)
−35
−30
−25
−20
−15
−10
−5 0 5 10
M
ag
nitude
(dB)
Original response
Equalized response (standard method,L=2) Equalized response (modified method,l=2)
Figure8: Magnitude response equalization.
0 0.5 1 1.5 2 2.5 3 3.5 4 4.5 5 5.5 Parameterl
0 1 2 3 4 5 6 7 8
Su
b
je
ct
ive
sc
o
re
5 0 0.3 0.7 1.1 1.5 1.9 2.2 2.6 3 Objective error (dB)
x
Optimal score obtained by standard method withL=2 and corresponding to objective
error of 2.4 (dB)
Figure9: Subjective scores of the sound quality as a function of the parameterl. Each circle represents the average of 180 observations: 18 for each 10 listeners.
speech. The final result was calculated as a mean of the indi-vidual listening results (18 each) for each of 10 subjects. The results are shown inFigure 9as a function of parameter l, ranging froml =0 (unequalized signal) tol = 5 (partially equalized signal).
0.5 dB of objective error corresponds to a significant varia-tion of subjective score of the sound quality); although the participants in the experiment were nonexpert listeners.
5. CONCLUSIONS
In this paper a modified version of the standard homomor-phic method for minimum-phase inverse filter design for non-minimum-phase impulse responses equalization is pre-sented. This version is useful in cases of partial magnitude equalization, where the dominant zeros density of the sys-tem is not very high. Although it is used in this work as an additional optimizing tool for the psychoacoustic qual-ity measurement of speech, this alternative approach is ad-vantageous in case of the direct inverse filtering (minimum-phase system) when perfect equalization of a small reverber-ant room is not desired.
APPENDIX
Proof for the relation (13).
The real part of the complex cepstrum ofh(n) in (6) is defined as the inverse DFT of the function
H(k)=logH(k). (A.1)
Applying the direct DFT on the real cepstrum of the minimum-phasehmp(n) in the relation (7) forL = 1 leads
to
Hmp(k)=logHmp(k). (A.2)
ForL=1, the relation (A.2) becomes
Hmp(k)=L1logHmp(k). (A.3)
Using the relation (3), the minimum-phase partHmp(k) of
the relation (9) can be expressed as follows:
Hmp(k)=exp
1
LlogHmp(k)
=exp
1
LlogH(k)
. (A.4)
Therefore, the inverse ofHmp(k),Gmp(k) is given by
Gmp(k)=exp
−1LlogH(k)
, (A.5)
or
logGmp(k)= −L1logH(k). (A.6)
ACKNOWLEDGMENT
The authors would like to thank the reviewers for their help-ful comments and suggestions.
REFERENCES
[1] S. J. Elliott and P. A. Nelson, “Multiple-point equalization in a room using adaptive digital filters,”Journal of the Audio Engi-neering Society, vol. 37, no. 11, pp. 899–907, 1989.
[2] A. V. Oppenheim and R. W. Schafer,Digital Signal Processing, Prentice-Hall, Englewood Cliffs, NJ, USA, 1975.
[3] J. N. Mourjopoulos, “Digital equalization of room acoustics,” Journal of the Audio Engineering Society, vol. 42, no. 11, pp. 884–900, 1994.
[4] B. D. Radlovic and R. A. Kennedy, “Nonminimum-phase equalization and its subjective importance in room acoustics,” IEEE Transactions on Speech and Audio Processing, vol. 8, no. 6, pp. 728–737, 2000.
[5] L. D. Fielder, “Analysis of traditional and reverberation-reducing methods of room equalization,”Journal of the Audio Engineering Society, vol. 51, no. 1/2, pp. 3–26, 2003.
[6] A. V. Oppenheim and R. W. Schafer,Discrete Time Signal Pro-cessing, Prentice Hall, Upper Saddle River, NJ, USA, 1989. [7] S. T. Neely and J. B. Allen, “Invertibility of a room impulse
response,”The Journal of the Acoustical Society of America, vol. 66, no. 1, pp. 165–169, 1979.
[8] B. D. Radlovic and R. A. Kennedy, “Iterative cepstrum-based approach for speech dereverberation,” inProceedings of the 5th International Symposium on Signal Processing and Its Applica-tions (ISSPA ’99), vol. 1, pp. 55–58, Brisbane, Australia, August 1999.
[9] D. Preis, “Phase distortion and phase equalization in audio sig-nal processing—a tutorial review,”Journal of the Audio Engi-neering Society, vol. 30, no. 11, pp. 774–794, 1982.
[10] A. M¨akivirta, P. Antsalo, M. Karjalainen, and V. V¨alim¨aki, “Modal equalization of loudspeaker-room responses at low frequencies,”Journal of the Audio Engineering Society, vol. 51, no. 5, pp. 324–343, 2003.
[11] M. Karjalainen, P. A. A. Esquef, P. Antsalo, A. M¨akivirta, and V. V¨alim¨aki, “Frequency-zooming ARMA modelling of resonant and reverberant systems,”Journal of the Audio Engineering So-ciety, vol. 50, no. 12, pp. 1012–1029, 2002.
[12] M. Bellanger,Traitement Num´erique du Signal, Dunod, Paris, France, 1998.
[13] Y. Haneda, S. Makino, and Y. Kaneda, “Common acoustical pole and zero modeling of room transfer functions,” IEEE Transactions on Speech and Audio Processing, vol. 2, no. 2, pp. 320–328, 1994.
[14] M. Kunt, Traitement Num´erique des Signaux, Dunod, Paris, France, 1981.
[15] J. R. Hopgood and P. J. W. Rayner, “Blind single channel deconvolution using nonstationary signal processing,”IEEE Transactions on Speech and Audio Processing, vol. 11, no. 5, pp. 476–488, 2003.
Izzet Kale holds the B.S. (honors) de-gree in electrical and electronic engineer-ing from the Polytechnic of Central Lon-don (England), the M.S. degree in the de-sign and manufacture of microelectronic systems from Edinburgh University (Scot-land), and the Ph.D. degree in techniques for reducing digital filter complexity from the University of Westminster (England). He joined the staffof the University of
West-minster (formerly the Polytechnic of Central London) in 1984 and he has been with them since. He is currently a Professor of ap-plied DSP and VLSI systems, leading the Apap-plied DSP and VLSI Research Group at the University of Westminster. His research and teaching activities include digital and analogue signal pro-cessing, silicon circuit and system design, digital filter design and implementation, A/D and D/A sigma-delta converters. He is cur-rently working on efficiently implementable, low-power DSP algo-rithms/architectures and sigma-delta modulator structures for use in the communications and biomedical industries.
Artur Krukowski holds the Ph.D. degree in DSP from the University of Westminster (London in 1999), the M.S. degree in in-strumentation and measurement (I & M) from the Warsaw University of Technol-ogy (Warsaw in 1992), and the M.S. degree in DSP from the University of Westmin-ster (London in 1993). In 1993 he joined the staffof the University of Westminster. His main areas of interest include
multi-rate digital signal processing for telecommunication systems, ef-ficient low-level implementation of multirate fixed/floating-point digital filters, digital audio and video broadcasting, e-teaching and e-Learning technologies. From 2004 he is associated also with the National Research Center “Demokritos” in Athens (Greece) where he carries out advanced research in indoor/outdoor positioning technologies as enabling technologies for the provision of advanced location-based services.
Berkani Daoudreceived the Engineer Di-ploma and Master’s degree with Red Award from Polytechnic Institute of Kiev in 1977, then the Magister and Sc.D. degrees from the Ecole Nationale Polytechnique (ENP), Algiers. In 1979, he became a Lecturer, As-sociated Professor, then full Professor teach-ing signal processteach-ing and information the-ory in the Department of Electronics of ENP. During this period, his research