University of South Carolina
Scholar Commons
Theses and Dissertations
2016
Uncertainty Quantification In Computational
Catalysis
Eric Alan Walker University of South Carolina
Follow this and additional works at:https://scholarcommons.sc.edu/etd Part of theChemical Engineering Commons
This Open Access Dissertation is brought to you by Scholar Commons. It has been accepted for inclusion in Theses and Dissertations by an authorized administrator of Scholar Commons. For more information, please [email protected].
Recommended Citation
U
NCERTAINTYQ
UANTIFICATION INC
OMPUTATIONALC
ATALYSIS byEric Alan Walker
Bachelor of Science
Georgia Institute of Technology, 2009
Master of Science
University of South Carolina, 2013
Submitted in Partial Fulfillment of the Requirements
For the Degree of Doctor of Philosophy in
Chemical Engineering
College of Engineering and Computing
University of South Carolina
2016
Accepted by:
Andreas Heyden, Major Professor
Gabriel A. Terejanu, Committee Member
Jochen Lauterbach, Committee Member
Mark Uline, Committee Member
John Weidner, Committee Member
Salai Cheettu Ammal, Committee Member
DEDICATION
To Elina (Eleni Kyriakidou), my wife. You helped me with this dissertation in
ACKNOWLEDGEMENTS
I acknowledge Dr. Heyden for his unwavering guidance. I acknowledge Dr.
Terejanu for his resolute support and mentorship. I acknowledge the Heyden research
group members including Salai, Sina, Faheem, Jianmin, Mamun, Vijay, Saleheen, Asif
and Wenqiang and Terejanu group member Xiao. On a personal note, I acknowledge
Elina, Mom and Dad. Also, I would like to acknowledge my best man, Ioannis Sgouralis
ABSTRACT
This dissertation augments the field of computational catalysis with uncertainty
quantification. An efficient tool to describe the energetics and structure of atomistic
systems is density functional theory (DFT). DFT may be used to understand how
catalysts work although DFT is inexact in nature due to approximations necessary for
computational tractability. These approximations in DFT cause uncertainty in
microkinetic model results for catalytic systems. Therefore, reliable model results gained
from DFT include a quantification of uncertainty. The case study to examine a
systematic framework for uncertainty quantification is water-gas shift (WGS
CO+H2O⇌CO2+H2) reaction by Pt/TiO2 catalyst.
Uncertainties are represented with probabilities and a latent variable model is
developed that account for errors and correlations in DFT energies. This probabilistic
model is further constrained to known reaction thermodynamics, and then propagated to
quantities of interest such as turnover frequency (TOF), apparent activation barrier, and
reaction orders. DFT energies are obtained using four separate functionals PBE, RPBE,
HSE, and M06L that each have their own justification for being appropriate for this
study. Although the uncertainty in model results spans orders of magnitude, a new
approach is introduced to identify the dominant catalytic cycle under uncertainty. Next
three active sites of the Pt/TiO2 catalyst are compared using uncertainty and Bayesian
two involve the oxide support (TiO2) in the mechanism of reaction. The third active site
models only the metal with Pt(111). The two active sites involving the oxide support
both explain the experimental data far better than the terrace Pt(111) active site.
Therefore, it is concluded that the oxide support plays a mechanistic role in the WGS
reaction. The selected active site is verified with separate experiments at separate
TABLE OF CONTENTS
DEDICATION ... iii
ACKNOWLEDGEMENTS ... iv
ABSTRACT ...v
LIST OF TABLES ...x
LIST OF FIGURES ... xii
CHAPTER 1:INTRODUCTION ...1
CHAPTER 2:MECHANISM OF SULFUR POISONING OF SR2FE1.5MO0.5O6PEROVSKITE ANODE UNDER SOLID OXIDE FUEL CELL CONDITIONS ...2
2.1ABSTRACT ...3
2.2INTRODUCTION ...3
2.3COMPUTATIONAL MODEL AND METHODS ...6
2.4RESULTS AND DISCUSSION ...8
2.5CONCLUSIONS ...20
2.6ACKNOWLEDGEMENTS ...21
2.7REFERENCES ...22
2.8TABLES AND FIGURES ...24
CHAPTER 3:UNCERTAINTY QUANTIFICATION FRAMEWORK APPLIED TO THE WATER-GAS SHIFT REACTION OVER PT-BASED CATALYSTS ...31
3.1ABSTRACT ...32
3.2INTRODUCTION ...33
3.4WGSAPPLICATION ...44
3.5RESULTS AND DISCUSSION ...49
3.6CONCLUSIONS ...53
3.7ACKNOWLEDGEMENTS ...54
3.8REFERENCES ...55
3.9TABLES AND FIGURES ...59
CHAPTER 4:DETERMINATION OF THE ACTIVE SITE OF THE WATER-GAS SHIFT REACTION BY SUPPORTED PLATINUM CATALYST ...72
4.1ABSTRACT ...73
4.2INTRODUCTION ...73
4.3RESULTS AND DISCUSSION ...76
4.4CONCLUSIONS ...82
4.5ACKNOWLEDGEMENTS ...83
4.6REFERENCES ...84
4.7TABLES AND FIGURES ...88
APPENDIX A–SUPPORTINGINFORMATIONFORCHAPTER4 ...99
A.1TERRACE ACTIVE SITE MODEL ...99
A.2LATERAL INTERACTION MODEL ...103
A.3BAYESIAN STATISTICS ...114
A.4FOUR FUNCTIONAL CALCULATIONS FOR TERRACE AND CORNER SITES ...118
A.5ACTIVE SITE SELECTION ...126
A.6ALTERING GAS MOLECULE CORRECTION RANGE ...137
A.8REFERENCES ...151
LIST OF TABLES
Table 2.1 Gibbs free energies for the dissociative adsorption of H2S (𝐺𝑎𝑑𝑠, eqn. 9) and
oxygen replacement by H2S (𝐺𝑟𝑒𝑝𝑙, eqn. 10) on the SFMO (001) surface calculated at T
= 1100 K and Pgas = 1 atm. ...24
Table 2.2 Gibbs free energies (G) for the formation of an oxygen vacancy on the FeO2- terminated SFMO surface in the presence and absence of sulfur and nickel under reducing conditions (T = 1100 K, Pgas = 1 atm). ...25
Table 2.3 Calculated Bader charges (in e) on the neighboring metals and active oxygen/sulfur atom on the FeO2- terminated surface in the presence and absence of sulfur and nickel cluster ...26
Table 3.1 Four functional results for the Gibbs’ free energy of various states of our model originally reported by Ammal et al.24 ...59
Table 3.2 Standard deviations of Gaussian uncertainties of Gibbs’ free energies obtained by factor analysis and setting adsorption/desorption uncertainties...61
Table 4.1 Bayes factor matrix ...88
Table A.1 Activation barriers (eV) and reaction energies (eV) for elementary steps the water-gas shift (WGS) reaction on Pt(111) ...102
Table A.2 Linear lateral interactions Campbell’s degree of rate control (DRC) for each elementary step of WGS on Pt(111) ...106
Table A.3 T=650 K. †CO* + O* ↔ CO2 + 2* is one reaction in Stamatakis, et al.22 ...111
Table A.4 Relative free energies as calculated by four functionals for Pt(111). ...120
Table A.5 Corner atoms four functionals.30 ...122
Table A.6 Discrepancy model standard deviations inverse gamma priors. ...127
Table A.7 Jeffreys scale for Bayes factors. ...147
Table A.9 Corner evidences. ...149
Table A.10 Bayes factor between edge and corner for different order Bayesian
LIST OF FIGURES
Figure 2.1 Sr2Fe1.5Mo0.5O6‐δ (δ = 0.625) (001) surface models used to study the sulfur poisoning mechanism...27
Figure 2.2 Top view of the optimized structures of S adsorbed on an oxygen vacancy
(𝑀 − 𝑉𝑂••− 𝐹𝑒, 𝑀 = 𝑀𝑜 𝑜𝑟 𝐹𝑒) and S replacing an oxygen atom (𝑀 − 𝑂 − 𝐹𝑒, 𝑀 =
𝑀𝑜 𝑜𝑟 𝐹𝑒) on the reduced SFMO (001) surface models ...28
Figure 2.3 Calculated phase diagrams for the interaction of S on SFMO (001) surfaces .29
Figure 2.4 Top view of reactant structures corresponding to the reactions provided in Table 2.2. ...30
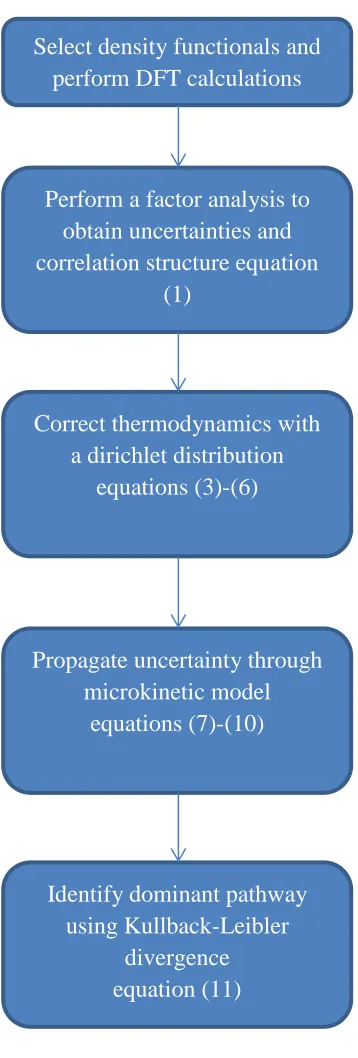
Figure 3.1 Flowchart of general framework for uncertainty quantification of
computational catalysis results presented in section 3.2. ...63
Figure 3.2 Boxplot of gas molecule free energy corrections with three samples shown on top ...64
Figure 3.3 Free energy diagrams of the classical redox pathway ...65
Figure 3.4 Relative Gibbs’ free energy diagram of the classical redox cycle with 95% confidence intervals from factor analysis ...66
Figure 3.5 Probability density of TOFs calculated for different pathways of the WGS at Pt/TiO2 interface sites ...67
Figure 3.6 KL divergence of two catalytic cycles over a range of temperatures ...68
Figure 3.7 Probability density of overall TOF and individual catalytic cycle TOF of various pathways at PCO = 0.03 atm, PH2O = 0.1 atm, PCO2 = 0.06 atm, PH2 = 0.2 atm, and
T = 623 K ...69
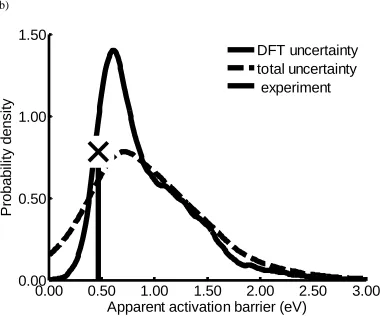
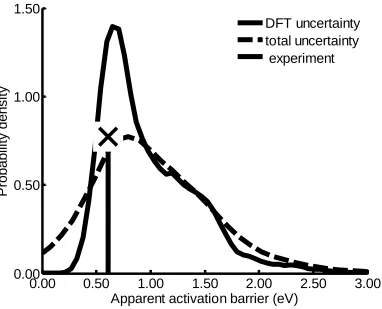
Figure 3.8 Probability density of the apparent activation barrier obtained at PCO = 0.03
atm, PH2O = 0.1 atm, PCO2 = 0.06 atm, PH2 = 0.2 atm, and T = 473 - 623 K ...70
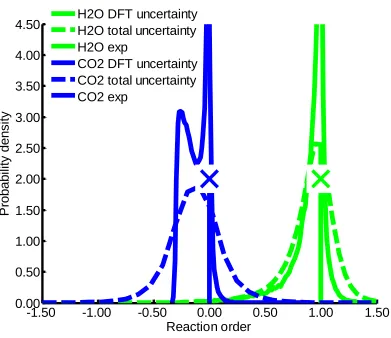
Figure 3.9 Probability density of various reaction orders ...71
Figure 4.2 (a) TOF (s-1) of the edge posterior captures the experiment.41 (b) Apparent
activation energy (eV) results of the Bayesian inverse. ...91
Figure 4.3 Reaction orders after the Bayesian inverse ...93
Figure 4.4 Edge verification at separate experimental conditions and sources ...95
Figure 4.5 Edge verification at separate experimental conditions reaction orders. ...97
Figure A.1 Example lateral interaction effects (eV) on the CO surface intermediate. ....105
Figure A.2 Example lateral interaction effects (eV) on H surface intermediate ...106
Figure A.3. Comparison of relative free energy paths for no lateral interactions and with lateral interactions. ...109
Figure A.4 Prior and posterior uncertainty in the dominant free energy path for the corner active site ...124
Figure A.5 Prior and posterior uncertainty in the dominant free energy path for the terrace active site ...125
Figure A.6 Degrees of rate control for classical and CO-promoted pathways for edge active sites posterior ...128
Figure A.7 Terrace Pt(111) posterior TOF (s-1) ...129
Figure A.8 Terrace Pt(111) posterior reaction orders CO and H2 ...130
Figure A.9. Terrace Pt(111) posterior reaction orders H2O and CO2 ...131
Figure A.10 Terrace Pt(111) posterior apparent activation barrier (eV) ...132
Figure A.11 Corner active site posterior TOF (s-1) ...133
Figure A.12 Corner active site posterior reaction orders CO and H2 ...134
Figure A.13 Corner active site posterior reaction orders H2O and CO2. ...135
Figure A.14 Corner active site posterior apparent activation barrier (eV). ...136
Figure A.15 TOF (s-1) after Bayesian inverse using the gas molecule range −0.2 ≤ 𝜁 ≤ 0.2 (𝑒𝑉). ...138
Figure A.17 Apparent activation barrier (eV) after Bayesian inverse using the gas
molecule range −0.2 ≤ 𝜁 ≤ 0.2 (𝑒𝑉). ...140
Figure A.18 TOF (s-1) after Bayesian inverse using the gas molecule correction range
−0.6 ≤ 𝜁 ≤ 0.6 (𝑒𝑉). ...142
Figure A.19 Reaction orders after Bayesian inverse using the gas molecule correction range −0.6 ≤ 𝜁 ≤ 0.6 (𝑒𝑉). ...143
Figure A.20 Apparent activation barrier (eV) after Bayesian inverse using the gas
CHAPTER
1
INTRODUCTION
This dissertation is written in manuscript style. Therefore each chapter is a
publication. The first publication, chapter 2, is a theoretical investigation of a fuel cell
anode. This work was supported by the Energy Frontiers Research Center at the
University of South Carolina. Specifically, the work investigates the mechanism of
sulfur poisoning of a perovskite anode material of a solid oxide fuel cell. The model of
the perovskite material has been developed in large part in the publications of Dr. Suwit
Suthirakun and Dr. Salai Ammal and the dissertation of Dr. Suthirakun.
The second and third publication (the third publication is to be submitted) are at
the heart of the title of this dissertation, uncertainty quantification. We use an
industrially-relevant water-gas shift reaction for producing hydrogen as a case study. The
second publication, chapter 3, deals with the forward problem in which we have some
uncertainties in our model predictions. The third publication deals with an inverse
problem in which experiments are used to update our model uncertainties. The inverse
problem also helps us to select the atomistic-scale active site of the nano-particle catalyst.
These publications were supported by the National Science Foundation CAREER award
won by Dr. Andreas Heyden and the research in these publications also led to the
Designing Materials to Revolutionize and Engineer our Future grant won by Drs.
CHAPTER 2
MECHANISM OF SULFUR POISONING OF SR
2FE
1.5MO
0.5O
6-δPEROVSKITE ANODE UNDER SOLID OXIDE FUEL CELL
CONDITIONS
1_____________________________________
1
Walker, E.; Ammal, S. C.; Suthirakun, S.; Chen, F.; Terejanu, G. A.; Heyden, A. J. Phys. Chem. C, 2014, 118, 23545–23552.
2.1 ABSTRACT
The interactions between sulfur and the Sr2Fe1.5Mo0.5O6-δ (SFMO) perovskite
anode are investigated using periodic density functional theory (DFT) calculations and
constrained ab initio thermodynamic analysis under anodic solid oxide fuel cell
conditions. Three surface models with different Fe:Mo ratios in the topmost layer are
used to investigate the mechanism of sulfur poisoning. Sulfur prefers to interact with
these surfaces by replacing existing oxygen rather than adsorbing on a metal or oxygen
vacancy. Constructed phase diagrams suggest that the surface with higher Mo content on
the gas exposed surface layer is highly resistant toward sulfur poisoning, whereas the
FeO2-terminated surface is more susceptible to sulfur poisoning. The presence of S in the
surface has also a negative impact on the surface vacancy formation process, which is the
rate-controlling step in the H2 electro-oxidation. Adding a small Ni3 cluster to the least
active FeO2-terminated surface promotes the oxygen vacancy formation; however, the
presence of strongly adsorbed S on the Ni cluster makes this process more endergonic,
which in turn will decrease the activity of the anode. Based on these results, we suggest
that increasing the Mo content in the gas exposed surface layer of SFMO will improve its
overall electrochemical performance while maintaining excellent sulfur tolerance.
2.2 INTRODUCTION
Over the past decade, the search for clean, renewable, and sustainable energy has
moved from the periphery to the center of the global economy. Solid oxide fuel cells
future energy conversion because they can convert energy more efficiently than
conventional heat engine systems and lower temperature polymer-based fuel cells. The
capability of SOFCs to operate with a wide range of gas fuels as well as the possibility of
direct utilization (or through internal reforming) of conventional fossil, biomass, and
other renewable fuels facilitates SOFC’s application in environmentally friendly
industries.1−5 However, a major drawback of such readily available fuels is the presence
of sulfur-containing impurities, which may poison the catalytically active metal sites at
the anode and thus, seriously affect the cell performance and even operational life.6−8
During the reforming process, the sulfur compounds are converted to gaseous H2S and
the most commonly used Ni-based anodes in the current SOFC systems display very poor
tolerance to H2S. Significant poisoning of Ni-anodes was observed when the H2S
concentration was above 5−10 ppm at 950−1000 °C and the extent of poisoning increased
dramatically at lower temperatures.7,9,10 Therefore, great efforts have been devoted to
understanding the sulfur poisoning mechanism of SOFC anodes in recent years11−17 in
order to identify specific mitigation strategies against degradation and for the rational
design of sulfur tolerant anodes.
In addition to the efforts made to improve the sulfur tolerance of conventional Ni
based anodes, recent studies have also focused on finding alternative anode materials
with improved sulfur tolerance. Among them, the mixed ionic and electronic conductor
(MIEC) oxides with perovskite structure have drawn significant interest for the
development of high performance sulfur tolerant anodes. Recently, the Sr2Fe1.5Mo0.5O6-δ
(SFMO) perovskite has been proven to be an extremely efficient anode for SOFCs
conditions, good catalytic activity, and very good ionic and electrical conductivity.18−23
Experimental studies have shown that the SFMO anode can process both H2 fuel and
natural gas with high tolerance to sulfur.18,19,22 Despite these advantages, a major
drawback of SFMO was identified in its relatively low electro-oxidation activity, leading
to an overall low cell performance. It has been shown that adding a small amount of Ni to
the anode improves the overall cell performance, indicating that Ni has an electrocatalytic
effect toward fuel oxidation on the SFMO surface.19,23 However, the presence of Ni
decreases the sulfur tolerance of SFMO and the cell performance of Ni−SFMO anode
was found to drop by almost 18% after operating for about 20 h in a H2 fuel with 100
ppm of H2S at 800 °C.23 Thus, a compromise between improved activity and sulfur
tolerance of the SFMO anode has not yet been achieved.
In our recent study, we investigated the electro-oxidation mechanism of H2 fuel
on the SFMO (001) surface under SOFC operating conditions using periodic density
functional theory (DFT) calculations and microkinetic modeling techniques.24 We found
that Mo plays a crucial role in improving the catalytic activity of SFMO; however, the
Mo content in the SFMO surface tends to be very low under fuel cell operation
conditions. On the basis of our results, we suggested that increasing the Mo content in the
surface could possibly improve the overall electrochemical performance of SFMO.
Herein, we investigate the sulfur poisoning mechanism of SFMO (001) surfaces with
different Mo content under fuel cell operating conditions using constrained ab initio
thermodynamics calculations. We aim at identifying the mechanism of S adsorption on
the SFMO (001) surface and its effect on the rate-limiting step of the H2 electrooxidation.
work,24 but also dramatically improves the sulfur tolerance of the SFMO anode.
However, in the presence of Ni clusters on the surface, added to promote the rate-limiting
oxygen vacancy formation process, the activity will decrease with time due to Ni’s strong
affinity for sulfur atoms.
2.3 COMPUTATIONAL MODEL AND METHODS
All calculations presented in this work were carried out using spin-polarized
DFT+U theory with periodic boundary conditions as implemented in the Vienna Ab
initio Simulation Package (VASP).25,26 The semilocal generalized gradient approximation
density functional of Perdew, Burke, and Ernzerhof (PBE)27 was used to describe
exchange and correlation effects. The nuclei and core electronic states were described by
projector augmented-wave (PAW) potentials,28 while the Sr 4s4p5s, Fe 3p3d4s, Mo
4p5s4d, Ni 4s3d, O 2s2p, and S 3s3p were treated as valence electrons. The PAW−DFT
wave functions are expanded in a plane wave basis, with a kinetic energy cutoff of 800
eV and a k-point sampling based on the Monkhorst-pack (MP)29 scheme. Integration over
the first Brillouin zone used Gaussian smearing (σ = 0.05 eV) during structural
relaxations. The U−J parameter was employed to correct the self-interaction error
inherent in pure DFT when applied to transition metals with tightly localized d-electrons,
such as Fe in SFMO. In accordance with earlier computational studies on SFMO,20,30 we
set the U−J value for Fe to 4.0 eV and used no U−J parameter for Mo, as validated on the
The three SFMO (001) surface models, referred as plane-Mo,diagonal-Mo, and
FeO2
terminated surface, used to investigate sulfur poisoning mechanism are shown in
Figure 2.1. We chose these surface models based on our previous constrained ab initio
thermodynamic analysis on the stability of SFMO surface models under fuel cell
operating conditions. The details of these calculations can be found elsewhere.24 The
number of Mo atoms in the top surface layer of the plane-Mo, diagonal-Mo, and FeO2
-terminated surfaces are 2, 1, and 0, respectively. Ourthermodynamic analysis24 suggested
that all three surface modelspossess five oxygen vacancies at relevant SOFC operating
conditions (PO2 = 10-20, T = 1100 K); however, the distribution of vacancy sites is
different in the three models. The plane-Mo surface (Figure 2.1a) has two oxygen
vacancies in the topmost layer, whereas the diagonal-Mo (Figure 2.1b) surface has three
oxygen vacancies, and the FeO2- terminated (Figure 2.1c) surface contains four oxygen
vacancies in the topmost layer.
Each SFMO (001) slab has four SrO and four Fe(Mo)O2 layers and is terminated
by a Fe(Mo)O2 layer. As reported previously,24 the antiferromagnetic arrangement of Fe
spins was found to be the most stable arrangement in all the three surface configurations.
A vacuum gap of 15 Å was used to minimize the interaction between images along the
z-axis. The bottom-most layer was fixed in all calculations to mimic a semi-infinite bulk
crystal and the slabs were optimized using a 4 × 4 × 1 MP29 k-mesh. Dipole and
quadrupole corrections to the energy are taken into account using a modified version of
the Markov and Payne method;31 i.e., the contribution of dipole interactions along the
2.4 RESULTS AND DISCUSSION
Since sulfur compounds present in hydrocarbon fuels are converted to gaseous
H2S during reforming and the adsorption of a sulfur atom on the SFMO surface can be
described as 𝐻2𝑆(𝑔)+ ∗ ↔ 𝐻2(𝑔)+ 𝑆∗, where * represents an empty site on the SFMO
surface and S* is the adsorbed sulfur atom. On the three surface models considered in the
present study (Figure 2.1), the adsorption site for a sulfur atom could either be on top of a
Mo or Fe atom as well as on the existing oxygen vacancy site (𝑀 − 𝑉𝑂••− 𝐹𝑒, 𝑀 = 𝑀𝑜 or 𝐹𝑒 in Kröger−Vink notation32). Our calculations suggested that the adsorption of S is
favored on the oxygen vacancy site in all three surface models. The initial structures with
S on top of a Mo or Fe atom converged to the structures with S in the vacancy site
because each Mo and Fe atom in the three surface models has a neighboring oxygen
vacancy. Thus, we describe the S adsorption reaction on the reduced SFMO (001) surface
as
𝐻2𝑆(𝑔)+ 𝑀 − 𝑉𝑂••− 𝐹𝑒 ↔ 𝐻
2(𝑔)+ 𝑀 − 𝑆 − 𝐹𝑒, (𝑀 = 𝑀𝑜 𝑜𝑟 𝐹𝑒) (1)
and the corresponding adsorption reaction energy (𝛥𝐸𝑎𝑑𝑠) is then given by
𝛥𝐸𝑎𝑑𝑠 = 𝐸
𝐻2𝐷𝐹𝑇+ 𝐸𝑀−𝑆−𝐹𝑒𝐷𝐹𝑇+𝑈 − 𝐸𝐻2𝑆𝐷𝐹𝑇− 𝐸𝑀−𝑉𝐷𝐹𝑇+𝑈𝑂••−𝐹𝑒 (2)
where 𝐸𝑀−𝑉𝐷𝐹𝑇+𝑈𝑂••−𝐹𝑒 and 𝐸𝑀−𝑆−𝐹𝑒𝐷𝐹𝑇+𝑈 correspond to the computed energy of the surface model before and after S adsorption, respectively. In addition to the adsorption of S atom on the
the surface. This reaction can be described as
𝐻2𝑆(𝑔)+ 𝑀 − 𝑂 − 𝐹𝑒 ↔ 𝐻2𝑂(𝑔)+ 𝑀 − 𝑆 − 𝐹𝑒, (𝑀 = 𝑀𝑜 𝑜𝑟 𝐹𝑒) (3)
and the corresponding replacement reaction energy (𝛥𝐸𝑟𝑒𝑝𝑙) is then given by
𝛥𝐸𝑟𝑒𝑝𝑙 = 𝐸
𝐻2𝑂𝐷𝐹𝑇+ 𝐸𝑀−𝑆−𝐹𝑒𝐷𝐹𝑇+𝑈 − 𝐸𝐻2𝑆𝐷𝐹𝑇 − 𝐸𝑀−𝑂−𝐹𝑒𝐷𝐹𝑇+𝑈 (4)
where 𝐸𝑀−𝑂−𝐹𝑒𝐷𝐹𝑇+𝑈 and 𝐸𝑀−𝑆−𝐹𝑒𝐷𝐹𝑇+𝑈 correspond to the energy of the surface model before and
after O replacement by S, respectively. We note here that for a particular surface model,
e.g. plane-Mo surface, the product structures of 𝑀 − 𝑆 − 𝐹𝑒 described in eqns. (1) & (3)
and the corresponding energies described in eqns. (2) & (4) are different due to the
adsorption and replacement happening at different sites. However, the reactant structures
of 𝑀 − 𝑉𝑂••− 𝐹𝑒 and 𝑀 − 𝑂 − 𝐹𝑒 described in eqns. (1) & (3) and the corresponding
energies described in eqns. (2) & (4) are the same because they only represent different
active sites on the same surface model. The optimized structures of S adsorbed on the
oxygen vacancy and S replacing an oxygen atom on the three surface models and their
corresponding reaction energies are provided in Figure 2.2. The three SFMO surface
models not only differ in number of Mo/Fe atoms and oxygen vacancy concentration on
the surface layer, they also possess different oxygen vacancy types such as, 𝑀𝑜 − 𝑉𝑂••−
𝐹𝑒 and 𝐹𝑒 − 𝑉𝑂••− 𝐹𝑒. The plane-Mo surface has only 𝑀𝑜 − 𝑉𝑂••− 𝐹𝑒 type oxygen
vacancies and FeO2- terminated surface has only 𝐹𝑒 − 𝑉𝑂••− 𝐹𝑒 type oxygen vacancies.
However, the diagonal-Mo surface has both types of oxygen vacancies on the surface
Our calculations suggest that the adsorption of S on the 𝐹𝑒 − 𝑉𝑂••− 𝐹𝑒 vacancy of
FeO2- terminated surface and diagonal-Mo surface is energetically more favorable than
on the 𝑀𝑜 − 𝑉𝑂••− 𝐹𝑒 vacancy of plane-Mo surface by -0.49 eV and -0.70 eV,
respectively. The adsorption of S on the 𝑀𝑜 − 𝑉𝑂••− 𝐹𝑒 vacancy of diagonal-Mo surface
is even less favorable than the plane-Mo surface by 0.39 eV. We note here that when S is
adsorbed on the 𝑀𝑜 − 𝑉𝑂••− 𝐹𝑒 vacancy of plane-Mo surface it forms a stronger bond
with Fe (dFe-S = 2.26 Å) and a weaker bond with Mo (dMo-S = 2.51 Å). On the
diagonal-Mo surface the S atom is mostly bonded to diagonal-Mo (dMo-S = 2.17 Å) without any interaction
with Fe and thus becomes the least stable structure compared to all the other S adsorbed
structures. These results suggest that the Fe atoms have strong tendency to adsorb S
atoms while Mo seems to exhibit some resistance towards S adsorption. Although the
dissociative adsorption at the most favorable 𝐹𝑒 − 𝑉𝑂••− 𝐹𝑒 vacancy site seems to be
stronger on the SFMO surfaces, the adsorption energies (-0.61 and -0.82 eV) are still
lower than the S adsorption energies reported for Ni (100) and Ni (111) surfaces. Wang
and Liu33 calculated the dissociative adsorption of H2S on Ni surfaces using PBE
functional and reported that the adsorption energy ranges from -2.64 eV to -2.16 eV on
Ni (100) surface and from -1.96 eV to -1.10 eV on Ni (111) surface when the surface
coverage of S is between 0.063 to 0.5 ML. Thus the SFMO surface is expected to be less
prone to sulfur poisoning than the conventional Ni based anodes.
Comparison of oxygen replacement reaction energies on the three surfaces also
reveal the same trend as dissociative adsorption energies, i.e., replacing 𝐹𝑒 − 𝑂 − 𝐹𝑒
than replacing 𝑀𝑜 − 𝑂 − 𝐹𝑒 type oxygen on the plane-Mo and diagonal-Mo surfaces. In
order to examine the stability of the adsorbed S atom on the SFMO surface either via
adsorption reaction or oxygen replacement reaction under fuel cell operating conditions,
we calculated the Gibbs free energies of these reactions which includes the entropy
contributions for gas molecules and allow us to make a direct comparison between these
two reactions on each surface model. The environmental effects at fuel cell operating
conditions can be taken into consideration by calculating the Gibbs free energy G(T,P) of
the reactants and products as a function of temperature (T) and pressure (P) from the
DFT+U results using ab initio atomistic thermodynamic method. The change in Gibbs
free energy (G) of reactions (1) and (3) can be written as:
𝛥𝐺𝑎𝑑𝑠 = 𝐺
𝐻2(𝑔)+ 𝐺𝑀−𝑆−𝐹𝑒 − 𝐺𝐻2𝑆(𝑔)− 𝐺𝑀−𝑉𝑂••−𝐹𝑒 (5)
𝛥𝐺𝑟𝑒𝑝𝑙 = 𝐺
𝐻2𝑂(𝑔)+ 𝐺𝑀−𝑆−𝐹𝑒− 𝐺𝐻2𝑆(𝑔)− 𝐺𝑀−𝑂−𝐹𝑒 (6)
where the Gibbs free energies of the oxide surfaces (𝐺𝑀−𝑂−𝐹𝑒, 𝐺𝑀−𝑉𝑂••−𝐹𝑒, and 𝐺𝑀−𝑆−𝐹𝑒) have relatively small variation with environmental effects and can be approximated by
the energies computed by DFT+U. On the contrary, the Gibbs free energy of the gas
phase molecules will be strongly affected by temperature (T) and pressure (P) and is
calculated using
𝐺(𝑔)(𝑇, 𝑃) = 𝐸𝑔𝑎𝑠𝐷𝐹𝑇 + 𝛥µ𝑔𝑎𝑠(𝑇, 𝑃0) + 𝑘𝐵𝑇𝑙𝑛 (𝑃
where 𝛥µ𝑔𝑎𝑠(𝑇, 𝑃0) can be calculated from the rotational, translational, and vibrational
partition functions of the gas molecule as a function of temperature under atmospheric
pressure (P0 = 1 atm). The pressure dependent contribution is provided in the third term
of eqn. (7). Since the surface structure is modified in the oxygen replacement reaction
(3), vibrational effects on the surface free energy would be important and thus we
calculated the vibrational free energy of the SFMO surfaces before and after S adsorption
and replacement reactions by considering few vibrational modes around the active site.
The active site (M-O-Fe or M-S-Fe) atoms and the neighboring oxygen atoms that are
directly connected to the active site are included in the frequency calculations.
Displacements of 0.001 Å were used along the x, y and z directions for all Hessian
constructions from analytic gradients. The vibrational free energy (𝐹𝑣𝑖𝑏(𝑇)) within the
harmonic approximation for n fundamental modes (with frequencies of i) of the system
can be expressed as:
𝐹𝑣𝑖𝑏(𝑇) = ∑ [1
2ħ𝜔𝑖+ 𝑘𝐵𝑇𝑙𝑛 (1 − 𝑒𝑥𝑝 (
−ħ𝜔𝑖
𝑘𝐵𝑇))]
𝑛
𝑖=1 (8)
Thus the variation of Gibbs free energy for the adsorption and replacement
reactions shown in eqns. (5) and (6) can be rewritten as,
𝛥𝐺𝑎𝑑𝑠(𝑇, 𝑃) = (𝐸
𝐻2𝐷𝐹𝑇+ 𝛥µ𝐻2(𝑇, 𝑃0))
+ (𝐸𝑀−𝑆−𝐹𝑒𝐷𝐹𝑇+𝑈 + 𝐹
−(𝐸𝐻2𝑆𝐷𝐹𝑇+ µ
𝐻2𝑆(𝑇, 𝑃0))
− (𝐸𝑀−𝑉𝐷𝐹𝑇+𝑈𝑂••−𝐹𝑒+ 𝐹𝑀−𝑉
𝑂••−𝐹𝑒
𝑣𝑖𝑏 (𝑇))
+ 𝑘𝐵𝑇𝑙𝑛 (𝑃𝑃𝐻2
𝐻2𝑆) (9)
𝐺𝑟𝑒𝑝𝑙(𝑇, 𝑃) = (𝐸
𝐻2𝑂𝐷𝐹𝑇+µ𝐻2𝑂(𝑇, 𝑃0))
+ (𝐸𝑀−𝑆−𝐹𝑒𝐷𝐹𝑇+𝑈 + 𝐹
𝑀−𝑆−𝐹𝑒𝑣𝑖𝑏 (𝑇))
−(𝐸𝐻2𝑆𝐷𝐹𝑇+µ
𝐻2𝑆(𝑇, 𝑃0))
− (𝐸𝑀−𝑂−𝐹𝑒𝐷𝐹𝑇+𝑈 + 𝐹
𝑀−𝑂−𝐹𝑒𝑣𝑖𝑏 (𝑇))
+ 𝑘𝐵𝑇𝑙𝑛 (𝑃𝑃𝐻2𝑆𝐻2𝑂) (10)
The calculated reaction free energies using eqns. (9) and (10) at a representative
temperature of 1100 K and assuming the partial pressure of gas molecules as 1 atm are
provided in Table 2.1. The pressure dependence of these reaction free energies are
displayed in the phase diagrams (Figure 2.3, G = 0 curve) which illustrate the stability
of the S atom on the three SFMO surfaces as a function of temperature and pressure. The
reaction free energies provided in Table 2.1 suggest that the dissociative adsorption of
H2S on the 𝑀𝑜 − 𝑉𝑂••− 𝐹𝑒 site is endergonic at high temperatures whereas on the
replacement reaction free energies on each surface suggests that the replacement reaction
is more favorable than the adsorption reaction and the oxygen replacement is exergonic
on all the surfaces at 1100 K.
The constructed phase diagram (Figure 2.3a) using eqn. (9) indicates that the
dissociative adsorption of H2S on the SFMO surface is favorable only when the H2S
concentration in the fuel stream is above 104 ppm at temperatures above 1000 K (PH2 = 1
atm). Considering that the H2S concentration in most fuel sources is below 300 ppm,11 we
can eliminate the possibility of poisoning the SFMO surface by dissociative adsorption of
H2S. In the phase diagram of oxygen replacement reaction (Figure 2.3b) the G = 0
curves are plotted against the partial pressure ratio of H2S and H2O. In a typical H2
oxidation process at SOFC anodes H2O concentration in the fuel stream is only about
3%.23,34 Assuming PH2O = 0.03 atm, Figure 2.3b suggests that replacing Mo-O-Fe type
oxygen by S is favorable only at high concentration of H2S (>103 ppm) in the temperature
range (900 – 1300 K) considered here. On the other hand, replacing Fe-O-Fe type oxygen
by S on the diagonal-Mo surface becomes feasible when the H2S concentration is > ~200
ppm at 1100 K and only need about 46 ppm of H2S at 900 K. In correlation with the
reaction free energies provided in Table 2.1, the FeO2- terminated surface is more prone
to S poisoning than the diagonal-Mo surface. On this surface, the replacement reaction
becomes exergonic when the H2S concentration increases above 17 ppm and 88 ppm at
temperatures 900 K and 1100 K, respectively. However, this amount is still higher than
the H2S concentration required for poisoning the Ni anodes. Matsuzaki and Yasuda
investigated the poisoning effect of sulfur-containing impurity on the electrochemical
polarization resistance and the overvoltage of the electrode increased when the H2S
concentration exceeded 0.05, 0.5, and 2 ppm at 1023, 1173, and 1273 K, respectively.7
Thus our computational results suggest that the SFMO electrodes in general are less
susceptible to sulfur poisoning compared to the conventional Ni based electrodes and
increasing the Mo concentration on the SFMO surface could further improve the
resistance towards sulfur poisoning.
Next, we examined the effect of the presence of sulfur in the SFMO surface on its
ability to electrochemically oxidize H2. In our recent work, we investigated various
pathways of the electrooxidation of H2 at different active sites on the three SFMO
surfaces.24 Our analysis based on periodic DFT and microkinetic modeling techniques
revealed that at relevant operating voltages and reaction conditions, H2O desorption
which produces surface oxygen vacancies is rate controlling for H2 oxidation on SFMO
surfaces. Thus, we were able to relate the activity of these surfaces to their ability to form
surface oxygen vacancies under SOFC operating conditions. The calculated current
densities on the three surfaces correlated well with the Gibbs free energies of the
reaction, 𝑀 − 𝑂 − 𝐹𝑒 + 𝐻2(𝑔) ↔ 𝑀 − 𝑉𝑂••− 𝐹𝑒 + 𝐻2𝑂(𝑔), (𝑀 = 𝑀𝑜 𝑜𝑟 𝐹𝑒). The
correlation revealed that the surface with higher Mo concentration on the gas exposed
layer (plane-Mo) has lower oxygen vacancy formation energy which in turn exhibited
higher activity towards H2 electrooxidation. On the other hand, the most stable FeO2
-terminated surface has higher oxygen vacancy formation energy and lower activity
towards H2 electrooxidation. In our current analysis, we identified that the plane-Mo
surface which exhibited higher activity is also less susceptible to sulfur poisoning and the
understand the effect of sulfur on the rate controlling surface vacancy formation process
on the FeO2- terminated surface, we calculated the Gibbs free energies of vacancy
formation process in the presence of S by considering various active sites as shown in
Table 2.2. The corresponding reactant structures and the exact oxygen/sulfur atom that is
removed to form a vacancy are illustrated in Figure 2.4. The reaction (a) in Table 2.2
corresponds to the surface vacancy formation process at 𝐹𝑒 − 𝑂 − 𝐹𝑒 site on a clean
FeO2- terminated surface. In reaction (b), we assume that H2 oxidation occurs at the
active site (𝐹𝑒 − 𝑆 − 𝐹𝑒) where the oxygen atom is already replaced by S and in reaction
(c) we examine the effect of S on H2 oxidation at a neighboring 𝐹𝑒 − 𝑂 − 𝐹𝑒 site. The
calculated Gibbs free energies of both reactions (b) & (c) are higher than the vacancy
formation free energy (1.07 eV)24 in the absence of sulfur (a). The free energy of reaction
(b) is 0.61 eV higher than the free energy of H2 oxidation at 𝐹𝑒 − 𝑂 − 𝐹𝑒 site, suggesting
that the rate of H2 oxidation at 𝐹𝑒 − 𝑆 − 𝐹𝑒 site will be much smaller than that of
𝐹𝑒 − 𝑂 − 𝐹𝑒 site. When S is present on the surface, the free energy of H2 oxidation at a
neighboring 𝐹𝑒 − 𝑂 − 𝐹𝑒 site is also about 0.1 eV higher than the free energy in the
absence of S. Thus in the presence of S, H2 oxidation rate at a neighboring 𝐹𝑒 − 𝑂 − 𝐹𝑒
site will be at least an order of magnitude lower than the surface without any adsorbed S.
In our earlier work,24 we have also shown that the oxygen vacancy formation free
energy of FeO2- terminated surface is greatly reduced in the presence of one and two Ni
adatoms. In accordance with experimental reports,19,23 these results suggested that Ni
improves the catalytic activity of SFMO anode by promoting the rate controlling oxygen
cell performance of Ni-SFMO anodes with time while operating in H2 fuel with 100 ppm
H2S.23 To further understand the detrimental effect of H2S on the Ni-SFMO anode
performance, we calculated the oxygen vacancy formation free energies of the FeO2-
terminated surface with a Ni3 cluster on top, both in the presence and absence of adsorbed
sulfur on Ni. The calculated free energies are provided in Table 2.3 (reactions d & e) and
the optimized structures are shown in Figures 2.4d & 2.4e. In the presence of Ni3 cluster,
the oxygen vacancy formation free energy is calculated as 0.14 eV which is 0.93 eV
smaller than the clean surface. Next, we examined the effect of S on the vacancy
formation free energy of Ni3/SFMO surface. It is well known that the dissociative
adsorption of H2S is highly favorable on Ni surfaces.33,35,36 Our calculations also suggest
that the reaction energy (𝐸𝑎𝑑𝑠) for the dissociative adsorption of H2S on the Ni3 cluster
is as high as -2.88 eV. This adsorption energy is higher than the reported dissociative
adsorption energies of H2S for Ni (100) (𝐸𝑎𝑑𝑠 = −2.64 𝑒𝑉) and Ni (111) (𝐸𝑎𝑑𝑠 =
−1.96 𝑒𝑉) at low coverage of S.33 This is not surprising considering that the Ni atoms in
the adsorbed Ni3 cluster are highly under-coordinated than the surface Ni atoms. The high
adsorption energy calculated for the Ni3 cluster suggests that the adsorbed S atom will be
stable at SOFC operating conditions even in the presence of <2 ppm of H2S. When S is
adsorbed on the Ni3 cluster, the vacancy formation free energy was calculated to be 0.74
eV which is 0.70 eV higher than the reaction free energy in the absence of adsorbed S
(Table 2.2). Thus, in agreement with experimental results23 these calculations confirm
that although Ni promotes the catalytic activity of SFMO anode by facilitating the surface
oxygen vacancy formation process, the activity will decrease with time due to the strong
concentration on the gas exposed layer not only exhibits higher catalytic activity (without
a need for additional Ni particles) but also shows high resistance to sulfur poisoning.
A better understanding of the detrimental effect of sulfur on the FeO2- terminated
surface both in the presence and absence Ni cluster can be obtained by analyzing the
electron density of these surfaces by computing Bader charges.37,38 These charges
provided in Table 2.3 can yield a qualitative picture of the reorganization of the electron
density upon adsorption of metal atoms or removal of neutral oxygen/sufur atom. In our
earlier work,24 we have identified that all the Fe atoms on the FeO2- terminated surface
(Sr16Fe12Mo4O43) layer are in Fe2+ state due to the presence of multiple oxygen vacancies
under SOFC operating conditions. Further removal of oxygen atom from this surface
during H2 oxidation process reduces the neighboring Fe atoms to an unstable Fe1+ state,
making this process highly endergonic. The calculated Bader charges on the active
oxygen and neighboring metal atoms on FeO2- terminated surface before and after
oxygen vacancy formation are provided in the top portion of the first two columns of
Table 2.3 for comparison. When an oxygen atom on the surface is replaced by sulfur
(Table 2.3, column 3), the neighboring Fe atoms are slightly reduced. Since sulfur has a
lower electronegativity than oxygen it donates some of its charge to the neighboring Fe
atoms, however oxygen tends to keep the extra charge. Thus sulfur forms strong covalent
bonds with Fe whereas the Fe-O bonds are more ionic: the closer the Bader charge is to
the formal oxidation state the more ionic is the bond. This is also the reason why the
oxygen replacement reaction by sulfur on this surface is highly favorable (Table 2.1).
When H2 oxidation was considered on the 𝐹𝑒 − 𝑆 − 𝐹𝑒 site (Table 2.2, reaction (b)), the
unfavorable. In Table 2.2, we have also shown that the presence of S on the surface
further affects the oxygen vacancy formation energy at a neighboring site. The charges
given in the last column of Table 2.3 (top) suggests that only part of the charge left on the
surface upon removal of oxygen atom is transferred to the neighboring Fe atoms. Further
analysis revealed that the remaining charge is transferred to the Fe/Mo and oxygen atoms
in the second layer making those bonds more ionic and the vacancy structure less stable.
The electronic effect of Ni on the oxygen vacancy formation in the presence and
absence of adsorbed sulfur can be analyzed from the calculated Bader charges provided
in the bottom portion of Table 2.3. When Ni3 cluster is adsorbed on the surface
(Sr16Fe12Mo4O43), a small amount of charge (0.54 𝑒−) is transferred from Ni to the
surface Fe atoms as we have shown in our earlier work for Ni2 adsorption.24 The average
charge on the Ni atom (𝑞𝑁𝑖𝑎𝑣𝑒) is only +0.18, suggesting that the Ni atoms are mostly in
metallic state. When the oxygen atom is removed from the surface, most of the extra
charge (~0.60 𝑒−) left by oxygen is transferred back to the Ni cluster and the Fe atoms
are not significantly further reduced. Thus Ni facilitates the rate controlling vacancy
formation process by accepting the extra electrons left by oxygen. When S is adsorbed on
the Ni cluster, the Ni atoms are more positively charged (𝑞𝑁𝑖𝑎𝑣𝑒 = +0.44) due to the
presence of negatively charged sulfur atom. However, we observed a similar amount of
charge transfer from Ni to the surface (0.53 𝑒−) and a slightly smaller back transfer of
charge from the surface to Ni (0.54 𝑒−) before and after oxygen vacancy formation,
respectively. Although the amount of charge transfer from the surface to Ni upon oxygen
be a repulsive interaction between negatively charged Ni and S atoms which destabilizes
the oxygen vacancy structure. Hence the promotional effect Ni could be suppressed by
the presence of strongly adsorbed S atoms.
2.5 CONCLUSIONS
Constrained ab initio thermodynamic simulations have been performed to
investigate the sulfur poisoning mechanism of different terminations of SFMO (001)
surfaces under SOFC operating conditions. Three surface models, namely plane-Mo,
diagonal-Mo, and FeO2- terminated surfaces with varying Mo and oxygen vacancy
concentration on the gas exposed layer were considered for this study. The interaction of
sulfur on these surfaces has been examined by considering two types of reactions:
dissociative adsorption of H2S and replacement of a surface oxygen by sulfur. Calculated
Gibbs free energies suggested that the oxygen replacement reaction by sulfur is favored
over dissociative adsorption of H2S on all the three surfaces. The phase diagrams further
revealed that the dissociative adsorption of H2S on these surfaces is favorable only when
the H2S concentration in the fuel stream exceeds 104 ppm at SOFC operating
temperatures. While replacing 𝑀𝑜 − 𝑂 − 𝐹𝑒 type oxygen by sulfur on the plane-Mo
surface (with higher Mo content on the surface layer) is also favorable only at high
concentration of H2S (>103 ppm), the replacement of 𝐹𝑒 − 𝑂 − 𝐹𝑒 type oxygen on the
diagonal-Mo and FeO2- terminated surfaces becomes feasible when H2S concentration is
<100 ppm. Nevertheless, the H2S concentration required for a favorable oxygen
replacement reaction is still higher than the amount required for poisoning the
poisoning than the Ni anodes and the SFMO surface with higher Mo content on the
exposed layer exhibits even better sulfur tolerance.
Furthermore, for the most stable and least active FeO2- terminated surface we also
examined the effect of sulfur on the surface oxygen vacancy formation process which
was identified in our earlier work as rate controlling process for H2 electro-oxidation.
When S is present on the surface, the free energy of vacancy formation becomes more
endergonic while considering H2 oxidation at 𝐹𝑒 − 𝑆 − 𝐹𝑒 site as well as at a
neighboring oxygen site. Although, adding small Ni3 cluster on the surface promotes
surface oxygen vacancy formation process, the presence of strongly adsorbed S atom on
the Ni3 cluster destabilizes the oxygen vacancy structure and thus will decrease the
activity of the anode with time. Overall, increasing the Mo content on the gas exposed
layer of SFMO anode not only improves its catalytic activity but also maintains excellent
sulfur tolerance.
2.6 ACKNOWLEDGEMENTS
This work was supported by the Heterogeneous Functional Materials Center
(HeteroFoaM), an Energy Frontier Research Center (EFRC) funded by the US
Department of Energy, Office of Basic Energy Science under Award No.
DE-SC0001061. Computations were carried out at the US Department of Energy facilities
located at the National Energy Research Scientific Computing Center (NERSC) and at
EMSL, located at Pacific Northwest National Laboratory (Grant Proposal 47447).
by the National Institute for Computational Sciences (NICS) and Texas advanced
Computing Center (TACC) under grant number TG-CTS090100. Finally, computing
resources from USC’s High Performance Computing Group are gratefully acknowledged.
2.7 REFERENCES
(1) EG&G Technical Services for NETL of U.S. Department of Energy, Fuel Cell Handbook, 2004.
(2) Atkinson, A.; Barnett, S.; Gorte, R. J.; Irvine, J. T. S.; McEvoy, A. J.; Mogensen, M.; Singhal, S. C.; Vohs, J. Nat Mater 2004, 3, 17-27.
(3) Minh, N. Q. J. Am. Ceram. Soc. 1993, 76, 563-588. (4) Minh, N. Q. Solid State Ionics 2004, 174, 271-277.
(5) Singh, P.; Minh, N. Q. International Journal of Applied Ceramic Technology 2004, 1, 5-15.
(6) Sasaki, K.; Susuki, K.; Iyoshi, A.; Uchimura, M.; Imamura, N.; Kusaba, H.; Teraoka, Y.; Fuchino, H.; Tsujimoto, K.; Uchida, Y.; Jingo, N. J. Electrochem. Soc. 2006, 153, A2023-A2029.
(7) Matsuzaki, Y.; Yasuda, I. Solid State Ionics 2000, 132, 261-269.
(8) Abild-Pedersen, F.; Lytken, O.; Engbaek, J.; Nielsen, G.; Chorkendorff, I.; Norskov, J. K. Surf. Sci. 2005, 590, 127-137.
(9) Singhal, S. C.; Ruka, R. J.; Bauerle, J. E.; Spengler, C. J. Anode Development for Solid Oxide Fuel Cells, Final Technical Report, Doe/Mc/22046-2371, 1986.
(10) Stolten, D.; Spah, R.; Schamm, R.; Stimming, U., Singhal, S. C., Tagawa, H., Lennert, W., Eds.; The Electrochemical Society Proceeding Series: Pennington, NJ, 1997; Vol. PV 97-40, p 88.
(11) Gong, M. Y.; Liu, X. B.; Trembly, J.; Johnson, C. J. Power Sources 2007, 168, 289-298.
(12) Yang, L.; Cheng, Z.; Liu, M. L.; Wilson, L. Energ Environ Sci 2010, 3, 1804-1809.
(13) Cheng, Z.; Zha, S. W.; Liu, M. L. J. Power Sources 2007, 172, 688-693. (14) Zha, S. W.; Cheng, Z.; Liu, M. L. J. Electrochem. Soc. 2007, 154, B201-B206. (15) Prasad, B. V. R. S. N.; Janardhanan, V. M. J. Electrochem. Soc. 2014, 161,
F208-F213.
(16) Weber, A.; Dierickx, S.; Kromp, A.; Ivers-Tiffee, E. Fuel Cells 2013, 13, 487-493.
(17) Marina, O. A.; Coyle, C. A.; Engelhard, M. H.; Pederson, L. R. J. Electrochem. Soc. 2011, 158, B424-B429.
(18) Liu, Q.; Dong, X.; Xiao, G.; Zhao, F.; Chen, F. Adv. Mater. 2010, 22, 5478-5482. (19) Xiao, G.; Chen, F. Electrochem. Commun. 2011, 13, 57-59.
(21) Munoz-Garcia, A. B.; Pavone, M.; Ritzmann, A. M.; Carter, E. A. PCCP 2013,
15, 6250-6259.
(22) Xiao, G.; Liu, Q.; Nuansaeng, S.; Chen, F. ECS Transactions 2012, 45, 355-362. (23) Xiao, G. L.; Jin, C.; Liu, Q.; Heyden, A.; Chen, F. L. J. Power Sources 2012,
201, 43-48.
(24) Suthirakun, S.; Ammal, S. C.; Muñoz-García, A. B.; Xiao, G.; Chen, F.; Loye, H.-C. z.; Carter, E. A.; Heyden, A. J. Am. Chem. Soc. 2014, (accepted for publication). (25) Kresse, G.; Furthmuller, J. Phys Rev B 1996, 54, 11169-11186.
(26) Kresse, G.; Joubert, D. Phys Rev B 1999, 59, 1758-1775.
(27) Perdew, J. P.; Burke, K.; Ernzerhof, M. Phys. Rev. Lett. 1996, 77, 3865-3868. (28) Blochl, P. E. Phys Rev B 1994, 50, 17953-17979.
(29) Monkhorst, H. J.; Pack, J. D. Phys Rev B 1976, 13, 5188-5192.
(30) Munoz-Garcia, A. B.; Pavone, M.; Carter, E. A. Chem. Mater. 2011, 23, 4525-4536.
(31) Makov, G.; Payne, M. C. Phys Rev B 1995, 51, 4014-4022. (32) Kroger, F. A.; Vink, H. J. Solid State Phys 1956, 3, 307-435.
(33) Wang, J. H.; Liu, M. L. Electrochem. Commun. 2007, 9, 2212-2217.
(34) Hansen, K. V.; Norrman, K.; Mogensen, M. J. Electrochem. Soc. 2004, 151, A1436-A1444.
(35) Lohsoontorn, P.; Brett, D. J. L.; Brandon, N. P. J. Power Sources 2008, 175, 60-67.
(36) Monder, D. S.; Karan, K. J Phys Chem C 2010, 114, 22597-22602.
(37) Bader, R. F. W. Atoms in Molecules - a Quantum Theory; Oxford University Press: New York, 1990.
2.8 TABLES AND FIGURES
Table 2.1 Gibbs free energies for the dissociative adsorption of H2S (𝐺𝑎𝑑𝑠, eqn. 9) and
oxygen replacement by H2S (𝐺𝑟𝑒𝑝𝑙, eqn. 10) on the SFMO (001) surface calculated at T
= 1100 K and Pgas = 1 atm.
Surface
Model Adsorption site 𝑮𝒂𝒅𝒔 (eV) Active site 𝑮
𝒓𝒆𝒑𝒍
(eV)
Plane-Mo 𝑀𝑜 − 𝑉𝑂••
− 𝐹𝑒 0.30 𝑀𝑜 − 𝑂 − 𝐹𝑒 -0.17
Diagonal-Mo
𝑀𝑜 − 𝑉𝑂••
− 𝐹𝑒 0.72 𝑀𝑜 − 𝑂 − 𝐹𝑒 -0.17
𝐹𝑒 − 𝑉𝑂••
− 𝐹𝑒 -0.33 𝐹𝑒 − 𝑂 − 𝐹𝑒 -0.47
FeO2-
terminated
𝐹𝑒 − 𝑉𝑂••
Table 2.2 Gibbs free energies (G) for the formation of an oxygen vacancy on the FeO2-
terminated SFMO surface in the presence and absence of sulfur and nickel under
reducing conditions (T = 1100 K, Pgas = 1 atm). 𝐹𝑒 − 𝑆 − 𝐹𝑒 represents the active site on
the FeO2- terminated surface after an oxygen atom of 𝐹𝑒 − 𝑂 − 𝐹𝑒 active site is replaced
by a sulfur atom and 𝑉𝑂•• is the oxygen vacancy.
Reaction G (eV)
(𝑎) 𝐹𝑒 − 𝑂 − 𝐹𝑒 + 𝐻2(𝑔) ↔ 𝐹𝑒 − 𝑉𝑂••− 𝐹𝑒 + 𝐻2𝑂(𝑔) 1.07
(𝑏) 𝐹𝑒 − 𝑆 − 𝐹𝑒 + 𝐻2(𝑔) ↔ 𝐹𝑒 − 𝑉𝑂••− 𝐹𝑒 + 𝐻2𝑆(𝑔) 1.68
(𝑐) 𝐹𝑒 − 𝑆 − 𝐹𝑒 − 𝑂 − 𝐹𝑒 + 𝐻2(𝑔)
↔ 𝐹𝑒 − 𝑆 − 𝐹𝑒 − 𝑉𝑂••− 𝐹𝑒 + 𝐻
2𝑂(𝑔)
1.16
(𝑑) 𝑁𝑖3/𝐹𝑒 − 𝑂 − 𝐹𝑒 + 𝐻2(𝑔) ↔ 𝑁𝑖3/𝐹𝑒 − 𝑉𝑂••− 𝐹𝑒 + 𝐻
2𝑂(𝑔) 0.14
(𝑒) 𝑆 − 𝑁𝑖3/𝐹𝑒 − 𝑂 − 𝐹𝑒 + 𝐻2(𝑔)
↔ 𝑆 − 𝑁𝑖3/𝐹𝑒 − 𝑉𝑂••− 𝐹𝑒 + 𝐻2𝑂(𝑔)
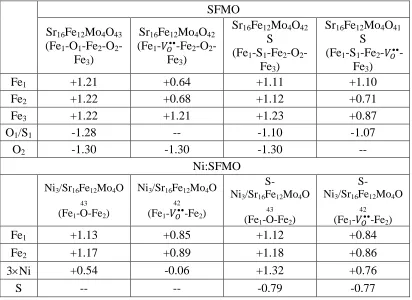
Table 2.3 Calculated Bader charges (in e) on the neighboring metals and active
oxygen/sulfur atom on the FeO2- terminated surface in the presence and absence of sulfur
and nickel cluster.
SFMO
Sr16Fe12Mo4O43
(Fe1-O1-Fe2-O2
-Fe3)
Sr16Fe12Mo4O42
(Fe1-𝑉𝑂••-Fe2-O2
-Fe3)
Sr16Fe12Mo4O42
S
(Fe1-S1-Fe2-O2
-Fe3)
Sr16Fe12Mo4O41
S
(Fe1-S1-Fe2-𝑉𝑂•• -Fe3)
Fe1 +1.21 +0.64 +1.11 +1.10
Fe2 +1.22 +0.68 +1.12 +0.71
Fe3 +1.22 +1.21 +1.23 +0.87
O1/S1 -1.28 -- -1.10 -1.07
O2 -1.30 -1.30 -1.30 --
Ni:SFMO
Ni3/Sr16Fe12Mo4O 43
(Fe1-O-Fe2)
Ni3/Sr16Fe12Mo4O 42
(Fe1-𝑉𝑂••-Fe2)
S-Ni3/Sr16Fe12Mo4O 43
(Fe1-O-Fe2)
S-Ni3/Sr16Fe12Mo4O 42
(Fe1-𝑉𝑂••-Fe2)
Fe1 +1.13 +0.85 +1.12 +0.84
Fe2 +1.17 +0.89 +1.18 +0.86
3Ni +0.54 -0.06 +1.32 +0.76
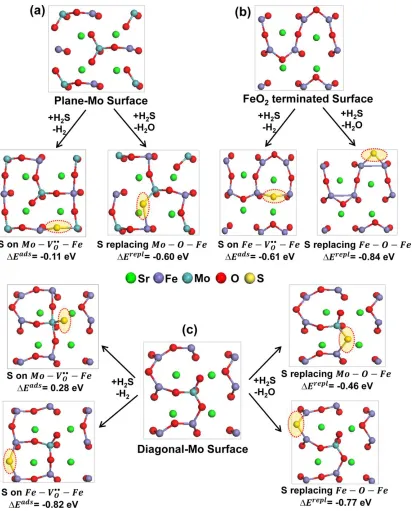
Figure 2.2 Top view of the optimized structures of S adsorbed on an oxygen vacancy
(𝑀 − 𝑉𝑂••− 𝐹𝑒, 𝑀 = 𝑀𝑜 𝑜𝑟 𝐹𝑒) and S replacing an oxygen atom (𝑀 − 𝑂 − 𝐹𝑒, 𝑀 =
𝑀𝑜 𝑜𝑟 𝐹𝑒) on the reduced SFMO (001) surface models (a ) plane-Mo surface (b) FeO2
-terminated surface, and (c) diagonal-Mo surface. 𝛥𝐸𝑎𝑑𝑠 and 𝛥𝐸𝑟𝑒𝑝𝑙 provided under each structure correspond to the reaction energy of dissociative adsorption of H2S (𝐻2𝑆 +
𝑀 − 𝑉𝑂•• − 𝐹𝑒 ↔ 𝐻
2+ 𝑀 − 𝑆 − 𝐹𝑒) and oxygen replacement by S (𝐻2𝑆 + 𝑀 − 𝑂 −
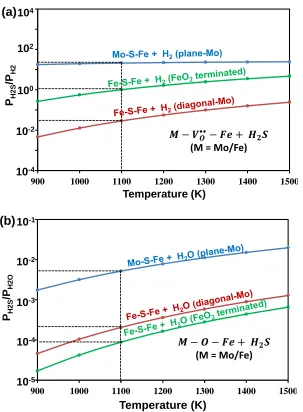
Figure 2.3 Calculated phase diagrams for the interaction of S on SFMO (001) surfaces (a) dissociative adsorption of H2S on an oxygen vacancy (𝐻2𝑆 + 𝑀 − 𝑉𝑂••− 𝐹𝑒 ↔ 𝐻2+
𝑀 − 𝑆 − 𝐹𝑒, 𝑀 = 𝑀𝑜 𝑜𝑟 𝐹𝑒) (b) oxygen replacement reaction by S (𝐻2𝑆 + 𝑀 − 𝑂 −
𝐹𝑒 ↔ 𝐻2𝑂 + 𝑀 − 𝑆 − 𝐹𝑒, 𝑀 = 𝑀𝑜 𝑜𝑟 𝐹𝑒).
900 1000 1100 1200 1300 1400 1500
Temperature (K)
PH2S
/P
H2O
10-5
10-4
10-3
10-2
10-1 (b)
(M = Mo/Fe)
900 1000 1100 1200 1300 1400 1500
Temperature (K)
PH2S
/P
H2
10-4
10-2
100
102
104 (a)
(M = Mo/Fe)
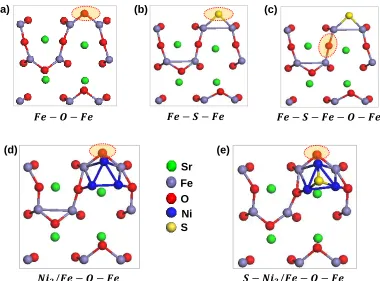
Figure 2.4Top view of reactant structures corresponding to the reactions provided in Table 2.2. Highlighted atom represents the atom removed during surface vacancy formation.
(a) (b) (c)
(d) (e)
Sr
CHAPTER 3
UNCERTAINTY QUANTIFICATION FRAMEWORK APPLIED TO THE
WATER-GAS SHIFT REACTION OVER PT-BASED CATALYSTS
1_____________________________________
1
Walker, E.; Ammal, S. C.; Terejanu, G. A.; Heyden, A. J. Phys. Chem. C, 2016, 120, 10328–10339.
3.1 ABSTRACT
This paper presents a systematic approach to quantify uncertainties of various
quantities of interest (QoIs) in catalysis determined by microkinetic models developed
from first principles. One of the main sources of uncertainty in any microkinetic
simulation is attributed to the exchange-correlation approximations in density functional
theory (DFT) used to calculate the rate constants for all elementary reaction steps within
transition state theory. These DFT approximations are at the core of significant
discrepancies between computational simulations and experimental measurements.
Therefore, any model calculation should be accompanied by a measure of uncertainty.
This work uses probability to represent uncertainties and latent variable models to
develop probabilistic models that account for errors and correlations in DFT energies.
These probabilistic models are further constrained to known reaction thermodynamics,
and then propagated to QoIs such as turnover frequency (TOF), apparent activation
barrier, and reaction orders. The proposed uncertainty quantification (UQ) framework is
applied on the water−gas shift reaction (WGS: CO + H2O ⇌ CO2 + H2). Specifically, this
WGS study models a Pt/TiO2 catalyst as a Pt8 cluster supported on a rutile TiO2 (110)
surface, where DFT energies are obtained using four separate functionals PBE, RPBE,
HSE, and M06L that each have their own justification for being appropriate for this
study. In this way, information from three different classes of functionals, GGA
(generalized-gradient approximation), meta-GGA, and hybrid functionals, are used to
generate a free energy probabilistic model. Although the uncertainty in model results
spans orders of magnitude, a new approach is introduced to identify the dominant
experimental kinetic data; however, the probability densities for TOF, apparent activation
barrier, and reaction orders are relatively wide due to different flavors of DFT predicting
a wide variation of transition state and oxygen vacancy formation energies. Nevertheless,
we can conclude with high certainty that a CO-promoted redox cycle is the dominant
mechanism over the temperature range 473−600 K and that formate and carboxyl
pathways are not playing any role for the investigated active site model.
3.2 INTRODUCTION
Microkinetic models play an important role in understanding reaction kinetics and
production rates on macroscopic scales. The insight provided by microkinetic model
simulations can be used to speed up the rational design of novel catalytic materials.1−3
Density functional theory (DFT) provides a good starting point to estimate (together with
harmonic transition state theory) the values of rate constants for each elementary step in
the microkinetic model. However, DFT calculations have inadequacies due to
exchange-correlation approximations, which induce significant errors in the prediction of
macroscopic quantities of interest (QoI) such as turnover frequency (TOF), apparent
activation barrier, and reaction orders. For example, a variation of only 0.2 eV in a DFT
predicted activation barrier leads to an uncertainty of 2 orders of magnitude in an
elementary reaction rate constant in a catalytic cycle at 500 K, which again can lead to
significant uncertainty in microkinetic modeling results. Therefore, new computational
tools are required to quantify uncertainties in DFT calculations, propagate them to QoIs,
and guide the process of drawing conclusions under uncertainty. We note that we limit
uncertainties related to estimating entropies and using harmonic transition state theory. In
fact, we assume that these uncertainties are small relative to the uncertainties in DFT
energies such that they can approximately be mapped into the uncertainties of the DFT
energies (an approximation that might not be valid for some surface states). We note that
considering these uncertainties does not constitute any additional complication and our
proposed framework can in principle be extended to include these uncertainties. Also, we
are not concerned with inadequacies of our active site model structure and number of
elementary reaction steps but aim at predicting the QoIs for a given active site model and
reaction mechanism.
Previously, a number of research groups such as Mortensen et al.,4 Cramer,5 and
Hanke6 have investigated the errors in DFT energies of functionals commonly used in
heterogeneous catalysis. Also, Vlachos and co-workers7,8 have proposed corrections for
energies of formation and binding energies obtained by DFT calculations to explain
differences in DFT energies and experimental observations. Errors in DFT energies have
often been assumed to behave systematically; e.g., a constant correction term was
assigned to any species containing an OCO backbone.9 This systematic error was
determined by comparing DFT energies of gas molecules to National Institute of
Standards and Technology (NIST) data.10 While such a systematic approach is appealing,
there is little scientific justification regarding why errors in DFT energies can be divided
into atom groups that are transferable to systems containing transition metal surfaces.
Recently, Petzold et al.11 have proposed the use of databases of electronic density
functionals fit by Bayes formula. This research led to the Bayesian error estimation−van
DFT energies. BEEF-vdW is based on using empirical data of microscopic properties
such as binding energies to infer errors and correlations in DFT energies due to the
exchange-correlation functional approximation. Medford et al.12 recently found by
studying the ammonia synthesis reaction that these correlations in energies play an
important role in reducing the uncertainty in QoIs such as TOFs. One way to obtain
correlations is to use the ensemble or a subset of the ensemble of functionals from
BEEF-vdW.4,12−14 However, these correlations are based strictly only on generalized-gradient
approximation (GGA) functionals, and GGAs can face issues when electrons become
localized such as in oxide systems.15,16 For example, in the system of consideration,
oxygen vacancies are formed on a TiO2 surface, and a strategy based exclusively on
GGA functionals for estimating errors and their correlation risks underestimating the
inherent uncertainties since all GGA functionals will overdelocalize electrons which
leads to lower vacancy formation energies.
In this work, we propose to describe the uncertainty in DFT energies by explicitly
accounting for information provided by various classes of functionals such as GGA,
meta-GGA, as well as hybrid functionals. Specifically, we only choose DFT functionals
(PBE,17 RPBE,18,19 HSE,20 and M06L21) that have some justification to be used in a DFT
study of the active site model structure and that are all known to have different
limitations relevant for the reaction mechanism. Next, DFT energies calculated with these
functionals are used in a factor analysis22 to develop a probabilistic latent variable model
that accounts for errors and correlations in DFT energies. This probabilistic model is
further extended to ensure that samples of DFT energies are constrained to known
model for energy correction of gas molecules based on the Dirichlet distribution.23 The
uncertainty captured by this composite probabilistic model for DFT energies is
propagated through the microkinetic model to QoIs using Monte Carlo simulations.
Specifically, the composite probabilistic model is used to generate correlated and
thermodynamically constrained DFT energy samples, which are then used to calculate
rate constants in the microkinetic model. Finally, the uncertainty in the QoIs such as
TOF, reaction orders, and apparent activation energy is captured by samples
corresponding to the QoI predictive distribution. As the model calculations are no longer
deterministic but rather probabilistic, new tools are required to draw conclusions under
uncertainty. This work introduces the information theoretic quantity, Kullback− Leibler
divergence, to determine the dominant pathway by finding the smallest divergence
between the probability density function (PDF) of the overall TOF and the PDF of
individual pathway TOF.
To summarize, uncertainty quantification (UQ) is the process of assessing and
representing uncertainties in model simulations such that their impacts on the QoIs can be
determined. This paper presents a systematic approach to quantify uncertainties in QoIs
calculated using microkinetic models. The proposed UQ framework for computational
catalysis consists of three distinct processes: (1) quantifying uncertainties in DFT
energies, (2) propagating uncertainties to QoIs, and (3) drawing conclusions using
uncertain QoIs. To showcase the proposed UQ framework, we apply it to our recent
The WGS is an essential step in industrial chemical processes utilizing
hydrogen.24−33 Besides producing hydrogen, the WGS consumes carbon monoxide (CO)
which is beneficial because CO is a poison for noble metal catalysts and catalysts used in
fuel cell applications.26,32,33 With these important applications comes a desire to
understand the WGS over relevant catalyst systems. The case study in this work builds
upon a theoretical investigation24 of the WGS over an active site at a three-phase
boundary (TPB) of a metal nanoparticle, a reducible metal oxide support, and a gas
phase. It has been hypothesized that TPB sites are the origin of unique activity and
selectivity of various reducible oxide supported metal cluster catalysts. For example, gold
(Au) catalysts on reducible oxide supports possess a unique activity attributed to TPB
sites.34−36 The specific catalyst of this case study is platinum supported by titanium oxide
(Pt/TiO2).37−39 Pt/TiO2 reports more activity than systems of Pt on other mixed oxides34
and has been investigated for low and medium temperature WGS reactions.40−47 A
current question of high interest is if individual metal atoms or metal
clusters/nanoparticles supported on reducible oxide supports are the active site for
catalysis.48−50 DFT calculations and microkinetic modeling can be used to shed more
light on the activity of various active site models and has been used here for a Pt8/TiO2
(110) catalyst model characteristic of a metal cluster on rutile TiO2. At the same time,
describing the electronic structure of reaction intermediates and transition states at the
interface of a Pt cluster and a TiO2 support during the WGS is quite challenging with
DFT considering that regions of the active site model are clearly metallic while the oxide
support is a semiconductor. Considering furthermore that the oxygen vacancy formation