1304
Evaluation of vector embedding models in clustering of text documents
Tomasz Walkowiak
University of Science and Technology, Faculty of Electronics,
Wybrzeze Wyspianskiego 27, Wroclaw 50-370, Poland
Mateusz Gniewkowski
University of Science and Technology, Faculty of Computer Science and Management,
Wybrzeze Wyspianskiego 27, Wroclaw 50-370, Poland
Abstract
The paper presents an evaluation of word embedding models in clustering of texts in the Polish language. Authors verified six different embedding models, starting from widely used word2vec, across fast-Text with character n-grams embedding, to deep learning-based ELMo and BERT. Moreover, four standardisation methods, three distance measures and four cluster-ing methods were evaluated. The analy-sis was performed on two corpora of texts in Polish classified into subjects. The Ad-justed Mutual Information (AMI) metric was used to verify the quality of cluster-ing results. The performed experiments show that Skipgram models with n-grams character embedding, built on KGR10 cor-pus and provided by Clarin-PL, outper-forms other publicly available models for Polish. Moreover, presented results sug-gest that Yeo–Johnson transformation for document vectors standardisation and Ag-glomerative Clustering with a cosine dis-tance should be used for grouping of text documents.
1 Introduction
A number of digital repositories of texts enlarge each year. The variety of tools for natural lan-guage processing and the quality of their perfor-mance are growing steadily. That opens possibili-ties for automatic categorisation of text documents in terms of the subject areas in any digital collec-tion of documents. It is also an important problem for researchers from different areas of the human-ities and social science (Eder et al.,2017).
Commonly used methods rely on representing documents with feature vectors and using
clus-tering algorithm (Hastie et al., 2009) to assign documents to some groups. The classical feature vectors are based on the bag-of-words technique (Harris,1954). Components of these vectors rep-resent frequencies (weighted) of occurrences of words/terms in individual documents. The con-temporary state-of-the-art technique is word2vec (Le and Mikolov, 2014), where individual words are represented by high-dimensional feature vec-tors trained on large text corpora. This technique is constantly being improved. This is demonstrated by the most recent propositions of algorithms like ELMo (Peters et al.,2018) or BERT (Devlin et al., 2018). Choosing the most useful clustering algo-rithm is not a trivial task since there is a large num-ber of them. Just to mention the most popular ones like K-means (K.Jain,2009), Agglomerative Hier-archical Clustering (Day and Edelsbrunner,1984) and Spectral Clustering (Ng et al.,2002). More-over, the results of clustering are strongly depen-dent on the chosen distance measure and the used method of an input data standardisation. The en-tire workflow, described above, expresses many factors which can influence results of the text ex-ploration. It is difficult to control them and thus, might lead to unpredictable outcomes of the ex-periment. It becomes challenging for texts in an inflected language such as Polish.
Bo-Table 1: Used embedding models
name method feature tool size address
IPIPAN CBOW forms gensim 300 dsmodels.nlp.ipipan.waw.pl
KGR10 Skipgram forms, character n-grams fastText 300 hdl.handle.net/11321/606
KGR10 lemma Skipgram lemmas,character n-grams fastText 300 hhdl.handle.net/11321/606
fastText CBOW+8 orths, character 5-grams fastText 300 fasttext.cc
elmo ELMo forms ELMo 1024 vectors.nlpl.eu/repository/11/167.zip
bert BERT multilingual forms, sentences BERT 768 github.com/google-research/bert
3.3 Quality Metrics
Evaluation of clustering quality may be performed in two different ways: with external knowledge of sample membership or without it. The first way is usually better if we have already labelled data and using supervised learning is none of our options. For example, we know that the clustering problem we want to solve concerns similar data we have la-belled, which is a case in this work. We compare how different vector representation of documents, which have an assigned label to it, can be clus-tered.
There are plenty of clustering quality measures that have a different interpretations, likepurity, V-measure orRand Index (Amigo et al., 2009). In our work, we decided to use corrected for a chance measures where the result does not increase with several clusters for randomly chosen labels. Two most common metrics are Adjusted Rand Index (ARI) and Adjusted Mutual Information (AMI) (Vinh et al.,2010). According to (Romano et al., 2016) AMI is better suited to our problem as doc-uments types are often unbalanced. It gives more weight to a clustering solutions with purer small groups than to minor mistakes in bigger ones.
Adjusted mutual information score is one of the information theoretically based measures. It is based on mutual information (MI) which comes naturally from entropy.
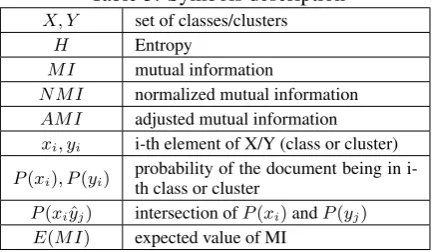
Table 3: Symbols description
X, Y set of classes/clusters
H Entropy
M I mutual information
N M I normalized mutual information AM I adjusted mutual information xi, yi i-th element of X/Y (class or cluster)
P(xi), P(yi) probability of the document being in i-th class or cluster
P(xiˆyj) intersection ofP(xi)andP(yj) E(M I) expected value of MI
H(X) =X i
P(xi) log 1
P(xi)
M I(X, Y) =X i
X j
P(xi∩yj) log
P(xi∩yj)
P(xi)P(yi)
The problem with mutual information is that the maximum is reached not only when labels from one set (clusters) matches perfectly those from the other (classes), but also when they are further sub-divided. The simple solution for that is to nor-malise MI by mean of entropy ofXandY:
N M I(X, Y) = M I(X, Y) (H(X) +H(Y))/2
Normalised mutual information can be further im-proved by subtracting expected value of MI from nominator and denominator:
AM I(X, Y) = M I(X, Y)−E(M I) (H(X) +H(Y)/2−E(M I)
This is what is called ”corrected for a chance”. The general form of AMI was proposed in (Hubert and Arabie,1985).
4 Experiments
4.1 Data Sets
The second corpus (Reviews) consists of re-views of scientific works from 21 different science areas. The achieved accuracy on this data set by fastText (Joulin et al., 2017) in supervised classi-fication was90.7%(after division 2:1 for training and testing). There are ca. 10,500documents in this corpus.
4.2 Idea
The goal of our experiments was to find the best performing word embedding model in a cluster-ing problem. In order to do that, first, we checked how standardisation affects results and picked one of the methods to use it in further tests. Then we compared several models using different clus-tering approaches with and without standardisa-tion. In order to generate feature vectors for docu-ments (doc2vec) we averaged word/sentence em-beddings for every text in the dataset.
4.3 Choosing the Standardisation Method
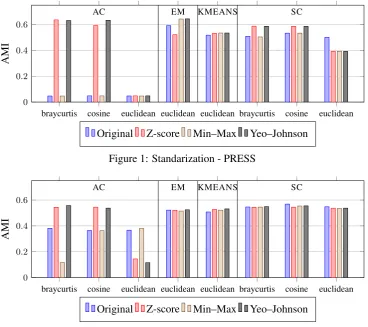
We performed our first experiment as follows: having the documents di ∈ D represented as doc2vec vectors from KGR10 lemma model, we performed several tests to evaluate the quality measure (AMI) of multiple clustering algorithms with different distance functions. The results are given in the Figure1and Figure 2. It can be ob-served that for EM, K-means and SC standardi-sation does not significantly improve the results. What is more, for Euclidean distance, data scaling may blur the distances between points and worsen the quality of the solution. On the other hand, us-age of standardisation methods with Agglomera-tive Clustering (AC) algorithm improves obtained results. It is not surprising as the linkage method strongly depends on variance especially when us-ing a cosine distance. On average (the average height of the AMI score) the best method of stan-dardisation turned out to be Yeo–Johnson transfor-mation, so we used it in subsequent experiments.
4.4 Model Comparison
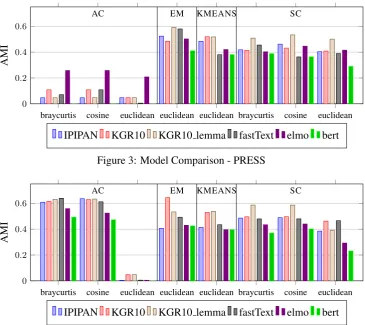
In order to compare how the chosen model af-fects quality, we performed multiple tests, simi-lar to the previously conducted. They were eval-uating the quality measure due to used doc2vec representations, generated from models described in Section 2. The results of clusterisation of the original data can be observed in figures 3 and 5 alongside with the results of standardised vectors with Yeo–Johnson transformation in figures4and
braycurtis cosine euclidean euclidean euclidean braycurtis cosine euclidean 0
0.2 0.4 0.6
AC EM KMEANS SC
AMI
Original Z-score Min–Max Yeo–Johnson
Figure 1: Standarization - PRESS
braycurtis cosine euclidean euclidean euclidean braycurtis cosine euclidean 0
0.2 0.4 0.6
AC EM KMEANS SC
AMI
Original Z-score Min–Max Yeo–Johnson
Figure 2: Standarization - REVIEWS
5 Conclusion
As a conclusion, we would like to recommend using Yeo–Johnson transformation to standardise doc2vec embedding and if a task is to group doc-uments, Agglomerative Clustering (AC) with a cosine distance. For researchers who deal with Polish datasets, we strongly recommend using KGR10 lemma or KGR10 word2vec models ( Ko-con and Gawor,2019)9. First of them gives better results but the second one (only slightly worse) is much faster in a usage, since it does not require a time consuming lemmatization of texts. We are now working on implementing the best selected workflow as a part of WebSty (Eder et al.,2017), an online tool10 aimed for researchers in humani-ties and social science working with texts in Pol-ish.
Although, that ELMo and BERT perform great in many tasks in NLP our results show otherwise. Two factors can be responsible for this. First, we used already trained models downloaded from the addresses shown in Table.1. As they might not be
9
http://hdl.handle.net/11321/606
10http://ws.clarin-pl.eu/websty.shtml
the best quality for the Polish language, we cur-rently training our own model to verify this hy-pothesis. The second reason may be that both BERT and ELMo do not work well with the dis-cussed problem. It is hard to find any article deal-ing with document clusterdeal-ing problem usdeal-ing those methods.
We plan to test other methods of composing document vectors, i.e. representing documents by several concatenated vectors. We want to test two approaches. One is based on a division of documents into parts and generating doc2vec for each part. And the second, based on clustering of word embeddings into a predefined number of groups and using centroids as elements of final document vectors.
braycurtis cosine euclidean euclidean euclidean braycurtis cosine euclidean 0
0.2 0.4 0.6
AC EM KMEANS SC
AMI
IPIPAN KGR10 KGR10 lemma fastText elmo bert
Figure 3: Model Comparison - PRESS
braycurtis cosine euclidean euclidean euclidean braycurtis cosine euclidean 0
0.2 0.4 0.6
AC EM KMEANS SC
AMI
IPIPAN KGR10 KGR10 lemma fastText elmo bert
Figure 4: Model Comparison - PRESS (standardised with Yeo–Johnson transformation)
braycurtis cosine euclidean euclidean euclidean braycurtis cosine euclidean 0
0.2 0.4 0.6
AC EM KMEANS SC
AMI
IPIPAN KGR10 KGR10 lemma fastText elmo bert
Figure 5: Model Comparison - REVIEWS
braycurtis cosine euclidean euclidean euclidean braycurtis cosine euclidean 0
0.2 0.4 0.6
AC EM KMEANS SC
AMI
IPIPAN KGR10 KGR10 lemma fastText elmo bert