© 2016, IRJET | Impact Factor value: 4.45 | ISO 9001:2008 Certified Journal
| Page 1593
An Algorithm for Blurred Thermal image edge enhancement for
security by image processing technique
Vinay Negi
1, Dr.K.P.Mishra
21
ECE (PhD Research scholar), Monad University, India, Hapur
2ECE, KIET, Ghaziabad, India
---***---Abstract -
For Security purposes, detecting the edges of images canny edge detector has been showed to have better detective effect in the image edge detection techniques. However, canny method also has some deficiencies .So in this paper; a technique is proposed for those security applications where information about blurred thermal image edges is required. The performance of experiment shows the better information of infrared image’s edges of essential target object.Key Words
:
Gradient magnitudes, Smoothing, local
maxima,canny edge detector.
1.INTRODUCTION
Detection of edges is an well known image processing method for extraction of the edges of blurred image. It process by extracting discontinuities in brightness. Edge detection is used for segmentation of blurred images and edge detection in application such as image processing for security applications.
In this paper, an algorithm is proposed for those security applications where information about blurred thermal image edges is required. In this technique, Edges of the essential target object is detected by enhancing the essential target object’s edges and then detect the edges by canny edge detector. Then fusion technique is used to find better essential edges by fusing canny edge detector’s output and highlighted essential target object’s edges. The performance of experiment shows the better information of infrared image’s edges of essential target object.
2.B
ACKGROUNDThe Canny operator process in a multi-step. Here the blurred thermal image is smoothed by Gaussian convolution. And a
2-D first derivative operator is used to the smoothed image to highlight area of the blurred thermal image with high first spatial derivatives. Edges give rise to ridges in the gradient magnitude blurred thermal image. The algorithm then sense along the top of these ridges and sets to zero all pixels that are not actually on the ridge top so as to give a thin line in the output, a process known as non-maximal suppression. The steps exhibits hysteresis controlled by two thresholds: A1 and A2, with A1 > A2. Sensing can only start at a point on a ridge greater than A1. Sensing then continues in two directions out from that point until the height of the ridge falls below A2. This hysteresis helps to ensure that blurred edges are not broken up into different edge fragments.
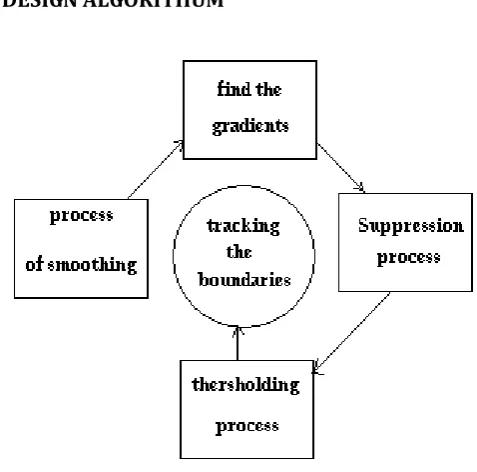
3. DESIGN ALGORITHUM
Fig -1: Illustration of process involved in canny detection technique.
[image:1.595.319.558.457.693.2]© 2016, IRJET | Impact Factor value: 4.45 | ISO 9001:2008 Certified Journal
| Page 1594
The algorithm has five different processes:A. Process of Smoothing:
Blurring of the thermal image to reduce noise.
B. gradients of blurred thermal image:
The blurred thermal image edges should be point out where the gradients of the image has large intensity.
C.Non-maximum suppression:
In this step, the local maxima should be pointed as edges.
D. Thresholding:
Here by the use of double thresholding, Potential edges are determined by thresholding.
E.Blurred thermal image tracking:
Final edges are find by suppressing all edges that are not connected to a very strong edge.
Every Process is detailed in the following headings:-
1) Smoothing:
It is notice that all images will have some amount of distortion. To prevent that distortion is mistaken for edges, distortion must be removed. so the image is first smoothed by applying a Gaussian filter. The kernel of a Gaussian filters with a standard deviation of σ= 1.4 is as follow:-
2) Finding gradients:
This algorithm mainly determines edges where the greyscale intensity of the image vary the most. These areas are found by determining gradients of the image. Gradients at each pixel in the smoothed image are determined by applying what is known as the Sobel-operator. First process is to approximate the gradient in the x- and y-direction respectively by applying the kernel as follow:-
The gradient magnitudes (also known as the edge strengths) can then be determined as an Euclidean distance measure by applying the law of Pythagoras It is sometimes simplified by applying Manhattan to
Reduce the computational complexity. The Euclidean distance measure has been applied to the test image. The computed edge strengths are compared to the smoothed image:
where: Gx and Gy are the gradients in the x- and y-directions respectively. To make it possible to determine this, the direction of the edges must be determined and stored as shown:
3) Non-maximum suppression:
Non-maximum suppression can help to suppress all the gradient values to 0 except the local maximal, which indicates location with the sharpest change of intensity value. The algorithm for each pixel in the gradient image is:
1. Compare the edge strength of the current pixel with the edge strength of the pixel in the positive and negative gradient directions.
© 2016, IRJET | Impact Factor value: 4.45 | ISO 9001:2008 Certified Journal
| Page 1595
4) Double thresholdingAfter application of non-maximum suppression, the edge pixels are quite accurate to present the real edge. However, there are still some edge pixels at this point caused by noise and color variation. In order to get rid of the spurious responses from these bothering factors, it is essential to filter out the edge pixel with the weak gradient value and preserve the edge with the high gradient value. Thus two threshold values are set to clarify the different types of edge pixels, one is called high threshold value and the other is called the low threshold value. If the edge pixel’s gradient value is higher than the high threshold value, they are marked as strong edge pixels. If the edge pixel’s gradient value is smaller than the high threshold value and larger than the low threshold value, they are marked as weak edge pixels. If the pixel value is smaller than the low threshold value, they will be suppressed. The two threshold values are empirically determined values, which will need to be defined when applying to different images.
5) Edge tracking by hysteresis
Strong edges are interpreted as “certain edges”, and can immediately be included in the final edge image. Weak edges are included if and only if they are connected to strong edges. The logic is of course that noise and other small variations are unlikely to result in a strong edge. Thus strong edges will only be due to true edges in the original image. The weak edges can either be due to true edges or noise/color variations. The latter type will probably be distributed independently of edges on the entire image, and thus only a small amount will be located adjacent to strong edges. Weak edges due to true edges are much more likely to be connected directly to strong edges. Edge tracking can be implemented by Binary Large Object. The edge pixels are divided into connected Binary Large Object using 8-connected neighborhood. Binary Large Object containing at least one strong edge pixels are then preserved, while other Binary Large Object is suppressed.
4. METHODOLOGY
Steps for An Algorithm for Blurred Thermal image edge enhancement for security by image processing technique
1) Aquasition of Blurred Thermal image:
Acquire an Thermal image by acquisition Technique which is blurred.
2) Background Subtraction method:
Here, background subtraction method is used to subtract the background of blurred thermal image.
3) Boundary detection:
Boundaries detected by canny edge detection method of both processed and original blurred thermal image
4) Extraction and combination of quality information
Fusion of processed blurred thermal images and unprocessed image.
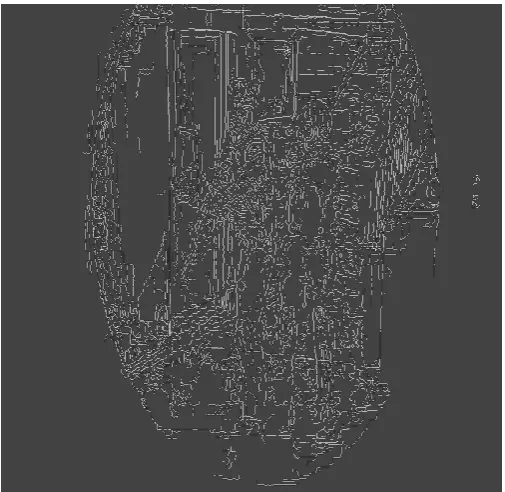
5. RESULT
Blurred thermal images which are acquired from infrared camera for security purposes are processes and edges of the blurred thermal image and output blurred thermal image of canny edge detector. the outcome achieved by this approach indicate the enhanced and much clearer edges of the blurred thermal image. Which are as follows:-
© 2016, IRJET | Impact Factor value: 4.45 | ISO 9001:2008 Certified Journal
| Page 1596
Fig -3: Illustration of graph of brightness of blurred thermalimage.
Fig-4:Illustration of blurred thermal image after background substraction
Fig -5: Illustration of graph of brightness of blurred thermal image after background substraction.
Fig -6: Illustration of fusion of processed and unprocessed blurred thermal image of criminals.
6. CONCLUSION
[image:4.595.198.551.47.361.2] [image:4.595.33.299.66.351.2] [image:4.595.308.561.397.643.2] [image:4.595.36.289.403.667.2]© 2016, IRJET | Impact Factor value: 4.45 | ISO 9001:2008 Certified Journal
| Page 1597
thermal image from canny edge detector show the muchenhanced outcomes specially for security application.
REFERENCES
[1] Sergei Azernikov. Sweeping solids on manifolds. In Symposium on Solid and Physical Mod-eling, pages 249– 255, 2008
[2] ZHANG Yongliang,LIU Anxi, Improved algorithm for computer digital lmage edge detection based on Prewitt operator, Journal of PLA University of Science and Technology ,6(1):45-47, 2005.
[3] J. F. Canny,”A computational approach to edge detection,”IEEE Trans. Pattern Analysis and Machine Intelligence, 8:679-698, 1986
[4] Y.B.Yuan,A fast algorithm for determinging the gaussian filtered mean line in surface metrology, PrecisionEng., 24: 62-69,2000.