ISSN(Online): 2319-8753 ISSN (Print): 2347-6710
I
nternational
J
ournal of
I
nnovative
R
esearch in
S
cience,
E
ngineering and
T
echnology
(A High Impact Factor, Monthly, Peer Reviewed Journal)
Visit: www.ijirset.com
Vol. 6, Issue 10, October 2017
Reactive Power Dispatch by Modal Analysis
based on Contingency Ranking and
Comparison with other Techniques
M S Suresh1, M S Indira2
Associate Professor, Department of Electrical & Electronics Engineering, Sir M V I T, Bengaluru, Karnataka, India1
Professor, Department of Electrical & Electronics Engineering, M S RUAS, Bengaluru, Karnataka, India2
ABSTRACT: Electrical energy has become an important part of our daily life and can be easily transmitted and
received at reasonable cost and at high efficiency. Every electric or electronic device installed requires a steady supply of clean power for proper functioning. Power systems usually face various network contingencies. It is necessary to study the effect of contingencies on the system to provide suitable security and ensure improvement in system stability limit. An approach for optimized reactive power dispatch is proposed based on fuzzy expert iteration. The ability of Modal analysis is effectively used in the identification of weak bus to place Static VAr Compensators as a part of reactive power planning. A model to improve the stability margin of a system using Relative Electrical Distance (RED) is also presented. The results for a 25 bus system based on Modal analysis and comparison with other methods are discussed.
KEYWORDS: Fuzzy, Ranking, Modal Analysis, Reactive power, Schedule Power.
I. INTRODUCTION
In both developed and developing countries power is generated by integrated investor owned utilities. The interconnected transmission systems of electric utilities form a large power grid divided into multiple pools, each consisting of several closely located utilities operating in tandem to schedule generation of bulk power cost effectively. Latest technology has laid emphasis on the quality of AC power driving various electronic sub-systems, an integral part of a wide variety of cluster products.Based on one nation one grid policy of India the five region wise grids are interconnected to share the load based on the demand.
For the utilities having a share from the central generating stations located in the neighbouring systems a proper import/export over the interconnected tie-lines needs to be arrived at the planning stage as it is difficult to match the corresponding reactive flows as envisaged, visualised only after preliminary studies. This aspect is important in reactive power planning and it is essential to represent the neighbouring systems up to transmission level.
Electric power systems routinely experience abnormalities due to various contingency events. Over loading of network branches pose problem during line outage contingency. The bus voltages of the system reach unsatisfactory levels leading to voltage collapse. A proper security needs to be provided to overcome voltage collapse. It is also necessary to compute the effect of contingencies on voltage stability. This necessitates an implementable algorithm to compute the contingency ranking based on their severity level. Currently the contingency analysis draws considerable attention with respect to power system planning and operation. Evaluation of contingency ranking is one of the important criteria for online security assessment.
ISSN(Online): 2319-8753 ISSN (Print): 2347-6710
I
nternational
J
ournal of
I
nnovative
R
esearch in
S
cience,
E
ngineering and
T
echnology
(A High Impact Factor, Monthly, Peer Reviewed Journal)
Visit: www.ijirset.com
Vol. 6, Issue 10, October 2017
interconnected grids [2] consider an integrated operation based on both technical and more importantly on economic viability.
II. POWER FLOW ANALYSIS
The Newton-Raphson method of power flow is adopted. Let 1, 2,…..,n indicate the total number of buses of the system, 1, 2,…..,g, indicate the number of generator buses and the remaining buses (n-g) represent the load buses . Real power generation at a given bus:
= − (2.1)
≥
Where
, , are active power generation, schedule and load powers respectively at bus ‘1’ in p.u.
Bus ‘1’ is assumed to be the reference for initial calculation of voltage, magnitude and phase angles of other buses. Linearized equations for real power with Newton-Raphson iteration can be written as:
[∆ ] = [ ][∆ ] (2.2)
[∆ ] = [ ][∆ ], (2.3)
Where = , i=1,2,…,n; j=1,2,…,n
= ,i=1, 2,….,n; j=1,2,…,n
∆ = −
∆ = −
= +∆
= +∆ ⎭⎪ ⎬ ⎪ ⎫
(2.4)
and ‘k’ is the iteration within the power flow solution.
The Jacobian matrix
J1 and
J2 elements are evaluated by differentiating real and reactive power with respect tovoltage and angle while
and
V
are solved by iterative process.III. VOLTAGE STABILITY L-INDEX
The authors Kessel and Glavitsch [KG86] have proposed L-index as an indicator to decide the stability of the system. The author has expressed that numerical value of L-index lies within a unity circle, ranging from ‘0’ at no load to ‘1’ implying static voltage stability limit. It is calculated for every load bus with maximum value of L-index considered as the weakest and close to voltage collapse. The stability margin is the distance of maximum L-index from the unit value, i.e. (1-L). This method though simple in numerical calculation yet explicitly expresses the desired information.
Consider a power system having n, g and s indicating number of buses, generator buses and number of Switchable VAr Compensators (SVC) buses respectively.
Also 1, 2………….t, the number of OLTC transformers.
For the given system operating condition, the voltage stability L-index [3] is computed using the equation:
= − ∑ (3.1)
Where j=g+1,g+2….n,.
The terms within the sigma on the right hand side are complex quantities.
The term
F
jiis taken from the Y-bus matrix formulated for load flow studies.
ISSN(Online): 2319-8753 ISSN (Print): 2347-6710
I
nternational
J
ournal of
I
nnovative
R
esearch in
S
cience,
E
ngineering and
T
echnology
(A High Impact Factor, Monthly, Peer Reviewed Journal)
Visit: www.ijirset.com
Vol. 6, Issue 10, October 2017
= (3.2)
Where [ ], [ ]is the complex current,
[ ]and[ ] are the voltage vectors of generator and load busesand[ ],[ ],[ ] and [ ] represent the
sub-matrices of the Y-bus matrix of the network. Also,
[ ] = [ ][ ] + [ ][ ] [ ] = [ ][ ] + [ ][ ]
Rearranging the above equations:
= (3.3)
Where [ ] =−[ ] [ ]
The L index equation for the jth node can be written as
F
ji, complex elements of [ ]matrix.There are two conditions to be fulfilled:
(i) The index ‘ ’should not exceed the maximum point limit of ‘1’ at any load bus ‘j’.
(ii) The voltage stability indicator takes a value of L= max ( ) for all load buses. L-index value close to ‘0’ indicates a system with improved stability and ‘1’ indicates the weakest bus, vulnerable to voltage collapse. When the above two conditions are met the limit of stability is reached.
IV. CONTINGENCY RANKING USING FUZZIFICATION FOR DIFFERENT KEY VARIABLES
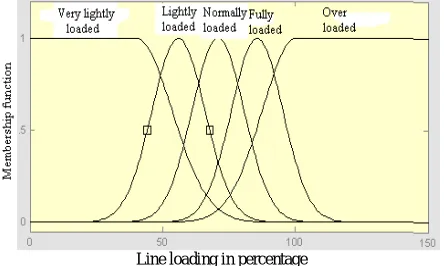
In the conventional optimal method due to constraints being modelled rigidly, the solution obtained being incapable of representing the practical cases, necessitates an alternate approach with reasonable flexibility in modelling [4]. Normally membership functions represent the degree of input and output linguistic variables lying between 0 and 1. Fuzzy rules are IF-THEN statements used to formulate the conditional statements. The ‘IF’ part generally consists of more than one condition and can be combined together using logic operators. The ‘THEN’ part being the conclusion may contain more than one output. The key variables considered are the real power line loading, voltage magnitude of the load bus and voltage stability L-index. Each of these variables are categorized into five linguistic values and later transformed to fuzzy domain. The key variables assumed are transformed into membership degree by using the following membership function:
= (4.1)
‘k’ is the assumed variable, ‘a’ and ‘A’ are membership constants. Figures 4.1, 4.2 and 4.3 represent the membership functions for the variables considered.
ISSN(Online): 2319-8753 ISSN (Print): 2347-6710
I
nternational
J
ournal of
I
nnovative
R
esearch in
S
cience,
E
ngineering and
T
echnology
(A High Impact Factor, Monthly, Peer Reviewed Journal)
Visit: www.ijirset.com
Vol. 6, Issue 10, October 2017
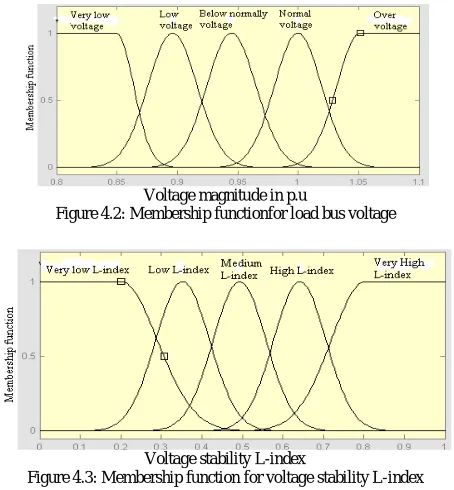
Voltage magnitude in p.u
Figure 4.2: Membership functionfor load bus voltage
Voltage stability L-index
Figure 4.3: Membership function for voltage stability L-index
A.IV FUZZIFICATION OF INPUT AND OUTPUT VARIABLES
The state of a system is described by fuzzified key variables like, line loading, voltage profile and voltage stability L-index and for each, five linguistic values are assumed. Output variables are also fuzzified and five linguistic values are assumed. The fuzzy rule statement is given as ‘If X is A Then Y is B’ is applied to fuzzified variables and the corresponding fuzzy outputs in terms of linguistic values are shown in Table 4.1 respectively.
Table 4.1: Fuzzy rules for variables
Sl.
No Input key variable
Output linguistic values(Severity indices)
1
VLL, LL, NL, FL, OL Very low, Lightly, Normal, Fully and Over loaded.
VLS, LS, BS, AS, MS Very less, Less, Below, Above and More severe.
2
VLV, LV, BNV, NV, OV
Very low, Low, Below normal, Normal voltage and Over voltage.
MS2, AS, BS, LS, MS1 Very less, Above, Below Low and More severe.
3
VLI, LI, MI, HI, VHI Very low, Low, Medium, High and Very high L-index.
ISSN(Online): 2319-8753 ISSN (Print): 2347-6710
I
nternational
J
ournal of
I
nnovative
R
esearch in
S
cience,
E
ngineering and
T
echnology
(A High Impact Factor, Monthly, Peer Reviewed Journal)
Visit: www.ijirset.com
Vol. 6, Issue 10, October 2017
B.IV OVERALL SEVERITY INDICES (OSI) OF KEY VARIABLES
The post contingency of the line outage is obtained by rule-firing and the overall severity index of line loading is estimated by summing up all the severity indices. Assuming a suitable weightage factor the overall severity index is estimated using equation 4.1.
The membership function for post contingency variables of line loading, bus voltage magnitude and voltage stability L-index are used to calculate the network ranking and the overall severity L-index for a line contingency, is shown in Figure 4.4.
Figure.4.4 Composite criteria to determine overall network ranking
For a given contingency, the post contingency quantities such as line loading, voltage profile and voltage stability indices are combined together to obtain Fuzzy Inference System (FIS). The fuzzy inference is evaluated for each of the key variables using the fuzzy rules. Network Overall Severity Index (NOSI), the contingency ranking is the sum of
overall severity index of line loading( ), voltage profile ( ) and voltage stability indices ( )as given
in equation 4.2.OverallSeverity Indices of the line voltage is shown in Table 4.2.
=∑( + + ) (4.2)
Table 4.2: Overall severity indices of key variables
Sl. No
Key variables
Overall Severity Indices
of Key variables , transmittance coefficient
1 Line
loading
= ∑
SILL = Severity Index of Line
Loading, ‘nl’ is the no. of transmission lines
= 0.20 for VLS; 0.40 for LS; 0.50 for BS; 0.75 for AS; 1.00 for MS.
2 Voltage
profile
= ∑
SIVP =Severity Index of voltage
profile.
= 0.20 for MS2; 0.40 for AS; 0.60 for BS; 0.80 for AS; 1.0 for MS1.
3
Voltage stability L-index
= ∑
SIVSI = Severity Index of voltage
profile, ‘n’ is the total number of buses and ‘j’ is the load bus
ISSN(Online): 2319-8753 ISSN (Print): 2347-6710
I
nternational
J
ournal of
I
nnovative
R
esearch in
S
cience,
E
ngineering and
T
echnology
(A High Impact Factor, Monthly, Peer Reviewed Journal)
Visit: www.ijirset.com
Vol. 6, Issue 10, October 2017
V. ANALYSIS OF THE TEST SYSTEM
The proposed method based on fuzzy expert to determine contingency line outage ranking has been tested on a 25 bus practical Indian power system.
It has 4 generator buses (1-4) and 21 (5-21) load buses. The load is represented on the 220 kV side of 400kV/220kV
system. The single line diagram, line data and bus data details are given in Appendix.
The system has been tested for line contingency and the computed severity indices of voltage profiles, voltage stability L-index and line loading are indicated in Table 5.1. Line outage contingencies are performed for all the lines of the system. For simplicity only 8 major line outages and the corresponding performance parameters are listed in Table 5.2. The overall ranking is the sum of all severity indices computed from the individual severity index. It is observed that severity indices are close to each other, indicating that severity of each variable is effectively the same on the system.
Line outage L24-18 exhibits individual severity indices due to voltage profile, voltage stability L-index and line loading
as 16.52, 13.24 and 15.95 respectively. The overall severity index value for line L24-18is69.54, considered as rank 1,
implies that, if this line outage occurs the system experiences violation of stability limits and it may reach state ‘in
extremis’.Similarly for the line outage L22-23 the overall severity index value is 65.08, considered as rank 2.For each line
outage the order of severity is shown in Table 5.1.The variations of performance parameters with respect to every line outage are shown in Figure 5.2.
Table 5.1. 25 Bus EHV System severity indices and network overall ranking
Table 5.2. 25 Bus EHV System voltage magnitude, voltage stability index,MSV and transmission losses at each line outage
ISSN(Online): 2319-8753 ISSN (Print): 2347-6710
I
nternational
J
ournal of
I
nnovative
R
esearch in
S
cience,
E
ngineering and
T
echnology
(A High Impact Factor, Monthly, Peer Reviewed Journal)
Visit: www.ijirset.com
Vol. 6, Issue 10, October 2017
Figure 5.1. Variation of stability indices for each line outage
At any operating condition the system is voltage stable if there is an increase in voltage magnitude with increase in reactive power injection at the same bus and voltage unstable if there is a decrease in voltage magnitude with increase in reactive power injection at the same bus. The steady state linearized power system voltage equation may be expressed in the following form:
V
J
J
J
J
Q
P
QV Q PV P
(5.1) Where P ,
Q
,
and
V
indicate change in bus real power, reactive power injection, voltage angle and voltagemagnitude respectively. The elements of the Jacobian matrix indicate the change in real and reactive power with respect to changes in bus angle and bus voltage. Voltage stability is affected by both real and reactive power at each operating point P and may be kept constant with voltage stability being evaluated by considering incremental change between Q and V. This gives the relation between the variation of Q and change in V and may be represented as Q-V curves [5]. The incremental change in reactive power and corresponding changes in voltage magnitude i.e. Q and V relationship is established considering different operating conditions.
Let P=0;
V
J
J
P
PV
.
.
0
(5.2)V
J
J
P PV
1.
(5.3)Q
J
Q.
J
QV.
V
(5.4)
J
J
J
J
V
Q
QV
Q P PV
1 (5.5)V
J
Q
R
.
(5.6)Where
QV Q P PV
R
J
J
J
J
J
1
J
Q
V
R
1.
(5.7)Where
R
J
- reduced Jacobian matrix. This matrix relates the change in voltage magnitude with no change in reactive power.1
R
J
- Inverse reduced Jacobian matrix.The V-Q sensitivity is computed by solving the equation,
Q
J
R.
V
.1 2 3 4 5 6 7 8
0.2 0.3 0.4 0.5 0.6 0.7 0.8 0.9 1
Line outage number
m a g n it u d e o f V m in , L m in , M S V p u
Min voltage magnitude at every line outage Max value of L-index
ISSN(Online): 2319-8753 ISSN (Print): 2347-6710
I
nternational
J
ournal of
I
nnovative
R
esearch in
S
cience,
E
ngineering and
T
echnology
(A High Impact Factor, Monthly, Peer Reviewed Journal)
Visit: www.ijirset.com
Vol. 6, Issue 10, October 2017
Voltage stability of the system is analyzed by computing Eigen values and Eigen vectors from reduced Jacobian matrix
R
J
.Let the reduced Jacobian matrix be split into three matrices as:
R
J
(5.8)Where
,
,indicates right, left and diagonal Eigen vector matrices ofJ
R respectively.A.V. BUS PARTICIPATION FACTOR
The product of left and right Eigen vectors relates the participation of bus ‘k’ in mode ‘i’ and is given by:
= (5.9)
Where
- Participation factor at bus ‘k’ at mode i.
is the right Eigen vector of bus ‘k’ and different ‘i' modes of reduced Jacobian matrix.
is the left Eigen vector of bus ‘i’ and different ’k’ modes of reduced Jacobian matrix. " ", determines the areas
associated with each mode. The sum of all bus participation factors for each mode is equal to unity of normalized right and left eigenvectors. The size of the bus participation in a given mode indicates the vulnerability for voltage instability at that bus.
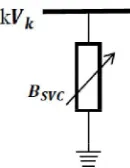
B.V. ESTIMATION OF REACTIVE POWER INJECTION (BSVC)
Normally the SVC can be viewed as a variable reactance with specified limits [1]. Figure 6.1indicates variable susceptance connected to inject the reactive power at bus ‘k’.
Figure 5.2.Variable shunt susceptance for injecting reactive power
The current injected into bus through SVC is:
= (5.10)
Reactive power injected into bus ‘k’ is given as:
= =− ∗ (5.11)
The variable shunt susceptance is updated according to the following equation:
= ( )+ ∆
( )
∗ ( ) (5.12)
The new value indicates the total susceptance required to maintain the desired voltage magnitude.
VI. RESULT ANALYSIS
ISSN(Online): 2319-8753 ISSN (Print): 2347-6710
I
nternational
J
ournal of
I
nnovative
R
esearch in
S
cience,
E
ngineering and
T
echnology
(A High Impact Factor, Monthly, Peer Reviewed Journal)
Visit: www.ijirset.com
Vol. 6, Issue 10, October 2017
of required value of reactive power at the weak bus will improve the stability of the system, measured in terms of the performance parameters as discussed earlier.
The Eigen values obtained for reduced Jacobian matrix is shown in Table 6.1. It is to be noted that all the Eigen values are positive, indicating that the system is voltage stable. The most vulnerable load bus for voltage collapse is estimated from participation factor corresponding to least Eigen value load bus. The bus with highest value of participation factor is considered as the most critical bus vulnerable to voltage collapse and is found suitable for placing SVC. In this case,
the least Eigen value is λ =2.2845 and the corresponding participation factors are computed using equation (6.8). The
maximum bus participation factor is 0.1169 occurring at bus 8. Hence bus-8 has the highest contribution to voltage collapse and is assigned rank 1, and also an ideal location for placing SVC. Ranking order based on bus participation factor for all buses is shown in Table 6.2.
Table 6.1 Eigen values of reduced Jacobian matrix
load bus
number bus
participation factor
critical bus index ranking
5 0.0062 19
6 0.0594 7
7 0.0469 11
8 0.1169 1
9 0.0480 10
10 0.0662 5
11 0.0332 15
12 0.0558 8
13 0.1044 3
ISSN(Online): 2319-8753 ISSN (Print): 2347-6710
I
nternational
J
ournal of
I
nnovative
R
esearch in
S
cience,
E
ngineering and
T
echnology
(A High Impact Factor, Monthly, Peer Reviewed Journal)
Visit: www.ijirset.com
Vol. 6, Issue 10, October 2017
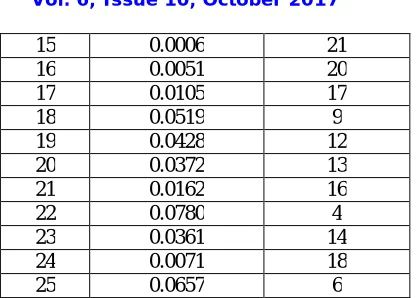
Table 6.2. Participation factors and critical bus indices
for the least Eigen value (λ = 2.2845)
An optimal value of static VAr compensator is computed using equation (6.11). Before placing SVC at bus 8, the
minimum voltage Vmin= 0.8576 occurs at bus 13 and after placing SVC at bus 8, Vmin= 0.9182 occurs at bus 7. The
MSV after placing SVC at bus 8 has improved from 0.7573 to 0.8554 and maximum value of voltage stability index
Lmax from 0.5251 to 0.4368. Similar analysis has been made when SVC is placed at two different weak buses i.e rank 1
and rank 2 buses. After placing an optimized SVC value at these two weak buses, Vmin = 0.9524 at bus 5. The MSV
improved from 0.7573 to 0.8896 and L-index from 0.5251 to 0.4095, as shown in Table 6.3. The variation of voltage magnitude at load buses after placing SVC at critical bus 8 is shown in Figure 6.1.
15 0.0006 21
16 0.0051 20
17 0.0105 17
18 0.0519 9
19 0.0428 12
20 0.0372 13
21 0.0162 16
22 0.0780 4
23 0.0361 14
24 0.0071 18
25 0.0657 6
voltage profile
base case load flow results (p.u)
VAr injected at
bus-8
VAr injected at Buses 8 & 14
V5 0.9227 0.9448 0.9524
V6 0.8793 0.9500 1.0473
V7 0.8624 0.9182 0.9609
V8 0.8615 1.0617 1.0618
V9 0.9121 0.9775 1.0049
V10 0.9159 0.9944 1.0188
V11 0.9761 1.0514 1.0653
V12 0.9631 1.0674 1.0856
V13 0.8576 1.0162 1.0371
V14 0.8907 1.0678 1.0959
V15 0.9714 0.9791 0.9818
V16 0.9469 0.9681 0.9755
V17 0.9908 1.0302 1.0387
ISSN(Online): 2319-8753 ISSN (Print): 2347-6710
I
nternational
J
ournal of
I
nnovative
R
esearch in
S
cience,
E
ngineering and
T
echnology
(A High Impact Factor, Monthly, Peer Reviewed Journal)
Visit: www.ijirset.com
Vol. 6, Issue 10, October 2017
Table 6.3: Results showing SVC Placement at bus 8 and buses 8 & 14
Figure 6.1 Voltage magnitudes before and after placing SVC
VII. REACTIVE POWER DISPATCH USING FUZZY APPROACH UNDER NORMAL CONDITION
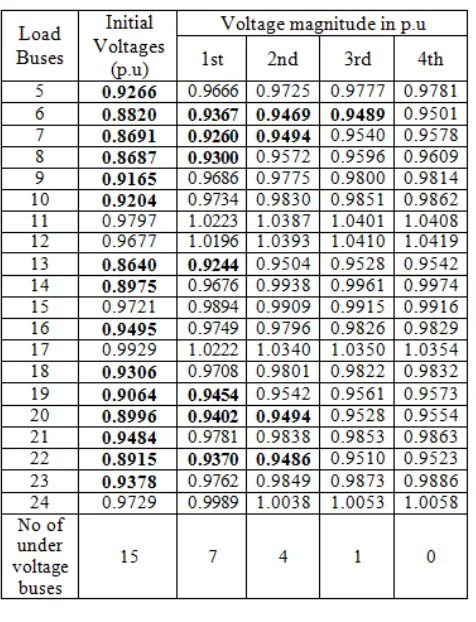
The basic load flow result shows that 15 load buses are under voltage and Vmin=0.8640. The performance parameter
values are Lmax=0.5199, MSV=0.7481, and Ploss=61.0149 MW. The reactive power is controlled by changing the
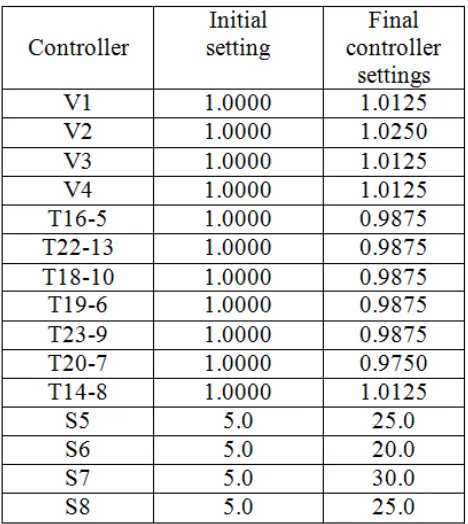
position of control variables based on fuzzy inference. Load flow results shows that at every iteration there is an improvement in voltage profile as shown in Table 7.1. The control variables like generator excitation, transformer
settings and switchable VAr compensators are operated as per the fuzzy output
:
the settings of control variables. At theend of 4th iteration, no bus experiences under voltage and the corresponding values are tabulated.
All controlling devices are operated based on the fuzzy [6] inference and final settings of the same are shown in Table 7.2. The voltage variation at each iteration with respect to the operation of controlling devices is shown in Table 7.3. The variation in voltage magnitude at every iteration at each load buses is shown in Figure 7.1.
0 1 2 3 4 5 6 7 8 9 10 11 12 13 14 15 16 17 18 19 20 21 22 23 24 25 0.75 0.8 0.85 0.9 0.95 1 1.05 1.1
Number of Buses
V o lt a g e M a g n it u d e i n p u
Base case Voltage Magnitude Voltage Magnitude after placing SVC at Bus 8 Voltage Magnitude after plcing SVC at Buses 8 & 14
V19 0.9030 0.9713 1.0660
V20 0.8943 0.9479 0.9891
V21 0.9458 0.9858 1.0344
V22 0.8859 1.0061 1.0427
V23 0.9335 0.9973 1.0242
V24 0.9708 0.9989 1.0087
V25 0.8751 0.9462 1.0441
PLoss,
MW 61.8551 57.5156 55.5067
number of under voltages
16 4 Nil
ISSN(Online): 2319-8753 ISSN (Print): 2347-6710
I
nternational
J
ournal of
I
nnovative
R
esearch in
S
cience,
E
ngineering and
T
echnology
(A High Impact Factor, Monthly, Peer Reviewed Journal)
Visit: www.ijirset.com
Vol. 6, Issue 10, October 2017
Table 7.1: Improvement in voltage profile and Stability parameters at each iteration
ISSN(Online): 2319-8753 ISSN (Print): 2347-6710
I
nternational
J
ournal of
I
nnovative
R
esearch in
S
cience,
E
ngineering and
T
echnology
(A High Impact Factor, Monthly, Peer Reviewed Journal)
Visit: www.ijirset.com
Vol. 6, Issue 10, October 2017
Table 7.3: Voltage Improvement at every iteration
Figure 7.1 Voltage magnitude variations at every iteration at each load buses
VIII. REAL POWER SCHEDULING TO IMPROVE POWER SYSTEM STABILITY MARGIN –UNDER NORMAL CONDITIONS
Whenever a critical fault occurs, proper control should be exercised to arrest the system deterioration. With the liberalization of electricity market, sharing of transmission network to meet various load demands and losses are common. In this section the approach RED [8] is used to compute real power generation schedule to meet the load
0 5 6 7 8 9 10 11 12 13 14 15 16 17 18 19 20 21 22 23 24 25 0.8
0.85 0.9 0.95 1 1.05
Load Bus Number
V
o
la
tg
e
m
a
g
n
it
u
d
e
i
n
p
.u
ISSN(Online): 2319-8753 ISSN (Print): 2347-6710
I
nternational
J
ournal of
I
nnovative
R
esearch in
S
cience,
E
ngineering and
T
echnology
(A High Impact Factor, Monthly, Peer Reviewed Journal)
Visit: www.ijirset.com
Vol. 6, Issue 10, October 2017
demand. An economical power transmitting contract agreement can be entered into by transferring power with the cheapest generator. However, in view of generation-load location and transmission systems, this may not always be the desired contract, as the selection based only on commercial terms may sometimes lead to transmission congestion. The most economical way to select a generator schedule in Mega-Watt (MW) is presented while ensuring contracts resulting in minimal loss. The RED approach relates the distances between the generator and load buses. With this information, the Desired Generation Schedule (DGS) [9] can be arrived at, with real power flows being traced for the load of each generator and also sharing of the losses. The power contracts formed based on DGS will ensure voltage stability and also result in minimization of transmission losses.
A.VIII RESCHEDULING REAL GENERATION UNDER NORMAL CONDITIONS
Base load flow is performed and from the admittance matrix, [FLG] is computed. The FLG in complex form calculated
for the 25 bus system is shown in Table 8.1.All the elements of the [FLG] matrix are complex ([10]-[12]) quantities and
the sum of real part of each row is close to 1.0. The real part of each row is used to compute the desired load shared by each generator. Thus the matrix emphasizes the relative contribution to reschedule the generation to meet the load on
the network. The real part of [ ] is denoted as [ ] matrix.
Table 8.1 FLG of system under normal conditions
The [DLG] matrix shown in Table 8.2 is the relative proportion of generation contribution to load buses. For example,
ISSN(Online): 2319-8753 ISSN (Print): 2347-6710
I
nternational
J
ournal of
I
nnovative
R
esearch in
S
cience,
E
ngineering and
T
echnology
(A High Impact Factor, Monthly, Peer Reviewed Journal)
Visit: www.ijirset.com
Vol. 6, Issue 10, October 2017
Table 8.2 [DLG] under normal conditions
The actual real power contribution from each generator is obtained by multiplying the load demand at each bus to
entries of [DLG] matrix by using equation 8.1. The new real power generation schedule is obtained by summing up all
column entries of the matrix and the computed values are shown in Table 8.3. The Real Power Generation Schedule (RGS) for each generator can be obtained from equations (8.1) and (8.2).
[ ] = ∗ (8.1)
is the generation contribution to each load buses and is the actual real power demand at each load bus.
The new real power generation schedule is estimated by:
[ ] =∑ (8.2)
ISSN(Online): 2319-8753 ISSN (Print): 2347-6710
I
nternational
J
ournal of
I
nnovative
R
esearch in
S
cience,
E
ngineering and
T
echnology
(A High Impact Factor, Monthly, Peer Reviewed Journal)
Visit: www.ijirset.com
Vol. 6, Issue 10, October 2017
Table 8.3 RPG values without considering losses of the system
B.VIII OVERALL SYSTEM PERFORMANCE PARAMETERS
Initially generators are scheduled for G1=1820 MW,G2=160 MW,G3=350 MW and G4=520 MW and after load flow:
G1=1698, G2=160 MW, G3=350 MW and G4=520 MW and total generation is 2728 MW. Each generator is
rescheduled to new real power generation, and load power contributed by each generator obtained by summation is:
G1=1181MW, G2=252 MW, G3=614 MW and G4=793 MW as shown in Table 8.3. Again load flow is performed and
new real power generation of each generator is, G1=1052.14, G2=252.21, G3=613.78 and G4=793.16 respectively as
shown in Table 8.4. Now, total generation is 2711.30 MW. The difference of generation with and without RPG is equal to 16.7 MW. The effect of new real power generation schedule indicates considerable improvement in the stability
parameters like MSV, Ploss, Vmin, Lmax, ∑ and∑ as shown in Table 8.4.
Table 8.4 Overall system performance parameters under normal operation without transmission losses.
C.VIII EVALUATION OF RPG CONSIDERING TRANSMISSION LOSSES
The earlier RPG value calculated was merely based on Relative Electrical Distance [RED] without considering the transmission losses. Now, using equation 8.1, the real power generation rescheduling is done based on relative electrical distance considering transmission losses as shown in Table 8.5.The new real power generation schedule
ISSN(Online): 2319-8753 ISSN (Print): 2347-6710
I
nternational
J
ournal of
I
nnovative
R
esearch in
S
cience,
E
ngineering and
T
echnology
(A High Impact Factor, Monthly, Peer Reviewed Journal)
Visit: www.ijirset.com
Vol. 6, Issue 10, October 2017
stability L-index after load flow is shown in Table 8.6.The voltage magnitude appreciably improved in all the buses and
so also the performance parameters: Vmin= 0.8428 to 0.8581,Lmax= 0.5513 to 0.5354 and Ploss= 67.9264 to
51.1503.After setting new generation schedule, load flow is performed and as a result the real power generation are
G1=1100.24 MW, G2=242.1 MW, G3=596.55 MW, G4=772.26 MW and total real power generation of 2711MW as
shown in Table 8.7.
Table 8.5: L-Index and bus voltage with and without RPG considering transmission losses
ISSN(Online): 2319-8753 ISSN (Print): 2347-6710
I
nternational
J
ournal of
I
nnovative
R
esearch in
S
cience,
E
ngineering and
T
echnology
(A High Impact Factor, Monthly, Peer Reviewed Journal)
Visit: www.ijirset.com
Vol. 6, Issue 10, October 2017
D.VIII OVERALL SYSTEM PERFORMANCE PARAMETERS CONSIDERING TRANSMISSION LOSSES
Overall system performance parameters, obtained for new real power scheduling considering transmission losses are also shown in Table 8.7.
Table 8.7: Overall system performance parameters with transmission losses
It can be observed that there is not much variation in performance parameters after considering the transmission losses. A graph of voltage magnitude versus load bus number is plotted as shown in Figure 8.1.
Figure 8.1 Voltage profile and its variation with and without RPG
IX. CONCLUSION
Network ranking using fuzzy approach under contingency of line outages is obtained. Modal analysis is applied for determining weak buses of the system for effective placement of SVC based on the least Eigen values and bus participation factors. The results obtained are compared with other methods like reactive power optimization by operating controlling devices like SVC, excitation voltage of generators and transformer tapping based on voltage deviations, voltage stability L-indices of load buses, Minimum Singular Value (MSV) and real power rescheduling based on Relative Electrical Distance (RED).In RED approach the Required Power Generation Schedule (RPGS) meets the load demand and also results in reduction of transmission losses. Results obtained for a 25 buspower system network shows that the proposed method reduces system power losses as well as improves the performance parameters.
5 6 7 8 9 10 11 12 13 14 15 16 17 18 19 20 21 22 23 24 25 0.8
0.85 0.9 0.95 1
Load Bus Number
V
o
lt
a
g
e
(p
.u
)
ISSN(Online): 2319-8753 ISSN (Print): 2347-6710
I
nternational
J
ournal of
I
nnovative
R
esearch in
S
cience,
E
ngineering and
T
echnology
(A High Impact Factor, Monthly, Peer Reviewed Journal)
Visit: www.ijirset.com
Vol. 6, Issue 10, October 2017
REFERENCES
[1] P.R. Bijwe, D.P. Kothari, and L.D. Arya, “Alleviation of line overloads and voltage violations by corrective rescheduling”, IEE Proceedings-C, Vol. 140, No. 4, July 1993, pp.249-255.
[2] Begovic, M, and A.G. Phadke, “Control of Voltage Stability Using Sensitivity Analysis”, IEEE Trans. on power systems, Vol.7, No.1, 1992, pp.114-123. [3] Bansilal, D. Thukaram, K. Parthasarathy, “Optimal reactive power dispatch algorithm for voltage stability improvement,” Int. Journal of Electrical Power and
Energy Systems 18 (7) (1996) 461-468.
[4] Bansilal, Thukaram D., Parthasarathy K., “An expert system for alleviation of network overloads,” Electric Power Systems Research 40 (1997) 143–153. [5] B. Marques and Taranto, “A Knowledge - based system for supervision and control of regional voltage profile and security,” IEEE Tr. On Power Systems,
Vol.20, No.4, February.2005, pp 400-407.
[6] Aydogan Ozdemir and Chanan Singh, “Fuzzy Logic Based Mw Contingency Ranking against Masking Problem”, Power Engineering Society Winter Meeting, IEEE, Vol.2, 28 Jan - 1 Feb. 2001, pp.504-509.
[7] Gao, B, G. K. Morison, and P. Kundur, “Voltage stability evaluation using modal analysis”, IEEE Transactions on Power Systems, Vol.7, No.4, November 1992, pp.1529-1542.
[8] P.A. Lof, G. Andersson, D. Hill, “ Voltage dependent reactive power limits for voltage stability studies”, IEEE Trans. on power systems, Vol. 10, No. 1, Feb. 1995, pp. 220-228.
[9] Mansour, Y, W. Xu, F. Alvarado and C. Rinzin, “SVC Placement Using Critical Nodes of Voltage Instability”, IEEE Trans. on Power Systems, Vol.9, No.2, May 1994, pp.757-763.
[10] T. K. P. Medicherla, R. Billinton, and M. S. Sachadev, “Generation rescheduling and load shedding to alleviate line over loads-analysis”, IEEE Trans. on PAS, Vol.98, No.12, 1979, pp .1876-1884.
[11] Medicherla TKP, Billington R, and Sachadev MS. “Generation rescheduling and load shedding to alleviate line overloads - system studies”, IEEE Trans. PAS 100 (1) (1981); 36-42.
[12] Conejo A.J, Milano F, Garacia Bertrand R,“ Congestion management ensuring voltage stability ”, IEEE Transaction Power system, Vol.21, No.1, Feb. 2006,pp.357-364
APPENDIX
Single line diagram of 25 bus Indian equivalent system
Table : 25-Bus EHV System (Actual data) Number of generators
Number of transformers Number of transmission lines Number of loads
Number of shunt compensators Number of reactors
P-load (peak, MW) Q-load (peak, MVAR)