N Vetrivelan, Dr. A V Reddy
Abstract—An ad hoc network is a collection of wireless mobile
nodes, frequently forming a network topology without the use of any existing network infrastructure or centralized administration. we compare the performance of the three prominent routing protocols for mobile ad hoc networks, Ad hoc On Demand Distance Vector (AODV), Destination Sequenced Distance Vector(DSDV) and Temporally Ordered Routing Protocols (TORA). We have chosen four performance metrics, such as Average Delay, Packet Delivery Fraction, Routing Load and Varying MANET Size, simulation for the popular routing protocols AODV, DSDV and TORA. The simulations are carried out on NS-2. The performance differentials are analyzed using varying network size and simulation times. The simulation results confirm that AODV performs well in terms of Average Delay, Packet Delivery Fraction. As far as Routing Load concerns TORA performs well.
Index Terms—Ad hoc Networks, Average Delay, Performance
Analysis, Routing Protocols, Simulation.
I. INTRODUCTION
A Mobile Ad hoc Networks represents a system of wireless mobile nodes that can freely and dynamically self-organize in to arbitrary and temporary network topologies, allowing people and devices to seamlessly communicate without any pre-existing communication architecture. Each node in the network also acts as a router, forwarding data packets for other nodes. A central challenge in the design of ad hoc networks is the development of dynamic routing protocols that can efficiently find routes between two communicating nodes. An Ad hoc routing protocol is a convention or standard that controls how nodes come to agree which way to route packets between computing devices in a mobile ad hoc network (MANET). Our goal is to carry out a systematic performance study of three routing protocol for ad hoc networks Ad hoc On Demand Distance Vector (AODV), Destination Sequenced Distance Vector (DSDV), and Temporally Ordered Routing Algorithm (TORA).
Manuscript received October 9, 2007.
N Vetrivelan, Research Scholar, Department of Computer Applications, National Institute of Technology, Tiruchirappalli, 620015, India (phone: +91-4362-264600; fax: +91-4362-264660; e-mail: caz0307@ nitt.edu).
Dr. A V Reddy, Assistant Professor, Department of Computer Applications, National Institute of Technology, Tiruchirappalli, 620015, India (phone: +91-431-2500281; fax: +91-431-2500133; e-mail: reddy@ nitt.edu).
Brief description of related works is presented in Section 2 the Protocol Description is described in Section 3. In Section 4 the simulation Model and Parameter Metrics are explained. In Section 5 the information about the graphs are discussed. The conclusion is presented in Section 6.
II. RELATED WORK
Johansson et al. [4] defined a new mobility metric, which measures mobility in terms of relative speeds of the nodes rather than absolute speeds and pause times. This metric is intended to capture and quantify the kind of node motion relevant for an ad hoc routing protocol. Throughput, Delay and routing load were examined for 50-node network for three routing protocols namely AODV, DSDV and DSR. They used ns-2 based simulation environment. Their findings reveal that DSR was more effective at low load while AODV was more effective at higher loads. They kept small packet size (64bytes).
Broch et al. [1] performed experiments for performance comparison of both proactive and reactive routing protocols (AODV, DSR, DSDV and TORA). In their simulation, a network size of 50 nodes, 10 to 30 traffic sources, seven different pause times and various movement patterns were chosen. They used ns-2 discrete event simulator. Through simulation, they reached the conclusion that performance of DSR was good at all mobility rates and speeds. AODV produces more routing overhead than DSR at high rates of node mobility.
Das et al. [2] presented a detailed performance comparison of two on demand routing protocols namely, AODV and DSR. They carried out simulation using the ns-2 simulator. This simulator supports an IEEE 802.11 MAC layer, a radio model similar to Lucent’s Wave LAN radio interface and a random waypoint mobility model in which pause time was varied from 0 to 900 seconds. Two different scenarios were considered. Different performance metrics were computed for both the protocol.
Jorg [8] studied the behavior of different routing protocols on network topology changes resulting from link breaks, node movement, etc. In his paper performance of routing protocols was evaluated by varying network sizes, number of nodes etc. But he did not investigate the performance of protocols under heavy loads (high mobility +large number of traffic sources + larger number of nodes in the network), which may lead to congestion situations. In his simulation, packets of small sizes and one source node were only considered.
III. PROTOCOL DESCRIPTIONS
3.1. Routing protocols for ad-hoc networks
The routing protocols are proactive in that they maintain routes to all nodes, including nodes to which no packets are sent. They react to topology changes, even if no traffic is affected by the change. They are based on either link-state or distance vector principles [6] and require periodic control messages to maintain routes to every node in the network. An alternative approach is reactive route establishment, where routes between nodes are determined only when explicitly needed to route packets. Three routing protocols are studied in this work, namely Ad-hoc on Demand Distance Vector (AODV), Destination Sequenced Distance Vector (DSDV), and Temporally Ordered Routing Protocol (TORA).
3.1.1. Ad Hoc on Demand Distance Vector Routing – AODV
The AODV [2] routing protocol shares features of both DSDV [4] and DSR [4] algorithms. AODV shares DSR’s on-demand characteristics in that it also discovers route as and when needed by initiating a route discovery process. It maintains one entry per destination in its routing tables unlike in DSR, which maintains multiple route entries for each destination in its route cache. In AODV, the packets carry the destination address and sequence number. In AODV, when a source requires a path to the destination, a route request (RREQ) message is flooded in the network. When an intermediate node receives such a RREQ, it examines its local route cache to check whether a fresh route to the required destination is available or not. If a fresh route exists, then the node unicasts a route reply (RREP) message immediately back to the source. As an optimization, AODV [2] uses an “expanding ring” flooding technique, where a RREQ is issued with a limited TTL only. If no RREP message is received within a certain time by the source node, then another RREQ is issued with a larger TTL value. If still no reply, the TTL is increased in steps, until a certain maximum value is reached. During route discovery process, all IP-Packets generated by the application for destination are buffered in the source node itself. When a route is established, then the packets are transmitted. An important feature of AODV [2] is the maintenance of timer-based states in each node, regarding utilization of individual routing table entries. A routing table entry is said to be expired if not used within certain duration. These nodes are notified with route error (RERR) packets when the next-hop link breaks. In the situation of link break, each predecessor node, forwards the RERR to its own set of predecessors. In this way all routes, which contain the broken link, are removed.
DSDV [4] is a hop-by-hop distance vector routing protocol. It is proactive; each network node maintains a routing table that contains the next-hop for, and number of hops to, all reachable destinations. Periodical broadcasts of routing updates attempt to keep the routing table completely updated at all times. To guarantee loop-freedom DSDV uses a concept of sequence numbers to indicate the freshness of a route. A route R is considered more favorable than R' if R has a greater sequence number or, if the routes have the same sequence number, R has lower hop-count. The sequence number for a route is set by the destination node and increased by one for every new originating route advertisement. When a node along a path detects a broken route to a destination D, it advertises its route to D with an infinite hop-count and a sequence number increased by one. Route loops can occur when incorrect routing information is present in the network after a change in the network topology, e.g., a broken link. In this context the use of sequence numbers adapts DSDV to a dynamic network topology such as in an ad-hoc network. DSDV uses triggered route updates when the topology changes. The transmission of updates is delayed to introduce a damping effect when the topology is changing rapidly. This gives an additional adaptation of DSDV to ad-hoc networks.
3.1.3. Temporally Ordered Routing Algorithm -TORA
The TORA is a highly adaptive loop-free distributed routing algorithm based on the concept of link reversal . TORA is proposed to operate in a highly dynamic mobile networking environment. It is source-initiated and provides multiple routes for any desired source/destination pair. The key design concept of TORA is the localization of control messages to a very small set of nodes near the occurrence of a topological change. To accomplish this, nodes need to maintain routing information about adjacent (one-hop) nodes. The protocol performs three basic functions of Route creation, Route maintenance, and Route erasure. The first three elements collectively represent the reference level. A new reference level is defined each time a node loses its last downstream link due to a link failure. TORA’s route erasure phase essentially involves flooding a broadcast clear packet(CLR) throughout the network to erase invalid routes.
IV. SIMULATION PARAMETERS
Table 1. Parameter values for Simulation Maximum
Simulation time
100 Seconds
Physical terrain Terrain-Dimensions
800 X 800
Number of nodes 25
Mobility Mobility Random Way Point
4.1. Simulation Model
In this section, The network simulation are implemented using the 2 simulation tool The Network Simulator NS-2[12] is a discrete event simulator, which means it simulates such events as sending, receiving forwarding and dropping packets. For simulation Scenario and network topology creation it uses OTCL (Object Tool Command Language). To create new objects, protocols and routing algorithm or to modify them in NS-2, C++ source code has to be changed. The simulator supports wired and wireless and satellite networks. The simulations were conducted on Celeron processor at speed 1.0 GHz, 256 MB RAM running Linux.
4.2. Performance Metrics
While comparing three protocols, we focused on four performance measurements such as Average Delay, Packet Delivery Fraction, and Routing load and network size.
(i) Packet delivery fraction: The ratio of the number of data packets successfully delivered to the destinations to those generated by CBR sources.
Packet delivery fraction = (Received packets/Sent packets)*100
(ii) Average End to end delay of data packets: The average time from the beginning of a packet transmission at a source node until packet delivery to a destination. This includes delays caused by buffering of data packets during route discovery, queuing at the interface queue, retransmission delays at the MAC, and propagation and transfer times. Calculate the send(S) time (t) and receive (R) time (T) and average it.
(iii) Normalized Routing Load: The number of routing packets transmitted per data packet delivered at the destination. Each hop wise transmission of a routing packet is counted as one transmission. Routing Load = Routing Packets Sent / Received Packets
(iv) Number of Nodes and Simulation Time: The models were generated for 10 nodes and 25 nodes with simulation times of 10, 20,30,40,50 and 100.
V. VARYING NUMBER OF NODES AND SIMULATION TIMES
The first set of experiments uses differing the number of nodes and changing the simulations. For the 10 nodes and 20 nodes experiments, we ran the simulator for 10, 20,30,40,50 and 100 Seconds.
10 Nodes
0 1 2 3 4 5 6 7
10 20 30 40 50 100
Sim ulation Tim e (Secs)
A
verage D
e
la
y
[image:3.612.326.564.53.212.2]AODV DSDV
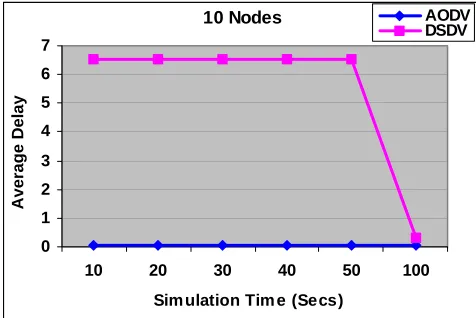
[image:3.612.327.565.383.541.2]Figure 1. Average delay for the 10-node model with varying Simulation Time
Figure 1 In less stressful situation the AODV has a better Average Delay than DSDV. With 100 Seconds Simulation time the differential is much smaller for both DSDV, AODV. AODV has lowest delay on the data packets received. The reason for this is that it finds routes faster or that the routes are shorter or more optimal. AODV with only MAC-layer support makes the protocol completely on-demand.
25 Nodes
0 0.01 0.02 0.03 0.04 0.05 0.06 0.07 0.08
10 20 30 40 50 100
Simulation Time (secs)
Averag
e Delay
aodv tora
Figure 2. Average delay for the 25-node model with varying Simulation Time
10 Nodes
0 50 100 150 200 250
10 20 30 40 50 100
Sim ulation Tim e (secs)
aodv dsdv tora
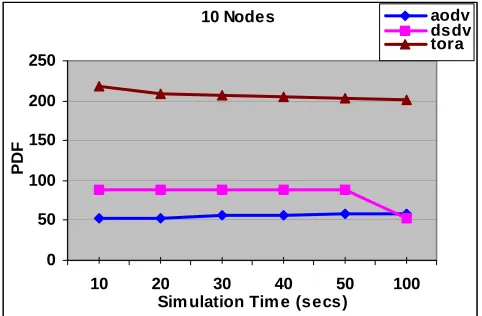
Figure 3. Packet Delivery Fraction for 10-node model with increased Simulation Time
Figure 3, As far as PDF is concerned in 10 nodes AODV performs better than the two protocols namely DSDV and TORA. When the Simulation time is increased from 50 to 100, the PDF of DSDV protocol is smaller than AODV.DSDV does poorly, dropping to a 50% of Packet Delivery Ratio at the simulation time of 100 seconds, nearly 50% of the dropped packets are lost because a stale routing table entry directed them to be forwarded over a broken line.
25 Nodes
0 50 100 150 200 250 300 350 400
20 30 40 50 100
Simulation Time (secs)
aodv dsdv tora
Figure 4. Packet Delivery Fraction for 25-node model with increased Simulation Time
Figure 4. In stressful situation, the simulations were carried out for 25 nodes. In this situation AODV has had better Packet Delivery Fraction than TORA. If the simulation time increases the TORA outperforms in 50 and 100 Simulation time. The reason is the aggressive use of route caching.
10 nodes
0 0.5 1 1.5 2 2.5
10 20 30 40 50 100
Simulation Time (Secs)
Routing Load
[image:4.612.326.565.53.212.2]AODV DSDV TORA
[image:4.612.327.564.337.496.2]Figure 5. Routing Load for 10-node model with increased Simulation Time
Figure 5 Less stressful situation TORA has lower routing load than DSDV and AODV. If we increase the Simulation time from 50 Seconds to 100 Seconds the Routing Load is high in DSDV. This is expected due to the more rapid change in the topology of the network. But there were no change in TORA and AODV.
25 nodes
0 0.5 1 1.5 2 2.5 3 3.5 4 4.5 5
10 20 30 40 50 100
SIMULATION TIME (Secs)
ROUTING LOAD
[image:4.612.49.290.393.554.2]AODV DSDV TORA
Figure 6. Routing Load for 25-node model with increased Simulation Time
Figure 6. In stressful situation the simulation carried out DSDV demonstrates lower routing load than TORA and AODV, if we increase the simulation time from 50 Seconds to 100 Seconds the routing load is high in DSDV in both the cases. The number of packets received is 50% of the packet sent. So the routing load is increasing at the simulation time of 50 Seconds onwards. This is due to table driven approach of DSDV maintaining information.
VI. CONCLUSTION
Packet Delivery Fraction, Routing Load and varying number of nodes and Simulation times were analyzed. AODV exhibits a better behavior in terms of the Average Delay. This better performance is explained by a soft-state updating mechanism employed in AODV to determine the freshness of the routes. In less stressful situation, the Packet Delivery Fraction, the TORA outperforms DSDV and AODV. In stressful situation DSDV outperforms AODV and TORA. In Normalized Routing Load in stressful situation DSDV demonstrate lower routing load in lower Simulation time. In Stressful situation TORA has lower routing load.
REFERENCES
[1] J. Broch, D. A. Maltz, D. B. Johnson, Y. C. Hu, and J. Jetcheva”, A Performance Comparison of Multi-Hop Wireless Network Routing Protocols,” Proceedings of the Fourth Annual ACM/IEEE International Conference on Mobile Computing and Networking (MobiCom’98), October 25-30, 1998, Dallas, Texas, USA, pp. 25-30. [2] S. R. Das, C. E. Perkins, and E. M. Royer, “ Performance
Comparison of Two On-Demand Routing Protocols for Ad Hoc Networks “, IEEE Personal Communications Magazine, Special Issue on Mobile Ad Hoc Networks, Vol. 8, No. 1, February 2001, pp. 16-29.
[3] C. E. Perkins, E. M. Royer, and S. R. Das, “Ad Hoc On- Demand Distance Vector (AODV) Routing”, Internet Draft, draft-ietf-manet-aodv-10.txt, work in progress, 2002.
[4] D. Johnson, D. Maltz, and J. Jetcheva, “The Dynamic Source Routing Protocol for Mobile Ad Hoc Networks “, Internet Draft, draft-ietf-manet-dsr-07.txt, work in progress, 2002.
[5] X. Zeng, R. Bagrodia, and M. Gerla, “GloMoSim: A Library for Parallel Simulation of Large Scale Wireless Networks”, Proceedings of the 12th Workshop on Parallel and Distributed Simulations, 1998, pp. 154-161.
[6] C.E. Perkins and P. Bhagwat, "Highly Dynamic Destination-Sequenced Distance-Vector Routing (DSDV) or Mobile Computers",
Comp. Comm. Rev., Oct. 1994, pp.234-244.
[7] S. Basagni, M. Conti, S. Giordano, and I. Stojmenovic, Mobile Ad Hoc Networking, A John Wiley & Sons, Inc., Publication, August 2004.
[8] D. O. Jorg, “Performance Comparison of MANET Routing Protocols in Different Network Sizes”, Computer Networks & Distributed Systems, 2003.
[9] P. Johansson, T. Larsson, and N. Hedman, “Scenariobased Performance Analysis of Routing Protocols for Mobile Ad Hoc Networks”, Proceedings of 5th Annual ACM/IEEE International Conference On Mobile Computing and Networking, 1999, pp. 195-206.
[10] M. Abolhasan, T. Wysocki, and E. Dutkiewicz, “A Review of Routing Protocols for Mobile Ad Hoc mobility for 50 nodes network [11] E. M. Royer, and C.K. Toh,”A Review of Current Routing Protocols for Ad Hoc Mobile Wireless Networks”, IEEE Personal Communications, Vol. 6, Issue 2, pp. 46-55, April 1999.