Available online on 15.04.2019 at http://jddtonline.info
Journal of Drug Delivery and Therapeutics
Open Access to Pharmaceutical and Medical Research© 2011-18, publisher and licensee JDDT, This is an Open Access article which permits unrestricted non-commercial use, provided the original work is properly cited
Open Access
Research Article
Development and validation of a spectrofluorimetric method for the
estimation of camptothecin in bulk and formulation
Sachin Bhusari*, Tejal Chaudhari, Pravin WakteUniversity Department of Chemical Technology, Dr. Babasaheb Ambedkar Marathwada University, Aurangabad, Maharashtra, India
ABSTRACT
A simple, accurate, precise, sensitive and cost-effective spectrofluorimetric method was developed and validated for the estimation of Camptothecin (CMPTO) in bulk and formulation. The relative fluorescence intensity of Camptothecin was measured in distilled water at an excitation wavelength of 278 nm and an emission wavelength of 419 nm. Proposed method was found to be linear over the range of 50 to 3000 ng/ml with correlation coefficient 0.9999. Proposed method was validated using different analytical method validation parameters viz. accuracy, precision, LOD, LOQ, robustness and ruggedness using QC standards as per the ICH guidelines. The percentage recovery was found to be 100.64 % and percentage RSD values were found to be less than 2 for accuracy and precision studies. The detection and quantification limits for the proposed method were found to be 15.76 and 47.98 ng/ml, respectively. A simple, accurate, precise, sensitive yet cost-effective spectrofluorimetric method was developed for the estimation of CMPTO in bulk and formulation. The said spectrofluorimetric method was found to be economic as it comprises water as a solvent.
Keywords: Spectrofluorimetry, Camptothecin, Validation,Excitation, Emission
Article Info:Received 15 Feb 2019; Review Completed 19 March 2019; Accepted 20 March 2019; Available online 15 April 2019
Cite this article as:
Bhusari S, Chaudhari T, Wakte T, Development and validation of a spectrofluorimetric method for the estimation of camptothecin in bulk and formulation, Journal of Drug Delivery and Therapeutics. 2019; 9(2-s):1-5
http://dx.doi.org/10.22270/jddt.v9i2-s.2586
*Address for Correspondence:
Dr. Sachin Shivling Bhusari, Assistant Professor, Pharmaceutical Technology Division,Department of Chemical Technology, Dr. Babasaheb Ambedkar Marathwada University, Aurangabad - 431001, Maharashtra, India.
INTRODUCTION
Camptothecin (CMPTO); (Figure.1) isquinoline based alkaloid isolated from the bark and stem of Camptotheca acuminata
(Cornaceae) a tree native to China.1-3CMPTO is a potent
anti-tumor agent mainly used for the treatment of stomach, lungs, pancreas and bladder cancer and certain types of leukemia,
often in combination with corticosteroids.4-6 CMPTO acts via
inhibition of an enzyme known as DNA topoisomerase I; an enzyme that catalyzes the relaxation of supercoiled DNA.
7-9Considering the therapeutic importance of CMPTO, some of
the analytical methods were reported from all over the globe but till today, there is no single spectrofluorimetric method available for the estimation of CMPTO using cost effective, non-reactive and biocompatible solvents. Therefore, a simple, sensitive, accurate and precise spectrofluorimetric method was developed for the estimation of CMPTO in bulk and its formulation.
MATERIALS AND METHODS
Camptothecin was purchased from TCI Chemicals (India) Pvt. Ltd. HPLC grade water was used for study.
Instruments Used
The spectrofluorimetric study was carried out with a Shimadzu RF-5301 Fluorimeter to determine levels of fluorescence in the CMPTO.A xenon 150 w lamp was used as a light source. Quartz cells having 48 mm height, 10 mm path length with 0.5mm slit width were used for fluorescence measurement. Weighing balance (Vibra HT, Essae) with internal calibration mode was used for the weighing purpose.
Preliminary Analysis
A preliminary analysis was carried out to determine the excitation and emission wavelength of CMPTO. Various solvents like distilled water, methanol, acetonitrile, isopropyl alcohol and their combinations were used to determine appropriate media for CMPTO. CMPTO showed maximum fluorescence intensity in water as a media. Initially, CMPTO solution of 100 ng/ml strength was prepared in water. Prepared solution was scanned spectrofluorimetrically to obtain the excitation and emission wavelengths. The scanning was performed over 220 nm to 500 nm range and excitation and emission wavelength were found to be 278 nm and 419 nm (Figure.2) respectively.
Figure 2: Emission scan of CMPTO at the excitation wavelength of 278 nm
Preparation of standard stock solution
Accurately weighed 5 mg of CMPTO was transferred into the calibrated volumetric flask and dissolved in 5 ml water to achieve a stock solution of 1000 μg/ml (Stock-I). Stock- I solution was suitably diluted with water to achieved further calibration standards.
Construction of calibration curve
Calibration curve was prepared by diluting the stock-I (1000 µg/ml) solution to achieve the seven different calibration standards representing 50, 100, 250, 500, 1000, 2000, 3000 ng/ml strength. The fluorescence intensity was measured at pre-defined excitation and emission wavelengths of 278 and 419 nm respectively. The calibration curve representing concentration vs. fluorescence intensity was plotted using Excel program of Microsoft Office 2013. Above mentioned procedure was repeated three times, so that reproducible results can be obtained.
Spectrofluorimetric Method Validation
Validation is the process which provides a high degree of assurance, so as to produce a desired result and meeting its predetermined specifications and quality characteristics. Developed fluorimetric method for the estimation of CMPTO
calibration standards and or quality control standards as described below.10-11
Linearity and Range
Linearity of the proposed Spectrofluorimetric method was calculated by using seven different calibration standards. After analysis of calibration standards, calibration curves in terms of concentration vs. fluorescence intensity plots were developed and subjected to linear least square regression analysis. R square value was considered to be important factor for determining the linearity of the proposed method.
Accuracy
To determine the accuracy of the method, different quality control solutions were prepared independently from Stock-I i.e., LQC: 60 ng/ml, MQC: 1500 ng/ml and HQC: 2900 ng/ml and analyzed at level of 80%, 100% and 120% of its
predefined concentrations .To the predefined
concentrations, different amounts of CMPTO were added (standard addition method) and the accuracy was calculated on the basis of percent recovery.
Precision
Stock-were recorded and the results Stock-were expressed as % relative standard deviation (%RSD).
Robustness
Robustness of the proposed spectrofluorimetric method was established by changing pH of the water by ± 0.5 units. MQC samples of CMPTO were prepared in water with altered pH media as mentioned above and analyzed at 278nm and 419 nm (excitation-emission wavelength of CMPTO). The results were calculated in terms of % RSD.
Ruggedness
Ruggedness of the proposed method was studied by analyst variation. MQC samples of CMPTO were prepared by three different analysts of the laboratory and were analyzed at 278nm and 419 nm. The results were calculated in terms of % RSD.
Limit of Detection (LOD) and Limit of Quantification (LOQ)
LOD and the LOQ of the drug were calculated by using the following equations as per ICH guidelines.
LOD = 3.3 × SD/S LOQ = 10 × SD/S
Where, SD= Standard deviation of lower most concentration of Calibration curve
S= Slope of calibration curve
Estimation of CMPTO in bulk and pellet formulation
In-house CMPTO controlled release pellets were prepared using MCC, Starch, HPMC, Eudragit and PVG by extrusion spheronization technique. Briefly, MCC, starch, HPMC and Eudragit were mixed together. PVG and CMPTO (dissolved in a mixture of methanol and water; 50:50 v/v) were added to the polymer mixture. In order to prepare wet mass as a feed to extruder, mixture of IPA and water (40:60 v/v) was added to above mixture of polymer and CMPTO. Said wet mass was extruded at 100 rpm using Single Screw Micro extrude. Extruded product was spheronized at 1250 rpm using Unisphere Lab Spheronizer. Pellets obtained after spheronization were dried at 45o C using Fluidized Bed
Dryer.
Five hundred mg pellets (equivalent to 1 mg CMPTO) containing CMPTO were dissolved in 10 ml water using ultrasonication and the solution was filtered using 0.22 µm filter. Filtered solution was suitably diluted and subjected to spectrofluorimetric analysis using prevalidated method. RESULTS AND DISCUSSION
Construction of calibration curve
Quantification of unknown samples by any instrumental method of analysis needs a reproducible calibration curve and a mathematical equation stating correlation between concentration and the response. As compare to graphical method, above stated method is widely accepted and reproducible in nature. To establish linearity of the proposed method, seven different calibration standards were prepared from the stock solution and analyzed at excitation wavelength 278 nm and emission wavelength 419 nm by spectrofluorimeter. Least square linear regression analysis
was performed for the obtained spectrofluorimetric data using MS-Excel 2013. Calibration curve was repeated five times for reproducibility. Various concentrations and their fluorescence intensities with mean ± standard deviation were reported (Table 1).
Table 1: Calibration standard data for CMPTO
S. No. Concentration
(ng/ml) Fluorescence intensity
1 50 13.547±0.5344
2 100 21.991±0.3762
3 250 44.495±0.5464
4 500 97.349±0.4641
5 1000 185.703±0.8805
6 2000 365.992±0.4746
7 3000 548.072±0.6183
Spectrofluorimetric Method validation Linearity and Range
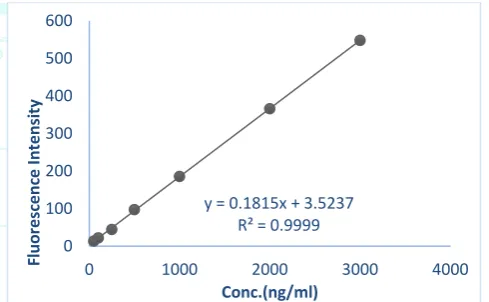
Linearity and range are the important parameters of analytical method that demonstrates the limit within which the intended method is to be used for its optimum performance. Considering the prime importance of linearity and the range, seven point calibration curve of CMPTO was plotted covering a range of 50-3000 ng/ml. Different concentrations and the respective mean fluorescence intensities values are depicted in Table 1. Calibration curve when subjected to least square regression analysis yielded an equation; y=0.1815x +3.5237 with correlation coefficient 0.9999 (Figure 3). From the linearity study, it was revealed that, developed method was linear over the concentration range of 50 to 3000 ng/ml.
Figure 3: Calibration curve for CMPTO Accuracy
Accuracy is the closeness of test results to the true value obtained by method. The accuracy of an analytical method
should be established over its calibration range so that at
any point of determination, results obtained would be accurate. For CMPTO, accuracy was determined using recovery studies. At 80, 100 and 120 % standard addition, mean recovery of CMPTO was found to be 100.64 %. The relative standard deviation (% RSD) was found to be less than 2 as shown in Table 2. From the results of accuracy studies, it was predicted that developed method is highly accurate.
y = 0.1815x + 3.5237 R² = 0.9999 0 100 200 300 400 500 600
0 1000 2000 3000 4000
Table 2: Accuracy data of Spectrofluorimetric method for CMPTO
S No. Concentration
(%) Origin level (ng/ml) Amount added (ng/ml) % Recovery Recovery Mean % % RSD
1 80 60 48 103.76
102.54 1.12
2 80 60 48 102.32
3 80 60 1500 101.54
4 100 1500 1500 99.079
98.19 0.79
5 100 1500 1500 97.99
6 100 1500 1500 97.52
7 120 2900 3480 99.87
101.20 1.59
8 120 2900 3480 100.78
9 120 2900 3480 102.97
Precision
Precision is defined as closeness of agreement among the individual test result when the method is applied repeatedly to multiple sampling of homogeneous sample. Precise analytical method leads to accurate results. Intra- and inter-day precision of Spectrofluorimetric method was established at 60, 1500 and 2900 ng/ml levels of CMPTO. The results
expressed in terms of mean fluorescence intensity values, % assay and % RSD for the intra- and inter-day precision study are demonstrated in Table 3 and Table 4 respectively. Percent RSD values of intra-day precision study were found to be in between 0.17 and 1.84 whereas those of inter-day precision study were in between 0.34 and 1.84 Overall; % RSD values of less than 2 demonstrated that developed spectrofluorimetric method is precise and reproducible.
Table 3: Intra-day precision data of Spectrofluorimetric method for CMPTO
Morning Afternoon Evening
S. NO Concentration
Range (ng/ml) Mean Assay % RSD % Mean Assay % RSD % Mean Assay % % RSD
1 60 11.474 103.37 1.78 11.430 102.98 1.82 11.245 101.30 1.84
2 1500 275.416 100.20 0.56 277.759 100.09 0.35 278.923 100.51 0.41
3 2900 535.982 99.54 0.18 533.901 99.51 0.17 537.714 100.22 0.34
Table 4: Inter-day precision data of Spectrofluorimetric method for CMPTO
Day 1 Day 2 Day 3
S. NO Concentration
Range (ng/ml) Mean Assay % RSD % Mean Assay % RSD % Mean Assay % % RSD
1 60 11.377 102.50 0.76 11.430 102.98 1.82 11.245 101.30 1.84
2 1500 277.833 100.12 0.51 277.357 100.09 0.35 278.923 100.51 0.41
3 2900 533.526 99.62 0.19 533.901 99.51 0.17 537.714 100.22 0.34
Robustness
Robustness of an analytical method is the measure of its capacity to remain unaffected by small but deliberate change in method parameters. It is an important parameter of analytical method as a small, un-intentional change in method parameters like solvent composition, buffer strength, pH etc. may occur during routine use and may hamper the performance of said method. It is expected that
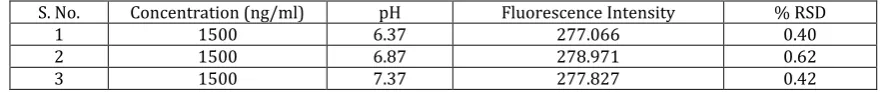
such change should not alter the performance of the method. Therefore, robust analytical method is preferred. Robustness of proposed Spectrofluorimetric method was performed by changing the pH of water. After analysis, it was found that change in pH of water did not affect the performance of method. Percent RSD values were found to be in between 0.40 and 0.97 (Table 5). Percent RSD values below 2 depicted that proposed Spectrofluorimetric method is robust in nature.
Table 5: Robustness data of Spectrofluorimetric method for CMPTO
S. No. Concentration (ng/ml) pH Fluorescence Intensity % RSD
1 1500 6.37 277.066 0.40
Ruggedness
Ruggedness of analytical method is the degree of reproducibility of test results obtained by analysis of the same samples under a variety of conditions, such as different laboratories, different analyst, different instruments, different lots of reagent, different temperatures etc.. In order
to determine the ruggedness of proposed
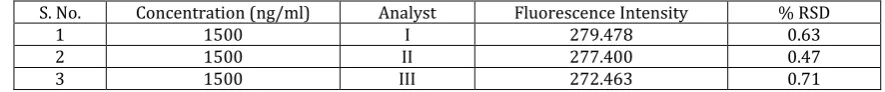
spectrofluorimetric method, CMPTO solutions were prepared and analyzed by different analysts. Sample analysis and data processing resulted into % RSD values between 0.47 and 0.71. Results of ruggedness studies revealed that proposed spectrofluorimetric method was rugged as it showed % RSD values less than 2 (Table 6).
Table 6: Ruggedness data of Spectrofluorimetric method for CMPTO
S. No. Concentration (ng/ml) Analyst Fluorescence Intensity % RSD
1 1500 I 279.478 0.63
2 1500 II 277.400 0.47
3 1500 III 272.463 0.71
Limit of Quantitation (LOQ) and Limit of Detection (LOD)
Limit of Quantification (LOQ) represents the lowermost concentration that can be analyzed with acceptable accuracy and precision. Limit of detection (LOD) of an individual analytical procedure is the lowest amount of an analyte in a sample which can be detected but not necessarily quantitated as an exact value. From the standard deviation of lower most concentration and the slope of the calibration curve, LOD and LOQ of proposed spectrofluorimetric method was found to be 15.7682 and 47.7823 ng/ml respectively (Table 7). Lower LOQ value indicated that proposed method is sensitive enough to quantify the CMPTO content of samples at its lower level.
Table 7: LOD & LOQ data for Spectrofluorimetric method for
CMPTO
1 LOD 15.7682 ng/ml
2 LOQ 47.7823 ng /ml
Estimation
The developed spectrofluorimetric method was successfully applied for estimation of CMPTO in controlled release pellets. By proposed method, CMPTO content in the pellets was found to be 102.78 ± 0.57 %.
CONCLUSION
A simple, accurate, sensitive and precise spectrofluorimetric method for the estimation of CMPTO was developed and validated. The Proposed method was found to be robust and rugged in nature with high accuracy and precision. Proposed method was successfully used for the estimation of CMPTO in its pellet formulation.
REFERENCES
1. Saravanan and Boopalan, Occurance of Camptothecin an anticancer drug from Ixoracoccinealinn. International Journal of Applied Biology 2011; 2(2):30-34.
2. Buchi N., Saisrianusha V., Chandrapriyanka B., Development of Validated Stability Indicating RP-HPLC-PDA Method for Camptothecin Analysis. Journal of Applied Pharmaceutical Science2016; 6(09):140-146.
3. Emanuela M., Serena D., Volpe B., Elisa TB, Emanuele BB, Mirena S. et al. The long story of camptothecin: From traditional medicine to drugs. Bioorganic & Medicinal Chemistry 2017; 701–707.
4. Hatefi A., Amsden B., Camptothecin Delivery Methods. Pharma ceutical Research 2002; 19(10):1389-1399.
5. Mithun PR., Jobi Xavier., Reddy J., Praveen N., Production of Camptothecin from Nothapody tesnimmoniana: An Overview. International Journal of Life Sciences Research 2017; 3(6): 1476-1483.
6. Das B., Madhusudhan P., Reddy PV, Anitha Y., Natural Camptothecin. Indian Journal of Chemistry 2001; 40(B):453-464.
7. Dharamrajan S., Perumal Y., Rathinasabapathy T.Camptothecin and its analogues: a review on their chemotherapeutic potential. Natural product research 2004; 19(4):393-412. 8. Ziomkowska1 B., Kruszewski S., Siuda R., Cyrankiewicz
M.Deactivation rate of Camptothecin determined by factor analysis of steady-state fluorescence and absorption spectra. Optica Applicata 2006; 36(1):134-148.
9. Patil AS., Kale AS., Patil SR., Paikrao HM. Validation of accumulation of camptothecin content, an anti-cancer alkaloid
in Nothapodytesnimmonianagraham, in phenotypic variants;
method for identifying high-yielding sources of alkaloid. International journal of pharmacy and pharmaceutical sciences 2016; 8(9).
10. Note for guidance on validation of analytical procedures: text and methodology. European Medicines Agency.1995: 1-15. 11. Validation of analytical procedures: text and methodology Q2