*Corresponding Author:
Mohamed Ashraf Ahmed Mamdouh Abd Elrahman Faculty of pharmacy October 6 University
Central Axis - Part 1/1, 6th of October City, Giza, Egypt.
Email: [email protected] Phone: +201140708626
Research Article
Different Solid Dispersion Techniques for Dissolution Enhancement Using
Paracetamol as a Model Drug
Mohamed A. A. Mamdouh
1*, Alia A. Badawi
2, Wedad S. Sakaran
3, Ahmed H. Elshafeey
2, Osama S. Elnahas
11Department of Pharmaceutics, Faculty of Pharmacy, October 6 University, Egypt. 2Department of Pharmaceutics, Faculty of Pharmacy, Cairo University, Egypt. 3Department of Pharmaceutics, Faculty of Pharmacy, Helwan University, Egypt.
1. INTRODUCTION
The adoption of High-throughput screening (HTS) methodologies in pharmaceutical industries, has led to an increase in the percentage of new lipophilic drug molecules with poor water solubility in the development stages 1. Poor water solubility hinders dissolution and therefore limits drug concentration at the target site, often to an extent that the therapeutic effect is not achieved. Such cases necessitate the development of solubility enhancement procedures in order to improve dissolution, reduce variability, and, ultimately, improve the drug therapy 2. Several formulation approaches such as salt formation 3, solubilisation 4, complexation 5 and particle size reduction 6, have commonly been used to increase the dissolution rate and thereby oral absorption and bioavailability of such drugs. Among the alternative formulation approaches explored to enhance the bioavailability of such poorly water soluble drugs was the development of solid dispersions. The term solid dispersion refers to a group of solid products consisting of at least two different components, generally a hydrophilic matrix and a hydrophobic drug. The matrix can be either crystalline or amorphous. The drug can be dispersed molecularly, in amorphous particles (clusters) or in crystalline particles 7. The two basic procedures used to prepare solid dispersions are fusion and solvent evaporation techniques. From these methods and combinations of them, several other methods have evolved, with the key steps being involved, are converting the drug and carrier from their solid state to fluid or fluid like state through processes such as melting or dissolving in solvent or cosolvent, followed by mixing the components in their -fluid state. Finally the -fluid mixture is transformed into solid phase through processes such as congealing or solvent removal 8. Among these methods, hot melt extrusion (HME) has attracted increasing
attention as novel strategy to produce delivery systems with enhanced dissolution and bioavailability 9. HME involves usage of heat to transform the raw materials into homogenously mixed mass, that is, solid dispersion. Hot melt extrusion can be simply defined as the process of forming a new material (the extrudate) by forcing a material through an orifice or die under controlled conditions such as temperature, mixing, feed-rate and pressure 10. The extruder is typically composed of a feeding hopper, barrel, screw, die, screw-driving unit, and a heating/cooling device 11. Paracetamol is probably the most popular, effective and most widely used non-opioid analgesic for acute pain 12. It is described to be very slightly soluble in cold water 13. Review of literature reveals a wide controversy about the biopharmaceutical classification system (BCS) categorization of paracetamol 14–17. Nevertheless, this controversy about categorization, several approaches have previously been used to achieve a more rapid absorption of paracetamol solid dose formulations. These include enhancement of tablet disintegration rate, enhancement of drug dissolution rate by using amino acid salts, or alkali metal salts of paracetamol, and the addition of either sorbitol or antacids to paracetamol tablets 18. It was reported that a fast-dissolving paracetamol formulation is expected to overcome some of the issues associated with the slow and variable absorption of standard paracetamol tablet formulations, thereby improving therapeutic outcome and avoiding the need to switch to alternative therapeutic options 19.
In this study, paracetamol was used as a model drug for preparation of SDs using different carriers by applying solvent evaporation, fusion and HME techniques.
2. MATERIALS
Paracetamol (C8H9NO2) was a kind gift from EVA pharmaceutical company, Eudragit E100 was supplied by Rohm GmbH and Co. KG (Darmstadt, Germany). Polyethylene glycol 6000 (PEG6000) and hydrochloric acid were obtained from Merck (Germany). PVP k30 and HPMC 2910 were supplied by Loba Chemie (Mumbai, India). Abstract
The objective of this study was to investigate the effect of different preparation techniques such as fusion, solvent evaporation or hot melt extrusion (HME) on the characteristics of solid dispersions (SDs) using paracetamol (PCT) as a model drug. SDs of PCT, with different carriers viz., Eudragit E100, mannitol, HPMC, PVP and PEG 6000, were prepared at 1:1 ratio. Initially, solvent evaporation and fusion were used for the preparation of PCT SDs. The prepared SDs were characterized using DSC, FT-IR and in vitro dissolution. Eudragit E100 and mannitol exhibited the best dissolution performance. Based on both dissolution data and crystallinity reduction, Eudragit E100 was selected for preparation of solid dispersions using HME, as a third preparation technique, at the ratios of 1:1 and 1:2. The powdered extrudates were characterized for their thermal characteristics, powder X-ray diffraction (PXRD), and dissolution behaviour. Extrusion completely transformed the drug into an amorphous form with a complete loss of crystallinity, as evidenced by DSC and PXRD. The dissolution patterns were close to those prepared by either solvent evaporation or simple fusion. It could be concluded that the different preparation techniques resulted in SDs with almost similar characteristics, however, HME would offer several advantages over the traditional techniques.
ISSN (Online) 2249-6084 (Print) 2250-1029
International Journal of Pharmaceutical and
Phytopharmacological Research (eIJPPR)
[Impact Factor
–
0.852]
Journal Homepage: www.eijppr.com
Article info
Article History:
Received 5 December 2014 Accepted 21 January 2015
Keywords:
Other chemicals were of compendial grade and were used as received
3. METHODS
3.1 Preparation of SDs 3.1.1 Solvent evaporation
Paracetamol SDs were prepared using different carriers viz., Eudragit E100 (EUD), mannitol, HPMC, PVP and PEG 6000 at a 1:1 ratio. Accurately weighed amounts of the drug and carrier were dissolved in a minimum volume of ethanol (95%) and the solvent was removed under reduced pressure in a rotary evaporator (Heidolph WB2000, Germany) at 40 ± 2 °C. The resultant SDs were collected, pulverized in a mortar, passed through a 355 µm sieve (Gilson Inc. USA) and then stored in a desiccator at ambient temperature 20.
3.1.2 Fusion
SDs were prepared by mixing the drug and carrier, and then the binary mixture was heated and manually fused on a sandbath. The resulting homogenous preparations were rapidly cooled. Subsequently the dispersions were pulverized in a mortar, passed through a 355 µm sieve and then stored in a desiccator at ambient temperature 21.
3.1.3 Hot melt extrusion
HME was carried out using EUD as a carrier at drug to carrier ratios of 1:1 and 1:2. Hot melt extrusion was performed using a locally manufactured and validated single screw extruder. The screw-configuration consisted of three zones, namely feeding, mixing/compression and metering, over the whole barrel length with screw L/D ratio of 20/1 22. The screw rotation rate was fixed at 40 rpm 23. The drug was premixed with EUD at drug to polymer ratios of 1:1 or 1:2. Extrusion was performed at 140 °C, which is below the melting point of crystalline PCT (≈170 °C). The extrudates were collected after cooling at ambient temperature. Samples were milled for a very short period using a laboratory-cutting mill (IKA M20, Germany) with a cooling system to avoid over heating of the samples, and sieved to exclude particles > 355 mm. All samples were stored in a desiccator at ambient temperature and analyzed. 3.2 Characterization of the solid dispersions
a) Percentage yield and drug content
The collected SDs were weighed and compared to the initial weight 24. The percentage yield of PCT SDs was determined by using the
following formula:
An accurately weighed amount of SDs, equivalent to 0.1gm PCT was dissolved in 100 ml 0.1M HCl. The solution was sonicated and then stirred for 15 min using a magnetic stirrer to ensure complete dissolution of the drug. After filtration and proper dilution, the concentration of the solution was determined spectrophotometrically at the predetermined λmax of 243 nm in 0.1M HCl. The percentage of drug content in each formulas was calculated using the following equation:
The mean value of triplicate estimates was used in calculating the required amounts for dissolution experiments 25.
b) Thermal studies
Differential scanning calorimetry (DSC) studies were conducted using DSC (Shimadzu, DSC60, Japan) at a heating rate of 10 ºC min−1 with a nitrogen purge of 20 ml min−1. DSC thermograms for
the pure drug, excipients, drug-excipients physical mixtures (1:1 w/w) and the PCT SDs were performed using crimped aluminium sample pans. An empty pan was used as reference and calibrations for temperature and enthalpy were performed routinely with indium (melting point, 156.61º C; enthalpy of fusion, 28.71 J.g -1).
Microscopical observation accompanied by heating was performed using a Kofler hot stage microscope under polarized light (Reichert, Austria), equipped with a temperature controller (Jumoi Tron 04, Germany). Cross-polarization was used to investigate changes of crystallinity during heating (examined for birefringence)26.
c) Fourier Transform Infrared Spectrophotometry (FT-IR) Pure PCT, plain carriers, and PCT SDs were characterized by FT-IR (Shimadzu, FT-IR Affinity-1, Japan). Samples prepared in potassium bromide discs were subjected to FT-IR recording. Data
were analyzed over a spectral range of 4000–400 cm-1 at a resolution of 2 cm−1 and 50 co-added scans.
d) Powder X-ray diffraction (PXRD)
PXDR patterns of the pure drug and extruded SDs were recorded using an X-ray diffractometer (EMPYREAN, PAN alytical, Netherlands) with Cu anode Kα radiation: Kα1 = 1.54056 Å; Kα2 =1.5443 Å. The patterns were collected in the angular range 5 ≤ 2θ ≤ 79◦ in a step scan mode 27.
e) In vitro dissolution
The in vitro dissolution of PCT in the form of pure powder and its SDs was carried out using USP apparatus II (paddle) at a stirring speed of 50 rpm. An accurately weight amount of each of the prepared SDs, equivalent to 500 mg of PCT, was placed in a dissolution medium of 900 ml 0.1 M HCl maintained at a temperature of 37 ± 0.5°C. Samples of 5 ml were withdrawn at predetermined intervals of 2, 5, 7, 10, 15, 20, 30, and 45 minutes. The removed volumes were immediately replaced with 5 ml of fresh dissolution medium to maintain the volume constant and to preserve the sink conditions. Samples were filtered and appropriately diluted with the dissolution medium and analyzed spectrophotometrically at 243 nm 24.
Dissolution profiles were constructed by plotting the cumulative percent of drug dissolved against time.
In order to assess the comparative extent of the dissolution rate enhancement from SDs, mean dissolution time (MDT) was calculated and compared along with the percentage of drug dissolved after 2 minutes (Q2min). Statistical analysis of data (ANOVA) followed by Post Hoc test LSD (least significant difference) for multiple comparisons at (P < 0.05) was carried out using software of SPSS version 14.0. to test the significance of the results.
4. RESULTS AND DISCUSSION
Preparation of the SDs by solvent evaporation was rather straightforward. The removal of solvent with the aid of the rotary evaporator was rather rapid except for the cases of PVP and HPMC where the solution thickened with the evaporation of the solvent, prolonging the removal time of the remaining liquid. The products stuck to the inner walls of the vessel and were quite difficult to remove.
Regarding fusion, similar observations were noted for PVP and HPMC SDs due to the fact they did not soften enough with heating. PEG readily melted completely at about 55 °C allowing for proper mixing of the drug in the molten carrier. Mannitol melted almost at the same time as the drug and could be mixed together thoroughly. EUD was quiet flexible and mixing with the drug could be achieved easily.
For either techniques, HPMC SDs were very hard, posing a difficulty in size reduction compared to the other carriers.
a. Percentage yield and drug content
As observed from Table 1, the percentage yield was generally high for PCT SDs prepared using EUD, mannitol and PEG. On the other hand, PVP and HPMC showed lower yield percentages, which may be due to sticky and viscous nature of the product whether during fusion or during the evaporation of the concentrated solution and the hardness of the final product during grinding. The method of preparation had no obvious effect on the yield percentage. Drug content of all the prepared PCT SDs was found to be in the range of 96.2 ± 0.8 - 103.4 ±1.8 %.
Table 1: Percentage yield and drug content of paracetamol solid dispersions prepared using different carriers.
Carrier
Solvent Evaporation Fusion
Formula Percentage yield (SD)
Drug Conten
t (SD)
Formula Percentage yield (SD)
Drug Content
(SD)
Eudragit
E100 SE 89.4 (2.7) 100.7 (1.5) FE 86.0 (5.8) 98.5 (2.4) PVP-K30 SV 77.4 (3.7) 96.2 (0.8) FV 86.4 (3.7) 103.4 (1.8)
PEG
6000 SP 88.0 (4.2) 101.5 (2.3) FP 80.0 (5.2) 101.8 (1.4) Mannitol SM 94. 7 (4.5) 98.2 (1.6) FM 89.5 (3.5) 101.1 (1.1)
HPMC
b. Thermal Studies
DSC thermograms of the carriers, physical mixtures and SDs are depicted in Figure 1. The thermogram of pure PCT showed a sharp endothermic peak at 171.2 ºC which corresponds to the melting of the stable crystalline form I28. Eudragits are amorphous polymers and thus EUD exhibited no major thermal events 24. For the physical mixture with EUD, the melting endotherm of PCT was well preserved with slight changes in terms of broadening or shifting towards the lower temperature. It has been reported that the quantity of material used, especially in drug–excipient mixtures, affects the peak shape and enthalpy. Thus, these minor changes in the melting endotherm of the drug could be due to the mixing of drug and excipient, which lowers the purity of each component in the mixture and may not necessarily indicate potential interaction 29. The SDs prepared by either method exhibited further lowering and broadening of the drug peak. The peak values were 160.3 and 160.9 ºC for SE and FE, respectively. This shift could be explained by PCT being partly soluble in the polymer. It is suggested that the miscibitly of the molten drug with a polymer would lead to melting point depression of drug crystals embedded in the polymer matrix 30. Estimation of the degree of PCT crystallinity in the prepared SDs
was performed based on the change in fusion enthalpies. Since the amorphous state can be characterized by a loss of melting point, DSC can be used to evaluate amorphous content in the samples. An estimation of drug “crystallinity” was obtained using the difference between actual and theoretical enthalpies of fusion, calculated by:
Where Δ Hs and Δ Hc are enthalpies of fusion of sample and pure drug, respectively, and C is the weight fraction of drug in the mixture. The equation, adapted from Pikalet al31, assumes that the pure drug was 100% crystalline and that no dissolution has taken place during the run, nevertheless, provides an interesting method of estimating the distribution of the drug in two coexisting forms. However, it should be noted that the DSC approach essentially shows the amorphous content only at the temperature of determination (i.e. at the melting point of drug) 32. The enthalpy of fusion of pure PCT was measured to be 181.18 J/g which was in agreement with the reported value range of 176 to 188 J/g 33. The calculated degree of crystallinity were found to be 46.2 and 38.8% for SDs prepared by solvent evaporation and fusion, respectively. The shifts of paracetamol melting peaks and reduction in crystallinity suggest the co-existence of molecularly dispersed and crystalline paracetamol within the polymer matrix 34.
The thermal behaviour of PVP exhibited a broad endothermic effect in the 90–140ºC range due to polymer dehydration and no melting peaks were recorded, which is expected for hygroscopic, amorphous substances 35. This broad endotherm was maintained in all formulations. As for the physical mixture (PMV), the melting peak of PCT appeared at a lowered value of 142.7 ºC. The SDs exhibited minor peaks at markedly lower temperatures of 126.9 and 134.5 ºC for SV and FV, respectively. Hot Stage Microscopy (HSM) can provide visual evidence to confirm the results of DSC 36. HSM photos of FV are represented in Figure 2. At about 120 ºC the polymer particles started to soften then liquefied at about 130 ºC revealing few small crystalline particles, attributed to PCT, which started to melt rapidly. Such a decrease in PCT crystallinity with PVP was described earlier by de Villiers 37.
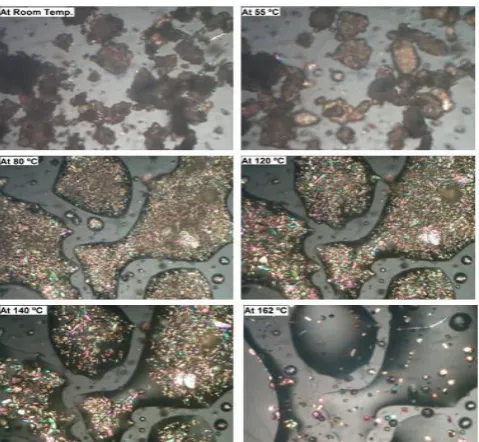
PEG 6000 showed a sharp endothermic peak at 58.5 ºC corresponding to melting. The PCT SDs prepared by either method exhibited the drug peak at lower temperatures than the pure drug and with much lowered intensity( reduced peak area). HSM was used to study the physical state of the drug in the prepared SDs. As shown in Figure 3, the initial photos at ambient temperature, showed a significant amount of birefringence of crystalline drug. At about 55 ºC, PEG started to melt forming liquid droplets filled with numerous extremely small crystals. The drug started to dissolve rapidly into the polymer with the process reaching its maximum at about 140ºC, way before the melting pointed of PCT. This can explain the pronounced change in the positions and the size of the peaks. This phenomenon has been also reported for SDs of other drugs with PEGs 38.
As illustrated, Mannitol exhibited a sharp endothermic peak at 168.5 ºC corresponding to its melting 39. In the DSC thermograms of the SDs, the two crystalline peaks were fused into a single
broader endothermic peak that appeared at about 164 ºC due to overlapping of the two melting processes 40.
HPMC exhibited a broad depression which presented a characteristic effect of elimination of water surface between 50 and 100 °C 41. There was a small shift in the melting peak of the drug in the physical mixture towards lower values. The shift in the endotherm peak was more pronounced in SDs especially those prepared by fusion. There was an apparent decrease in crystallinity of the drug judged by the reduction in the area of the endothermic peak and the corresponding fusion enthalpy.
Figure 1: DSC thermograms of paracetamol (PCT), its physical mixture (denoted PM) and solid dispersions prepared by solvent evaporation (denoted S) or fusion (denoted F) using different carriers at a 1:1 ratio.
Figure 3: HSM photos of paracetamol solid dispersion prepared by fusion using PEG 6000 at 1:1 drug to carrier ratio.
c. Fourier Transform Infrared Spectrophotometry (FT-IR) FT-IR analysis in the present study were carried out to investigate the interactions between the drug and carriers in SD systems. As shown in Figures 4 & 5, PCT exhibited a peak at 3325 cm-1which is assigned to the N–H stretching vibration, and peaks around 3161 cm-1 due to the OH stretching vibration plus other combination bands. The peaks at 1651, 1556, 1257 and 1226 cm-1 are assigned to the C═O stretching vibration of amide I band, N–H in plane bending and/or C–N stretching of amides II and III vibrational bands, respectively. The peaks at 1611, 1507, and 1443 cm-1 are due to the C–C bond stretching of aromatic benzene ring 42. The FT-IR spectra of SDs with EUD, mannitol and HPMC maintained the characteristic peaks of PCT at 3325 and 1655 cm-1 and carriers remained unchanged and the spectra data was superimposed. Qi et al.28 reported the disappearance of the PCT peaks at 3325 cm-1 in EUD SDs, however, they attributed that to the low concentration of PCT in their trial.
However with PVP, both the characteristic peaks of paracetamol at 3325 cm -1 and the PVP peak at 1670 cm−1 which corresponds to
the carbonyl stretching 43 disappeared which is indicative of hydrogen bonding between the drug and PVP 44. PCT is reported to interact with other compounds containing the carbonyl group through formation of dipolar or hydrogen bonds 45.
The infrared spectra for PEG 6000 was characterized by sharp peaks at 3458, 2887 and 1467 cm-1 corresponding to the stretching associated with O–H, C–H and C–O bonds, respectively. The disappearance of the hydroxyl (–OH) peak characteristic for PEG disappeared in the prepared SDs along with the shift in the carboxyl group of PCT to 1641 cm-1 suggest the formation of H-bonds between the two materials 46.
Figure 4: FT-IR charts of paracetamol and its solid dispersions prepared by solvent evaporation using different carriers at a 1:1 ratio (SE= Eudragit, SM mannitol, SP= PEG, SH =HPMC and SV= PVP).
d. In vitro dissolution
The dissolution profiles, of all the prepared PCT SDs, are illustrated in Figures 6 & 7 and were compared to the dissolution profile of PCT pure powder. Two dissolution parameters were used to compare the constructed dissolution profiles, the first was the percentage dissolved after 2 minutes (Q2min) and the second was the mean dissolution time (MDT), which is a model independent in-vitro parameter defined as the mean time for the drug to dissolve under in-vitro dissolution conditions 47.
MDT was calculated using the following equation:
Where is the midpoint of the time period during which the fraction of the drug has been dissolved from the dosage form. A higher MDT value for a drug delivery system means that it has a slower in vitro drug dissolution.
Pure PCT dissolved completely within 45 minutes with an MDT of 9.63 minutes. The percentage of PCT dissolved after 2 minutes (Q2min) was 18.5 %. The values of Q2min of the different SDs compared to that of PCT are represented in Figure 8. It could be noticed that all the prepared SDs exhibited a significant increase in the initial dissolution of the drug after 2 minutes. For SDs prepared by solvent evaporation the values of Q2min ranged from 87.5 to 42.9 %. It was found that SDs prepared using EUD and mannitol showed the highest percentages whereas those prepared with HPMC showed the lowest. Similarly for SDs prepared by fusion, Q2min ranged from 84- 42 %. The highest percentages were again obtained by EUD and mannitol whereas the lowest were recorded for HPMC which could be attributed to the fact that HPMC dissolves very slowly in water as at first it swells in aquatic media and forms a gel layer resulting in rather slow dissolution rates 48.
The MDT was reduced significantly for SDs (p < .0.05) prepared by either methods using EUD or mannitol with values of 1.58 and 2.19 minutes for solvent evaporation and 2.44 and 1.66 minutes for fusion method, respectively, as shown in Figure 9. The enhanced dissolution rate from EUD dispersions results in part from the microenvironment and wettability created by the polymer 49. In addition, the reduction in crystallinity, which was evidenced by DSC, suggested that the drug was partially molecularly dispersed within the polymer matrix. As for mannitol, despite the fact that the crystalline state of the drug did not change as evidenced from DSC, the obtained higher dissolution rates could be attributed to improved wetting of the crystal surface mainly due to attached mannitol particles, which provoked the solubilizing effect. The carrier attracts the dissolution medium and increases its amount in the immediate vicinity of the drug. Furthermore, the arrangement of carrier physically separates drug particles, preventing their aggregation after introduction of the solid-dispersed system to the dissolution medium 50.
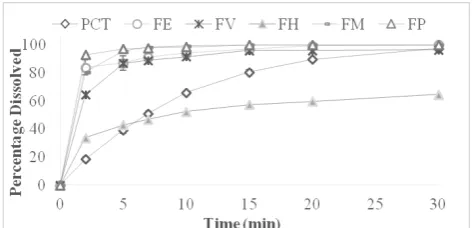
Figure 7: Percentage paracetamol dissolved in 0.1 M HCl from solid dispersions prepared by fusion using different carriers at 1:1 ratio (FE= Eudragit, FM mannitol, FP= PEG, FH =HPMC and FV= PVP).
Figure 8: Percentage paracetamol dissolved after 2 minutes (Q2min) in 0.1 M HCl from solid dispersions prepared by solvent evaporation or fusion using different carriers at 1:1 ratio.
Figure 9: Mean dissolution time (MDT) in 0.1 M HCl of solid dispersions prepared by solvent evaporation or fusion using different carriers at 1:1 ratio.
e. Preparation and characterization of PCT extrudates
Based on the previous results, EUD was selected to be used in the preparation of PCT SDs by HME. Solid dispersions were prepared at the drug to carrier ratios 1:2 and 1:1 (EX1 and EX2, respectively) to study the effect of drug to carrier ratio on the properties of solid dispersions. The extrusion process went rather straightforward without the need for incorporating further additives.
Assessment of drug content of the extrudates
The drug content was found to be 104.8-± 3.2 % and 101.9 ± 2.4 % for EXE1 and EXE2, respectively indicating uniform drug distribution.
DSC of PCT extrudates
HME as a melting based approach, has been established as a standard processing method for the preparation of amorphous molecular dispersions in the pharmaceutical industry51. Comparing the DSC thermograms of the extrudates, depicted in Figure 10,to the corresponding ones of PCT SDs prepared by either solvent evaporation or fusion, revealsthe complete disappearance of the endothermic melting peak of paracetamol at 171.2 ºC for the extrudates, whereas it was just reduced in size for SDs prepared by the other methods. This lack of an endothermic peak with HME indicates that the drug was dispersed molecularly within the amorphous polymer chain network and therefore existed in the amorphous form 52. Moreover, no other thermal event was detected in the solid dispersions, which indicates formation of a single phase
system 53. Although extrusion was performed at 30°C below the melting point of paracetamol, the excessive mixing and shearing induced by the process was sufficient to convert the physical state of the drug. Yang et al51 were able to produce such molecularly dispersed solid dispersions of felodipine using EUD via HME up to 50% drug concentration.
PXRD of PCT extrudates
The amorphous state of the drug in the extrudates was further confirmed by PXRD. As illustrated in Figure 11-A, the characteristic peaks in the diffractogram of pure paracetamol indicated its presence in the crystalline form, with the major peaks appearing at 18, 23.4, 24.3 and 26.5° 2θ 32. The diffractograms of the extrudates, Figure 11-B&C confirmed the results obtained by DSC. The PXRD pattern showed a broad “halo” in the range of 4–35° 2θ and no sharp diffraction peaks were observed for the extrudates, which is indicative of absence of long range molecular order in both solid dispersion systems and the presence of the drug in an amorphous state 54.
Figure 10: DSC thermogram of paracetamol-Eudragit extrudates prepared by hot melt extrusion. (PCT = paracetamol, EXE2 and EXE1 extrudates prepared at paracetamol: Eudragit ratios 1:1 and 1:2, respectively).
Figure 11: X-ray diffractograms A: paracetamol, B: EX1 and C: EX2 (extrudates prepared at paracetamol: Eudragit ratio 1:2 and 1:1, respectively).
In vitro dissolution study of PCT extrudates
Figure 12: Percentage paracetamol dissolved in 0.1 M HCl from paracetamol extrudates prepared using Eudragit E100. (PCT = paracetamol, EXE1 & EXE2 extrudates prepared at paracetamol: Eudragit ratios 1:2 and 1:1, respectively).
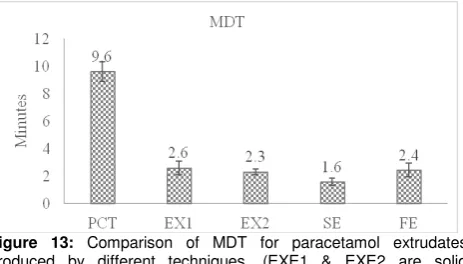
Figure 13: Comparison of MDT for paracetamol extrudates produced by different techniques. (EXE1 & EXE2 are solid dispersions prepared by HME, at paracetamol: Eudragit ratios 1:2 and 1:1, SE &FE are solid dispersions prepared by solvent evaporation and fusion at 1:1 ratios, respectively).
5. CONCLUSION
Solid dispersion has proven to be a valuable tool in the enhancement of drug dissolution. Preparation method, either simple fusion or solvent evaporation, did not show marked differences on the properties of the prepared solid dispersions. Mannitol and EUD were able to positively influence the drug dissolution. In comparison with those traditional methods for preparation, hot melt extrusion (HME), using EUD as a carrier caused a complete disappearance of drug crystallinity at the ratios 1:1 and 1:2. Although the release from the extrudates was not that different from the solid dispersions prepared by solvent evaporation or fusion, it still offered many advantages over those methods. The freedom of the process from organic solvents and the rapid preparation with short exposure to elevated temperatures and the fact that the operational temperature was about 30 °C below the melting point of the drug. Besides, hot melt extrusion is a continuous process thus necessitating fewer processing steps. The method also offered an improvement in the flowability properties of drug with flow properties. Hot melt extrusion is a promising novel technology for improving the performance of poorly water soluble drugs, offering many advantages for pharmaceutical applications.
REFERENCES
1. Saerens L, Ghanam D et al. "In-line solid state prediction during pharmaceutical hot-melt extrusion in a 12 mm twin screw extruder using Raman spectroscopy." Eur J Pharm
Biopharm, 2014, 87(3):606–15.
2. Benet LZ, Mancinelli L. Clinical Pharmacokinetics and Pharmacodynamics. In: Swarbrick James, editor. Encycl.
Pharm. Technol. 3rd ed. Informa Healthcare, 2006. p. 38–
572
3. Paluch KJ, McCabe T et al. "Formation and physicochemical properties of crystalline and amorphous salts with different stoichiometries formed between ciprofloxacin and succinic acid." Mol Pharm, 2013, 10(10):3640–54.
4. Zhang F, DiNunzio J. Solubilized Formulations. In: Williams III Robert O, Watts Alan B, Miller Dave A, editors. Formul.
Poorly Water Soluble Drugs SE - 5, vol. 3. Springer New
York, 2012. p. 171–208
5. Di Cagno M, Terndrup Nielsen T et al. "β -Cyclodextrin-dextran polymers for the solubilization of poorly soluble drugs." Int J Pharm, 2014, 468(1-2):258–63.
6. Xu J, Luo KQ. "Enhancing the solubility and bioavailability of isoflavone by particle size reduction using a supercritical carbon dioxide-based precipitation process" Chem Eng
Res Des, 2014, 92(11):2542–9.
7. Soni S, Dhiman D. "Preparation and In Vitro Characterization of Acetaminophen by Solid Solution Technique" J Drug Deliv Ther, 2012, 2(5):71–4.
8. Vasanthavada M, Tong W-Q et al. Development of Solid Dispersion for Poorly Water-Soluble Drugs. In: Liu Ron, editor. Water-Insoluble Drug Formul., vol. Second. CRC Press, 2011. p. 499–529
9. Fule R, Amin P. "Development and evaluation of lafutidine solid dispersion via hot melt extrusion: Investigating drug-polymer miscibility with advanced characterisation" Asian J
Pharm Sci, 2014, 9(2):92–106.
10. Andrews GP, Jones DS et al. "Hot-melt extrusion: an emerging drug delivery technology" Pharm Technol Eur, 2009, 21(1):24–7.
11. Kolter K, Karl M et al. , Hot-Melt Extrusion with BASF
Pharma Polymers,2nd ed., BASF, Germany, 2010
12. Bosch ME, Sánchez AJR et al. "Determination of paracetamol: Historical evolution" J Pharm Biomed Anal, 2006, 42(3):291–321.
13. Moffat AC, Osselton D et al. , Clarke’s Analysis of Drugs and Poisons: In Pharmaceuticals, Body Fluids and
Postmortem Material,4th ed., Pharmaceutical Press,
London, 2011
14. Ramirez E, Laosa O et al. "Acceptability and characteristics of 124 human bioequivalence studies with active substances classified according to the Biopharmaceutic Classification System." Br J Clin Pharmacol, 2010, 70(5):694–702.
15. Kasim N a, Whitehouse M et al. "Molecular properties of WHO essential drugs and provisional biopharmaceutical classification." Mol Pharm, 2004, 1(1):85–96.
16. Kalantzi L, Reppas C et al. "Biowaiver monographs for immediate release solid oral dosage forms: Acetaminophen (Paracetamol)" J Pharm Sci, 2006, 95(1):4–14.
17. Govedarica B, Injac R et al. "Formulation and evaluation of immediate release tablets with different types of paracetamol powders prepared by direct Compression"
African J Pharm Pharmacol, 2011, 5(1):31–41.
18. Sevilla-Tirado FJ, González-Vallejo EB et al. "Bioavailability of two new formulations of paracetamol, compared with three marketed formulations, in healthy volunteers."
Methods Find Exp Clin Pharmacol, 2003, 25(7):531–5.
19. Wilson CG, Clarke CP et al. "Comparison of a novel fast-dissolving acetaminophen tablet formulation (FD-APAP) and standard acetaminophen tablets using gamma scintigraphy and pharmacokinetic studies." Drug Dev Ind
Pharm, 2011, 37(7):747–53.
20. Alves LDS, de La Roca Soares MF et al. "Solid dispersion of efavirenz in PVP K-30 by conventional solvent and kneading methods." Carbohydr Polym, 2014, 104:166–74. 21. Yadav PS, Kumar V et al. "Physicochemical
characterization and in vitro dissolution studies of solid dispersions of ketoprofen with PVP K30 and d-mannitol."
Saudi Pharm J, 2013, 21(1):77–84.
22. Elnahas OS, Badawi AA et al. Hot melt as a technique for
enhancement of drug performance. Cairo, 2013
23. Valizadeh H, Nokhodchi A et al. "Physicochemical characterization of solid dispersions of indomethacin with PEG 6000, Myrj 52, lactose, sorbitol, dextrin, and Eudragit E100." Drug Dev Ind Pharm, 2004, 30(3):303–17.
24. Yi E-J, Kim J-Y et al. "Preparation of sildenafil citrate microcapsules and in vitro/in vivo evaluation of taste masking efficiency." Int J Pharm, 2014, 466(1-2):286–95. 25. Akiladevi D, Basak S. "Dissolution enhancement of
Paracetamol by solid dispersion technique" J Pharm Res, 2010, 3(12):2846–9.
26. Eloy JO, Marchetti JM. "Solid dispersions containing ursolic acid in Poloxamer 407 and PEG 6000: A comparative study of fusion and solvent methods" Powder Technol, 2014, 253:98–106.
Using Spray Drying Technique." Iran J Basic Med Sci, 2013, 16(10):1100–8.
28. Qi S, Gryczke A et al. "Characterisation of solid dispersions of paracetamol and EUDRAGIT E prepared by hot-melt extrusion using thermal, microthermal and spectroscopic analysis." Int J Pharm, 2008, 354(1-2):158–67.
29. Verma R, Garg S. "Selection of excipients for extended release formulations of glipizide through drug–excipient compatibility testing" J Pharm Biomed Anal, 2005, 38:633– 44.
30. Lin D, Huang Y. "A thermal analysis method to predict the complete phase diagram of drug-polymer solid dispersions." Int J Pharm, 2010, 399(1-2):109–15.
31. Pikal MJ, Lukes AL et al. "Quantitative crystallinity determinations for β-lactam antibiotics by solution calorimetry: Correlations with stability" J Pharm Sci, 1978, 67(6):767–73.
32. Maniruzzaman M, Boateng JS et al. "Taste masking of paracetamol by hot-melt extrusion: an in vitro and in vivo evaluation." Eur J Pharm Biopharm, 2012, 80(2):433–42. 33. Klímová K, Leitner J. "DSC study and phase diagrams
calculation of binary systems of paracetamol" Thermochim Acta, 2012, 550:59–64.
34. Shahzad Y, Sohail S et al. "Development of solid dispersions of artemisinin for transdermal delivery." Int J
Pharm, 2013, 457(1):197–205.
35. Sethia S, Squillante E. "Solid dispersion of carbamazepine in PVP K30 by conventional solvent evaporation and supercritical methods." Int J Pharm, 2004, 272(1-2):1–10. 36. Kim E-J, Chun M-K et al. "Preparation of a solid dispersion
of felodipine using a solvent wetting method." Eur J Pharm
Biopharm, 2006, 64(2):200–5.
37. De Villiers MM, Wurster DE et al. "X-Ray powder diffraction determination of the relative amount of crystalline acetaminophen in solid dispersions with polyvinylpyrrolidone" Int J Pharm, 1998, 163(1-2):219–24. 38. Vijaya Kumar SG, Mishra DN. "Preparation,
characterization and in vitro dissolution studies of solid dispersion of meloxicam with PEG 6000." Yakugaku
Zasshi, 2006, 126(8):657–64.
39. Kumaresan G, Velraj R et al. "Thermal Analysis of D-mannitol for Use as Phase Change Material for Latent Heat Storage" J Appl Sci, 2011, 11(16):3044–8.
40. Tomassetti M, Catalani A et al. "Thermal analysis study of the interactions between acetaminophen and excipients in solid dosage forms and in some binary mixtures." J Pharm
Biomed Anal, 2005, 37(5):949–55.
41. Araújo AAS, Mercuri LP et al. "Thermal analysis of the antiretroviral zidovudine (AZT) and evaluation of the compatibility with excipients used in solid dosage forms" Int
J Pharm, 2003, 260(2):303–14.
42. Yu D-G, Branford-White C et al. "Dissolution improvement of electrospun nanofiber-based solid dispersions for acetaminophen." AAPS PharmSciTech, 2010, 11(2):809– 17.
43. Sekizaki H, Danjo K et al. "Solid-state interaction of ibuprofen with polyvinylpyrrolidone" Chem Pharm Bull, 1995, 43(6):988–93.
44. Miyazaki T, Yoshioka S et al. "Ability of polyvinylpyrrolidone and polyacrylic acid to inhibit the crystallization of amorphous acetaminophen." J Pharm Sci, 2004, 93(11):2710–7.
45. Sakata Y, Tanabe E et al. "Effects of solid-state reaction between paracetamol and cloperastine hydrochloride on the pharmaceutical properties of their preparations." Int J
Pharm, 2007, 335(1-2):12–9.
46. Khan S, Elshaer A et al. "Systems biology approach to study permeability of paracetamol and its solid dispersion"
Int J Pharm, 2011, 417(1-2):272–9.
47. Maulvi F a., Dalwadi SJ et al. "Improvement of dissolution rate of aceclofenac by solid dispersion technique" Powder
Technol, 2011, 207(1-3):47–54.
48. Rojas TPJ, González C et al. "Formulation of a modified release metformin.HCl matrix tablet: Influence of some hydrophilic polymers on release rate and in-vitro evaluation" Brazilian J Pharm Sci, 2011, 47(3):483–94. 49. Six K, Leuner C et al. "Thermal properties of hot-stage
extrudates of itraconazole and eudragit E100. Phase separation and polymorphism" J Therm Anal Calorim, 2002, 68:591–601.
50. Zajc N, Obreza A et al. "Physical properties and dissolution behaviour of nifedipine/mannitol solid dispersions prepared by hot melt method." Int J Pharm, 2005, 291(1-2):51–8. 51. Yang Z, Nollenberger K et al. "The effect of processing on
the surface physical stability of amorphous solid dispersions" Eur J Pharm Biopharm, 2014, 88(3):897–908. 52. Park J, Cho W et al. "Effect of operating parameters on
PVP/tadalafil solid dispersions prepared using supercritical anti-solvent process" J Supercrit Fluids, 2014, 90:126–33. 53. Sarode AL, Malekar S a et al. "Hydroxypropyl cellulose
stabilizes amorphous solid dispersions of the poorly water soluble drug felodipine." Carbohydr Polym, 2014, 112:512– 9.