A linear pattern on the sea floor and its interpretation
7
0
0
Full text
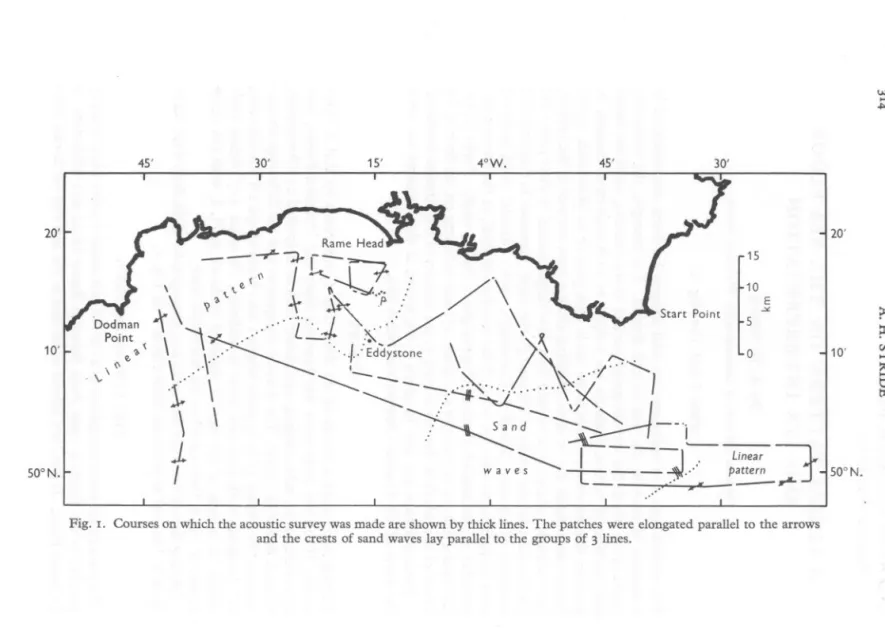
(2) w.... ~. 30'. 45'. 15'. 45'. 4°W.. 30'. 20'. 20' Rame. -. ~. I. --+-:)..I--~~. \.\!. I (\. 10'. Head. I. .\.. ~. \I. _. 15. r : ""p. E. -"'-. :'. I\. \. 0. 0--. Sand. WH". "---... -i:::: I --c=. __. .., ...... t:) tIl. \_.~_4. -----~: \. en :;d. )\~\, ~.,I \1-\- -----------.:...----~-~~--i •••. ~ 10'. o. i'\\~ "'".'.J.,,;/ \01 ..... ?>. S. \. LjEddY"O",. SOON.. 10. /"\. __. ~'---r __ •.... ••. Linear pattern _. rL J. ~. Fig. I. Courses on which the acoustic survey was made are shown by thick lines. The patches were elongated parallel to the arrows and the crests of sand waves lay parallel to the groups of 3 lines.. SOON..
(3) A LINEAR. PATTERN. ON THE. SEA FLOOR. Eddystone. The southern margin is gradational; the south-western limit has not yet been found. The floor is virtually devoid of relief except for the small regional depth gradient. The acoustic pattern consists of well defined, almost parallel patches of contrasting reverberation level, such as extend across PI. I. The low reverberation patches certainly range up to 1·8 kIn in length and between 50 and 200 m wide and about the same distance apart. In the middle of the region the patches are wider. Some patchiness is found farther south from here and may be present south of Start Point. Off the East Anglian coast the patches are locally well developed, certainly reaching 1'4 kIn in length, yet only 90 m in width. The boundaries are generally sharp, the ends are tapered. In each place the patches are elongated parallel to the path of the strongest tidal streams. For the Plymouth region the observed orientation of the patches is shown by the arrows in Fig. 1. The patches south of Start Point are orientated normal to the crests of sand waves occurring nearby, themselves an indicator of the direction of the streams (Chesterman et at., 1958). The sand waves are up to 3 m high and mostly between 100 and 250 m apart. They are smallest and least well developed at the margins of the patch. 10 250I3 LITHOLOGY Fine with shell and rock Fine sand with shell and rock Same as above on surface with trace of mud 204116 10 13 Coarse 'reddish gravel' shell and rock 03 TAKEN gravel 'gravel' ofLithology > shell of 2mm >ofshell and 12mm rock and >into debris rock 6mm 'gravel' with thickness fragments.0 25 (em) TABLE l.sand OF CORES NEARof coarse EDDYSTONE Coarse gravel of shell and rock percentage fractions Sand at top grading down debris fragments. Trace of coalsand with with about % gradational about sand. Boundary about debris2030 up %%tosand 2 em 20 diameter, gravel Cumulative weight A. 42 35. 12 10 48.
(4) A. H. STRIDE '. COMPOSITION OF THE FLOOR Between Eddystone and Plymouth grab sampling has revealed that the floor may be made of almost pure sand or sand with an appreciable fraction of coarser. material, greater than 2 mm in diameter (Holme, 1953). Five cores were taken by gravity corer in this patchy floor at the positions shown in Fig. I and are described in Table I (uppermost bed first in each case). The cores reached from 17 to 26 cm below the surface. The base of core I was red in colour, rather suggesting that bed rock was nearly reached, although Holme (1953) found more than 70 cm of superficial sediments nearby. A coarse gravel, consisting mainly of fragments of large shells with subordinate sand and rock debris, was found at the base of cores 1-4, while in core 5 there was a well-graded fine gravel. _Above the basal bed there was up to 16 cm of sand carrying as much as 25 % of particles between 2 and 14 mm in diameter. In cores 2 and 5 these sediments were capped by a thin layer of sand. The abundance of the coarse fractions in the surface layers is shown in Table I, although the figures are misleading as the particles are largely platey shell fragments. Three samples, taken by Van Veen grab, from similar patch floor near the East Anglian coast consisted of the following components:. 2. Sand (%) 10 60. 3. 70. Sample. I. Gravel and stones (%). 90. 40 30. The first sample showed that the floor was locally made of gravel and stones carrying polyzoa and hydroids. These were absent from the second sample so that the coarse fraction was probably covered by sand. In the third case the floor proved to be made largely of sand. DISCUSSION The acoustically patchy floor must be an expression of differences in composition since at both localities the floor was flat. The patches of low reverbation level should correspond to the patches of sand while the high reverberation level should be caused by the presence of coarser sediments. This correlation can be made with confidence for the East Anglian example because of the considerable difference in the grade of the sediments (Chesterman et al., 1958). There is good reason to believe that in the surface sediments of core I, of the Plymouth region, there is sufficient coarse, platey material to make the sediment readily distinguishable acoustically from the surface sands of cores 2.
(5) A LINEAR PATTERN ON THE SEA FLOOR. 317. and 5. The uppermost material of the remaining cores is probably representative of the high reverberation patches also. The larger area of acoustically patchy floor, which extends to the west of the region sampled, must be due to similar types of lithological contrast. The acoustic pattern is interpreted as representing patches of sand. lying on either pebbles or sand with up to 25 % shell fragments between 2 and 12 rom wide. The patches of sand are longer than broad. The ratio is largest off the east coast where the streams reach more than 2 knots. In both localities the streams are virtually linear, flowing to-and-fro parallel to the length of the patches. There is a difference of more than O' 1 knot between the ebb and flood streams so that the sand is probably being driven into the two localities. The growth of a similar but smaller pattern has been seen during sand storms in a desert by Bagnold (1954, p. 176) and in a flume (Casey, 1935) under an unidirectional stream. In a desert the parallel sand strips average km in length (replacing each other en echelon), are 1-3 m wide, 1-2 cm thick and are separated by 40-60 m of flat, pebble-covered ground. They appear to be initiated when a strong sand-laden wind blows over a uniformly rough surface (of pebbles, say) due to lateral instability of the flow, and grow so long as the drag over the sand exceeds that over the pebbles.. t. The author wishes to thank M. J. Tucker and A. R. Stubbs for designing their fish-detection equipment so as to make it suitable for surveying the sea floor. To these and to other colleagues the author is grateful for the help they gave in taking the records and for valuable discussion. Professor W. F. Whittard kindly made it possible to take the five cores and occupy the camera station during his cruise on R.V. 'Sarsia'. SUMMARY. An acoustic survey has been made of two regions where there is marked geographical variation in the nature of the surface sediments. It is shown that the patches are elongated parallel to the prevaIling path of the tidal streams and a mechanism of origin is suggested. REFERENCES BAGNOLD, R. A., 1954. The Physics of blown Sand and Desert Dunes. London: Methuen. CARTWRIGHT, D. & STRIDE, A. H., 1958. Large sand waves near the edge of the continental shelf. Nature, Land., Vol. 181, p. 41. CASEY, H. J., 1935. Uber Geschiebebewegung. Dissertation der Technischen Hochschule, Berlin. CHESTERMAN,W. D., CLYNICK, P. R., & STRIDE, A. H., 1958. An acoustic aid to sea bed survey. Acustica, Vol. 8, pp. 285-29°..
(6) 318. A. H. STRIDE. HOLME,N. A., 1953. The biomass of the bottom fauna in the English Channel off Plymouth. J. mar. bioi. Ass. U.K., Vol. 32. pp. 1-49. JARKE,J., 1956. Der Boden der stidlichen Nordsee. Dtsch. hydrogr. Z., Bd. 9, pp. 1-9. PRATJE,0., 1950. Die Bodenbedeckung des Englischen Kanals und die maximalen Gezeitenstromgeschwindigkeiten. Dtsch. hydrogr. Z., Bd. 3, pp. 201-205. ROBINSON,A. H. W., 1956. The submarine morphology of certain port approach channel systems. J. Inst. Navig., Vol. 9, pp. 20-46. STRIDE,A. H. & CARTWRIGHT, D., 1958. Sand transport at southern end of North Sea. Dock Harb. Author., Vol. 38, pp. 323-324. EXPLANATION OF PLATE I Plate I. An acoustic map of patches on the floor near Eddystone. Range abeam of ship of 800 yards is exaggerated x 7 distance scale. The light toned patches extending diagonally across the record are associatedwith patches of sand..
(7) J.. MAR. BIOL.. Ass. U.K., 38. STRIDE.. (2). PLATE I. IJ345/29 . 4 . sa/c. 135°. '". .,. o. I 800. 600. 400. o. 200. Range abeam (yards) Secondary. Main beam. <. beams. ,.. (Pacing p. 318).
(8)
Figure

Related documents
Overvoltage category 6 P Packaging 10 Pause time 37,51 Position indicator 33 Position transmitter RWG 15,30 Positioner 37 Potentiometer 29 Power supply 6 Protection tube 13
T his mixed-method study examined the impact that international community service experiences have had on college students’ academic learning, cultural understanding, global
• This means that palm oil stocks will start rising again from July, which will put downward pressure on the premium for CPO prices over Brent crude oil prices. Monthly CPO
International agreements need to help states with good quality institutions of governance focus on developing transparency initiatives, accountability drives and
Ang mga mag-aaral sa kanilang sariling kakayahan ay nakapagpaplano ng symposium na tumatalakay sa kaugnayan ng karapatang pantao at pagtugon sa responsibilidad bilang mamamayan
A hybrid approach integrating OWA (Ordered Weighted Averaging) aggregation into TOPSIS (technique for order performance by similarity to ideal solution) is proposed to tackle
Guide Controllers/Drivers Softwares Stepping Motor AC Servo Motor Piezo X Translation Theta Rotation Goniometer Vacuum Options □ 40mm □ 60mm □ 80mm □ 85mm □ 100mm □ 120mm
Contents 1 Atlantico 2 Tudor 3 Tudor Carved 4 Tudor Slimline 5 Rimini 6 Elizabeth Royal & Elizabeth 7 Lisboa 8 Sintra 9 Cromwell 10 Amadora 11 Salerno 12 Mafra 13 Faro 14
