An Effective Meta-Heuristic Cuckoo Search Algorithm for Test Suite
Optimization
Manju Khari
Department of Computer Engineering,
Ambedkar Institute Of Advanced Communication Technologies and Research, Delhi, India E-mail: [email protected]
Prabhat Kumar
Department of Computer Engineering,
National Institute of Technology Patna, Bihar, India E-mail: [email protected]
Keywords:optimization, nature inspired algorithm, cuckoo search, test suite, test data
Received:March 12, 2016
Automation testing is the process of generating test data without any human interventions. In recent times, nature-inspired solutions are planned, tested and validated successfully in many areas for the purpose of optimization. One such meta heuristic technique is Cuckoo Algorithm (CA) that receives its sole inspi-ration from the behavior of cuckoo, who has the ability to resolve complex issues using simple initial conditions and limited knowledge of the search space. This paper presents a cost effective and time effi-cient algorithm inspired from cuckoo for optimizing the test data. On comparing the proposed algorithm with existing Firefly Algorithm (FA) and Hill Climbing (HC) algorithms, it was found that CA outperforms both FA and HC in terms of the test data optimization process. The work done in the current study would be helpful to testers in generating optimized test data which would result in saving of both testing cost and time.
Povzetek: V prispevku je razvita izpopolnjena meta-hevristiˇcna metoda kukaviˇcjega algoritma (Cockoo algorithm), ki temelji na reševanju zapletenih problemov z reševanjem veˇc lokalnih preprostih.
1
Introduction
Software testing is done with the intention of finding bugs and enhancing the quality before delivering it to the client [1]. As testing is very tedious and time consuming, it is highly desirable that this cost be controlled as much as pos-sible [2]. One way to control this cost is to reduce the data which is used for testing. Test data optimization is a pro-cess of reducing the test data sets and it can be sucpro-cessfully applied to black box as well as white box testing [3].
Optimization mainly focuses on reducing the number of available solutions depending upon certain parameters. Merely reducing the number of test data does not accom-plish the purpose of software testing. The test data should effectively uncover all potential lapses that exist in the soft-ware or product. For carrying out test data optimization, mathematical functions are applied that can effectively fil-ter out the required test data. The methods of finding the optimal solutions among the various available options can be regarded as the optimization problem [20]. This prob-lem aims at maximizing or minimizing a real value function from the allowed set of solutions.
With the help of optimization, we can filter out the fittest test data that can easily test various properties related to
a software or product. Generally, test data optimization is carried out with the help of various meta-heuristic algo-rithms. They offer better solutions in comparison to the traditional algorithm which finds a solution based on hit and trial method. These algorithms have two components, exploration (intensification) and exploitation (diversifica-tion). Exploration means to search solution at a global scale while exploitation aims at finding a good solution in a lo-cal region. The combination of these two ensures a global optimal solution which is achievable.
The rest of the paper is organized as follows: Section 2 describes the related work that has been done with context to CA, Section 3 discusses various concepts related to test data optimization, Section 4 explains the proposed method-ology, Section 5 describes that has been collected for show-ing that proposed methodology outperformed FA and HC, Section 6 provides a detailed case study of the proposal along with the statistics applied to JAVA programs for all three algorithms, Section 7 describes the potential threats and precautions that need to be taken while implementing this algorithm and finally, Section 8 concludes the study with a discussion of the future scope.
2
Related work
Developments in the field of ’automated test data genera-tion’ were initiated in the early 70’s. Articles like ’Test-ing large software with automated software evaluation sys-tems’ by Ramamoorthy et al., in the year 1975 [4] and ’Au-tomatic generation of floating-point test data’ by Miller et al., in the year 1976 [5], are a few examples of the early work in this field. Nevertheless, Clarke’s examines [6] of the year 1976 is considered to be the first of its kind to pro-pose an algorithm for automated test data generation which is written in FORTRAN. The automated test-data genera-tors can be divided into three classes - random, static and dynamic. Random test data generation is easy to automate, but problematic [7][9]. Firstly, it produces a sample of the possible paths through the software under test (SUT). Sec-ondly, it may be expensive to generate the expected output data for a large amount of input data produced. Finally, provided exceptions occur only rarely, the input domain which causes an exception is likely to be small. Random test-data generators may never hit on this small area of the input domain.
During 70’s up to mid-80’s, people did research on test data generation using symbolic execution. Researchers have been working on test data generation since 1975, but unfortunately, there is hardly any fully automated test data generation working tool available in the current software industry. At that time the language used for test data gen-eration was FORTRAN. In the year 1987, Parther [7] pro-posed a new idea for test data generation called path prefix method. In the year 1990, Korel [8] provided a revolu-tionary change by generating test data dynamically based on actual value using pattern and explanatory search. In the year 1996, Ferguson [9] examined an assertion oriented and chaining approach i.e. goal-oriented test data genera-tion [10]. Test data generagenera-tion from dynamic data structure [5] has encouraged many authors to work on hybrid test-ing methods for detecttest-ing infeasible paths, thereby savtest-ing computational time. Mutation testing technique is used to improve the reliability of object-oriented software, authors understand the traditional mutation testing method and ap-ply on object-oriented programs that are known as class mutation [12]. Xiao et al. [13] proposed a technique for
test data generation even if more or less path predicate is unsolvable. However, the proposed method could not pro-vide a good coverage.
A better way can be the combination of evolutionary methods with dynamic symbolic execution [15][18], which would wipe away the disadvantages of both the approaches. Search-based methods have previously been applied for testing object-oriented software by making use of method sequences [19][20] or by the help of strongly typed genetic programming [21][22]. While creating test data for object-oriented software, since the early work of Tonella [23], the authors experimented on issues of handling the techniques that can be used to reverse engineer several design views from the source code. These techniques aim at generat-ing test suites to achieve high quality test data usgenerat-ing mu-tation testing [16][46][47][48] deployed in a search-based test generation environment. Lakhotia et al. [24] estab-lished a search based multi-objective approach in which a random search, Pareto GA and weighted GA algorithm is used for branch coverage. Various algorithms were also proposed to optimize and prioritize the test suite. Evolu-tionary algorithms (like CA) were among them. Amir et al. used cuckoo search for solving structural optimization tasks. It has been used in non-linear constrained optimiza-tion problems [44].
In the year 2010, Yang et al. [25] examined CA to re-solve the issue of engineering design optimization. The results that were obtained proved to be better than particle swarm optimizer. In the year 2011, Rajabioun [26] ana-lyzed CA to solve nonlinear optimization issues which are used to solve difficult problems. Chandrasekaran et al. in the year 2011 [27], substantiated a hybrid CA integrated with fuzzy logic for solving multi-objective unit commit-ment problems. Yildiz [28] used this algorithm select op-timal machining parameters for mining operations in the year 2013. Valian et al. [29] verified CA to the forward network for two classification problems.
the literature work.
The above studies show that CA has been applied for finding optimal solutions to various problems. It has been used in various applications from mining to finding routes. However, it has not been used for generating test data which can be used in testing the software products thereby reducing the efforts of the testers and developers. We pro-pose an approach to generate test data that is optimal for performing testing in software development life cycle by using the CA.
3
Key research concepts
The concepts involved in developing the proposed algo-rithm along have been described in this section. This sec-tion discusses the concepts of nature inspired CA, FA, HC, and the objective function.
3.1
Cuckoo biological algorithm
It is an optimization algorithm developed by Yang et al. in the year 2009. Cuckoos are by and large known for their sweet voices, yet they have a forceful proliferation method. They lay their eggs in the nest of other host birds. If the host bird discovers that the eggs are alien then the host bird shall either discard them or abandon the nest. CA has been applied to various optimization problems. It is a nature in-spired meta-heuristic algorithm which supports the theory of ’survival of the fittest’[38][41]. A number of algorithms work by beginning with an essential result and progres-sively adding more and more data that prompts creation of the best result from the pool of results. On the other hand, a few algorithms begin with a pool of results and come down to the best result, via disposing of the most exceedingly bad results from the pool, by thinking about among the re-sults. CA falls into the second category of algorithms. The biological algorithms have been discussed in [39].
Each egg in a nest represents a solution and cuckoo egg represents a new solution. The algorithm aims at using the new and better solutions to replace the less good solutions. It is based on three idealized rules which are given as:
1. Cuckoo chooses one egg at a time which has to be dumped into a randomly chosen nest.
2. The nests containing high quality of eggs has to be carried forward to the next generation.
3. Available host nests is of fixed quota and laid eggs are discovered with the probability of (0, 1).
CA consists of two search capabilities: local search and global search which is controlled by discovery probability. In relation to testing, using CA, we can represent the eggs present in nest, as test data giving a solution. CA will re-place high quality with the low-quality eggs already present in the nest. It increases the potential of getting good quality test data for the SUT.
The advantage of using CA is that it uses only a single parameter for optimization, unlike other algorithms which makes it easier to implement and since it consists of local search and a global search, it tends to give global optimal solution to the problem under test or SUT.
3.2
Firefly algorithm
This algorithm is inspired by the nature of fireflies. It is based on the collective behavior of fireflies. Fireflies are known for their flashing behavior. The variation of the light intensity and the formulation of attractiveness are the two major factors affecting the behavior of the fireflies. They use their flashlights to attract other fireflies. The algorithm was developed by Yang in the year 2008.The main purpose of flashing lights is to attract mating partners and warn off potential predators [26][27].
The FA algorithm is based on the idealized rules. First, all the fireflies are unisexual and the attraction between is irrespective of gender. Attraction is based on the bright-ness of fireflies such that low brightbright-ness firefly will move towards high brightness firefly. Since light intensity tends to decrease with the increase in distance between fireflies; hence, the attractiveness is inversely proportional to the dis-tance between the fireflies. Brightness and intensity of the fireflies are determined using the objective function.
3.3
Hill climbing algorithm
This algorithm aims at finding superior results in an incre-mental way. It transforms its state by software under test and if the change delivers a superior result then the addi-tion is carried out for performing the further evaluaaddi-tion. It aims at finding local optimal solutions, thereby achieving a result that is globally optimal. It is an iterative algorithm that starts with a random solution to the problem with the aim of finding out a better solution. The solution is changed if an improvement is found. This process continues until no further improvement can be made in the solution. It is used widely where you want to reach goal state from starting node. It also aims at maximizing or minimizing the tar-get function [40]. Many variants of HC are available like steepest ascent HC, stochastic HC, random restart HC [20]. HC starts with the process of assigning the random co-ordinates to each test data. Then, first test data is taken as input and its neighbors are discovered. The objective func-tion values are compared to the neighbors and the selected test data and best one is chosen as optimal test data. This process is iterated for every original test data. Finally, the optimized test data is produced by HC for the given SUT.
3.4
Objective function
Year Author Key points
1975 Ramamoorthy et al. [4]
•The paper explores the main features of automated software tools and various software evaluation system, which were available.
•Automated software tools were chosen because it has been found to be valuable to improve the reliability of a software.
1976 Miller et al. [5] •Two examples i.e. a matrix factorization subroutine and a sorting method are used to describe the types of data generation problems. They are used instead of symbolic execution to generate test data.
•The programs with floating-point data are used for large savings of time and storage are made possible. 1976 Clarke [6] •The system proposed to generate test data for programs written in ANSI Fortran.
•System symbolically executes the path and creates a set of constraints on the program’s input variables.
•It uses linear programming when the set of constraints are linear.
1987 Prather et al. [7] •The novel technique i.e. "adaptive" is analysed for selection of subsequent paths and offers considerable advantages over existing strategies in its computational requirements.
•Method ensures branch coverage and offers a considerable advantage in its computational requirements.
1990 Korel [8] •The approach for generating test data is extended to programs with dynamic data structures and a search based method on dynamic data-flow analysis, along with backtracking is presented.
•In the approach, values of array indexes and pointers are used.
1996 Ferguson et al. [9] •The chaining approach for automated software test data generation, which is based on the theory of execution-oriented test data genera-tion and also used for the search process.
•The approach used significantly improves the test data generation compared to the existing methods.
1996 Korel et al. [10] •The assertions are used to generate test data and is considered a tool for automatic runtime detection of software errors.
•The assertion is violated reducing to the problem of finding program input on which a selected statement is executed. It is done with the help of white box testing.
2000 Frohlich et al. [11] •Authors experiments, how test suites with a given coverage level can be automatically generated from state chart diagrams.
•It is done by mapping the state chart elements to the STRIPS planning language.
2000 Kim et al. [12] •The authors examine the Class Mutation technique that assesses the quality of test data distinguish between mutated programs from the original program.
•It is complimented with the help of the results of the case study, which were tested to investigate the applicability of the technique. 2001 Ernst et al. [15] Authors explore three results
•Describes techniques for dynamically discovering invariants.
•Reports on the Daikin’s application to two sets of the program.
•Analyzes scalability issues.
2004 McMinn [20] •The authors reviewed Meta-heuristic search techniques are high-level frameworks.
•It uses heuristics to seek solutions for combinatorial problems at a reasonable computational cost.
2005 Tonella [23] •This proceeding describes some of the most advanced techniques that can be employed to reverse engineer several design views from the source code.
2006 Wappler et al. [21] •The authors investigate a tree-based representation of method call sequences that search for numeric test data.
•It automatically generates test programs that represent object-oriented unit test data.
2007 Xiao et al. [13] •The paper experiments various automated test generation techniques but chooses goal oriented approach.
•The goal-oriented approach as a promising approach to devising automated test-data generators using optimization techniques. 2007 Harman [14] •Authors examine optimization techniques on seven application of software engineering.
•Optimization techniques evolved from the operational research and metaheuristic research. 2008 Sofokleous et al. [18] •Authors prove dynamic test data generation framework based on genetic algorithms.
•They are the Batch-Optimistic and the Close-Up that provide an optimum set of test data with respect to the condition coverage criterion. 2010 Papadakis et al. [16] •Authors compares an approach conjoins program transformation and dynamic symbolic execution techniques in order to automate
successfully the test generation process.
2010 Yang et al. [25] •Authors provide extensive comparison study using some standard test functions and newly designed stochastic test functions.
•Examines CA to solve engineering design optimization problems.
2011 Fraser et al. [17] •EVOSUITE is critiqued, a search-based approach that optimizes test suites for satisfying distinct coverage goals.
•It achieves up to 18 times the coverage of a traditional approach.
2011 Rajabioun [26] •Authors observe CA which is suitable for continuous nonlinear optimization problems.
2011 Valian [29] •Authors interpret an algorithm which is employed for training feedforward neural networks for two benchmark classification problems. 2012 Walton et al. [27] •New modified CA robust algorithm has been analysed, modification of CA involves the addition of information exchange between the
best solutions.
2012 Prakash et al. [35] •CA examines an Optimal Job Scheduling in Grid computational resource allocation and Resource Discovery.
2013 Gandomi et al. [44] •The CA proves for solving structural optimization tasks with Leivy flights is first verified using a nonlinear constrained optimization problem and also validation against structural engineering optimization problem.
2013 Civicioglu et al. [30] •The numerical optimization problem-solving successes of the proposed CA has been compared statistically over 50 different benchmark functions.
2013 Yildiz et al. [28] •Authors examine a hybrid optimization approach based on differential evolution algorithm and also having receptor editing property of the immune system.
2013 Gandomi et al. [31] •Authors examine CA to solve truss optimization problems.
•It also adds unique search features used in the proposed CA.
2013 Bulatovic et al. [32] •CA scrutinizes the procedure of optimum synthesis of mechanism parameters.
•The paper also highlights the dimensional synthesis of a six-bar linkage with turning kinematic pairs.
2014 Sur et al. [33] •Modified CA analyzes for discrete problem domain like that of the graph based problem and other combinatorial optimization problems. 2014 Swain et al. [34] •The authors verify CA for noise removal from a signal.
•It uses trained network to remove noise from sine signal, which was contaminated, with white Gaussian noise.
2014 Bhandaria et al. [37] •Authors examine on image segmentation is to extract meaningful objects by CA and wind driven optimization using entropy. 2015 Ahmed et al. [43] •CA maintains to construct optimized combinatorial sets.
•The strategy consists of different algorithms for construction.
2016 Wang et al. [36] •In robust CS, the pitch adjustment operation in harmony search (HS) that can be considered as a mutation operator is added to the process of the cuckoo updating to speed up convergence.
•It is used for enhancing the capability of CS.
2016 Elazim et al. [45] •CS verifies for optimal Power System Stabilizers (PSSs) design in a multi-machine power system.
•The design problem of PSS is formulated as an optimization problem.
function [42].The objective function is used to describe the closeness of a given design solution to achieving its aims in terms of numerical value. It works as a single figure of merit for determining the quality of the test data which can be compared to the objective function value of other test data. By this, we can compare the results and choose the better quality test data, hence optimal test data.
In this paper, we have considered the Sphere objective function [43]. The two major types of objective functions are:
– For Multi-Objective Optimization Problems: Some problems have multiple criteria to fulfill a particular objective[42]. They are: “Chakong and Haimes Func-tion, Binh and Korn FuncFunc-tion, Fonseca and Fleming Function, Test Function, Kursave Function, Schaffer Function N.1, Poloni’s Two Objective Function”.
– For Single Objective Optimization Problems: Some problems have single criteria to fulfill a particular ob-jective hence it is not guaranteed that there may exist a single solution that will satisfy a particular objective [42]. They are: “Levi Function, Rosenbrock tion, Booth Function, Beale Function, Sphere Func-tion, Three Hump Camel FuncFunc-tion, Goldstein Price Function, and Cross in Tray Function”.
4
Proposed algorithm
This section explains the proposed methodology that has been applied for optimizing test data. The technique is based upon the natural behavior of cuckoo for producing optimized test data that can be used for carrying out soft-ware testing efficiently thereby, reducing the cost of the product. The proposed technique uses the concept of ex-ploration and exploitation for carrying out test data analysis and finding out the result which is optimal in nature.
The approach devised is mainly applicable to path test-ing. It ensures that proper path and code coverage is achieved with the help of optimized test data. Initially, am-ple amount of test data for the program or software under test is generated. These initial test data are analogous to the eggs which are laid by cuckoo. The paths on which testing needs to be performed are equivalent to the nests where the fitness of the eggs needs to be judged. Just as a cuckoo searches for a random nest for disposing of its eggs, in the same way, a test data is picked up randomly which is dis-posed of in a random path. The host bird can discard the egg or the path itself depending upon the conditions. Simi-larly, the chosen test data is validated with the chosen path. If they are found to be compatible then the test data is kept in that path else it is kept in another path named buffer.
In simple words, a test data and a path are chosen at ran-dom. If the chosen test data belongs to that path then the test data is kept there itself, else it is kept in another path called buffer. Initially, each test data undergoes this pro-cess unless the initial list of test data becomes empty. Once
this initial list of test data becomes empty, we consider an-other list called buffer. This is an extra path or nest which keeps those test data for which a compatible path was not found in first go. Before further picking of nests and eggs, the test data with a minimum value of objective function is discarded from each path. For further evaluations, random picking of test data is done from the buffer list and not from the initial list. A test data is picked up randomly along with a path. If the test data belongs to that path then that test data is kept in that path only, else it remains in the buffer. This process continues until the buffer list becomes empty. Every time when a match is found, the objective function is applied to the available test data. The test data with a minimum value of the objective function is discarded ev-ery time. At the end, when the list empties, the optimized test data belonging to a particular path are obtained. There might be a case that a path might be discarded which means that no test data might be available for evaluation purpose. In such data, the path becomes obsolete and it becomes in-eligible for performing testing.
Depending upon the type of test data, different values are fed into the objective function for reaching optimized results for a particular path. If the test data is of a numeri-cal type, then the values are directly fed into the objective function for carrying out analysis and finding the value. For string type of test data, the value that is fed into the objec-tive function is the average of the ASCII values of individ-ual characters. Characters can be alphabetical or special characters. For example, let the test data which has been given for evaluation be ’mam’ then the value that we will be opting for putting into objective function can evaluated as mentioned in equation 1
m=109 (ASCII value of m), a=97 (ASCII value of a)
mam= (109 + 97 + 109)/3 = 105. (1)
Pseudo code of CA
Declaration
initlist:initial list.
buff:buffer or temporary list.
Input:Program under test.
Output:Optimize test data.
1. Initialize test data for the whole program in a path or nest in a list calledinitlist.
2. Separate paths or nests for the program.
3. Initialize objective function.
4. While (initlist!=empty )
(a) Pick a random test data or egg
(b) Pick a random path or nest
i. If ( the chosen test data belong to the chosen path ) A. Keep it in the path or nest
B. Remove it from the initlist or path ii. Else
A. Keep it in a list or nest call buff B. Remove it from the initlist iii. End if
5. End while
6. For each path or nest
(a) Find objective function for each test data using formula in equation 1
(b) Find out test data or egg with minimum value of objective function and remove it
7. End for
8. While (buff!=empty )
(a) Select a test data or egg randomly
(b) Select a path or nest randomly
i. If ( test data or egg belong to that path or nest ) A. Keep it in that path or nest
B. Remove it from buff list or nest ii. Else
A. Put it back in the buff list or nest iii. End if
(c) Calculate value of the objective function for each test or egg data for the path or nest opted.
(d) Remove the test data or egg with a minimum value of the objective function from the path or nest.
9. End while
10. Optimized test data or eggs for each path or nest.
5
Data collection
Evaluating the performance of any technique requires se-lecting certain subject programs which form the basis for evaluation. To evaluate the performance of our proposed algorithm and to compare it with other algorithms, we have selected fifty real time programs written in Java language. The subject programs were chosen for test data generation and optimization activity has been discussed in the follow-ing subsection. The size of programs ranges from 30 to 250 lines of source code. A diversified range of programs were chosen including mathematical problems such as finding roots of quadratic equation, triangle classification problem,
computing the median of the triangle; general logical prob-lems such as checking for the Armstrong number, magic number, palindrome number; Pythagorean triplet, convert a number to hexadecimal, octal or binary. All these pro-grams are written in standard Java language that makes it easier to work with.
To discuss the advantage of our algorithm over other techniques, we have developed an analytical framework. This framework evaluates our algorithm and compares it with other algorithms on the basis of four parameters: op-timized test data, iteration, duration, and complexity.
5.1
List of programs
Table 2 lists the JAVA programs used for the analysis of the algorithms.
Program Description P1. Find greatest of three given numbers. P2. Find if a number is even or odd. P3. Find if a number is positive or negative. P4. Find if a year is a leap or not.
P5. Find if a number is multiple of 2,3,5,7 or not. P6. Find smallest of three numbers.
P7. Find the area of figures depending upon choice entered by the user.
P8. Find if a number id perfect square or not. P9. Find if a number is in powers of two or not. P10. Check if the number entered is palindrome or not. P11. Find if a number is Armstrong number or not. P12. Find if a number is perfect or not.
P13. Find if a number is a magic number or not. P14. Find if a number is prime or not.
P15. Find the type of character entered by the user (character, spe-cial character, number).
P16. Find if a string entered is palindrome or not.
P17. Perform a calculation on the entered numbers depending upon the choice.
P18. Find if a triangle is a scalene, equilateral or isosceles. P19. Find if the given three numbers entered from a Pythagorean
triplet or not.
P20. Find if the number entered is a single digit number or not. P21. Calculate bonus depending upon the number of extra days
entered by the user.
P22. Find the quadrant of the points entered by the user. P23. Find types of roots entered by the user. P24. Implement linear search.
P25. Implement a binary search
P26. Convert a number to binary, hexadecimal or octal entered by the user.
P27. Find greatest common divisor of the entered two numbers. P28. Find least common multiple of entered two numbers. P29. Find if the number entered is strong or not.
P30. Calculate bill depending upon the units entered by the user. P31. Find if a triangle is right-angled or not.
P32. Find the volume of the given figure. P33. Find the total surface area of a given figure. P34. Find the total surface area of a given figure.
P35. Convert the temperature from Celsius to Fahrenheit, Kelvin to Celsius and vice-versa.
P36. Find S.T.D codes or states depending upon the value entered by the user.
P37. To allot section to a student depending upon the marks ob-tained.
P38. Calculate profit or loss.
P39. Find details of any element depending upon the element en-tered by the user.
P40. Find if the string entered by the user starts with a vowel or not.
P41. Find the strength of a password.
P42. Find the sum of three numbers entered by the user.
Continued from previous page
Program Description P43. Interconvert currencies.
P44. Calculate B.M.I after entering height and weight. P45. Convert interconvert seconds, minutes and hours. P46. Calculate simple interest.
P47. Calculate compound interest. P48. Calculate factors of given number.
P49. Determine if the given series are in A.P or G.P. P50. Find the capital of a given state or vice versa.
Table 2: List of JAVA program used as a program under test
5.2
Metrics for evaluation
The following metrics were considered for the evaluation and comparison of the proposed work with the existing FA and HC algorithms:
1. Number of Optimized Test data: This is the main fo-cus of this research paper as the proposed algorithm aims at reducing the number of test data for any given path of any particular program. FA, HC and pro-posed algorithm using CA were implemented on the programs and it was observed that good results were given by proposed algorithm. The number of opti-mized test data was counted by embedding a counter in the source code of each program. For each opti-mized test data optCount (OC) can be defined as in equation 2:
OC=OC+ 1 (2)
2. Iterations: Number of iterations while applying the algorithm and finding out test data was calculated for FA, HC and proposed CA. A counter for counting a number of lines of execution was embedded in each program for all three algorithms. After the execution of each program under test, the counter was incre-mented for finding out a number of lines of execution. For each optimized test dataiterations Count(IC) can
be defined as in equation 3:
IC=IC+ 1 (3)
3. Duration:This metric refers to the execution time of the program. The code for calculating the time of ex-ecution was embedded in every program. Initial time
(IT) andfinal time(FT) after completion were noted
and the two were subtracted for finding out the time period of execution. Therefore, Time of execution/ Duration(ET) can be represented in equation 4:
ET =FT−IT (4)
4. Cyclomatic Complexity:The complexity of the codes were calculated using a plugin of Eclipse IDE tool, Metrics. It takes the programs for which the complex-ity has to be generated as the input. It was found that CA gave better results as compared to FA and HC.
McCabe Cyclomatic Complexity (CMC) where,
num-ber of edges (E) in control flow graph and numnum-ber of nodes (N) as in equation 5:
CM C =E−N+ 2 (5)
6
Analytical evaluation and
comparison
6.1
Case study
In this section, we consider a case study of calculating bonus of an employee depending upon the number of days he has worked extra. The detailed results are generated after evaluating a particular case study with the help of CA. The example shows how CA can be employed to find out optimized test data. The case study has three paths; one in which the number of days is in between 1-5, second in which the number of days is in between 6-10, and the third path in which the number of days is in between 11-15. The following sections show the detailed view of each and every iteration involved while evaluat-ing the case study. The initial list (initlist ) of test data is given as 1,2,3,4,5,6,7,8,9,10,11,12,13,14,15,16. There are three paths in the program that are named asPath 1, Path 2, and Path 3.The test data in terms of path are given as: Path 1 = 1,2,3,4,5,6 ; Path 2 = 7,8,9,10 ; Path 3 = 11,12,13,14,15,16.
Now in the first iteration, the cuckoo bird picks up a test data and a particular nest which is termed as a path. The lists of the three paths are given as one, two and three. If both of them are compatible then the chosen test data is put into that path else it is kept in a nest called buff (buffer/ temporary list) which does not discard them completely. The first iteration result is shown in the following Table 3, which gives the chosen test data, chosen path and the path to which the test data has been added.
Table 4 shows the lists after the first iteration along with the objective function value.
After the first iteration, the test data / eggs with a min-imum value of objective functions are removed from the lists. The modified lists are mentioned in table 5.
Now the test data are again picked randomly from the buff list and again a random path is chosen. If both are compatible then the test data is added to the list of the cor-responding path else it is kept in the buff list. This process continues until the buff list becomes empty. Every time the nest and the egg are compatible then the egg with the least value of the objective function will be removed from the nest or path. The egg was chosen, the nest was chosen, sta-tus if it has been added or not in the list, and value removed from the list has been shown in the following table 6.
Chosen egg/test data
Chosen path/nest
Nest to which the egg/test data has been added
8 Two Two
11 One Buff
3 Three Buff
2 One One
4 Two Buff
13 Three Three
15 One Buff
5 One One
6 Two Buff
16 Three Three
12 One Buff
14 One Buff
9 One Buff
1 Two Buff
7 Two Two
10 Two Two
Table 3: Results after Iteration 1 of CA
data, Iteration and Complexity results obtained after apply-ing FA, HC, and CA on the case study mentioned in section 6.
6.2
Results for 50 programs
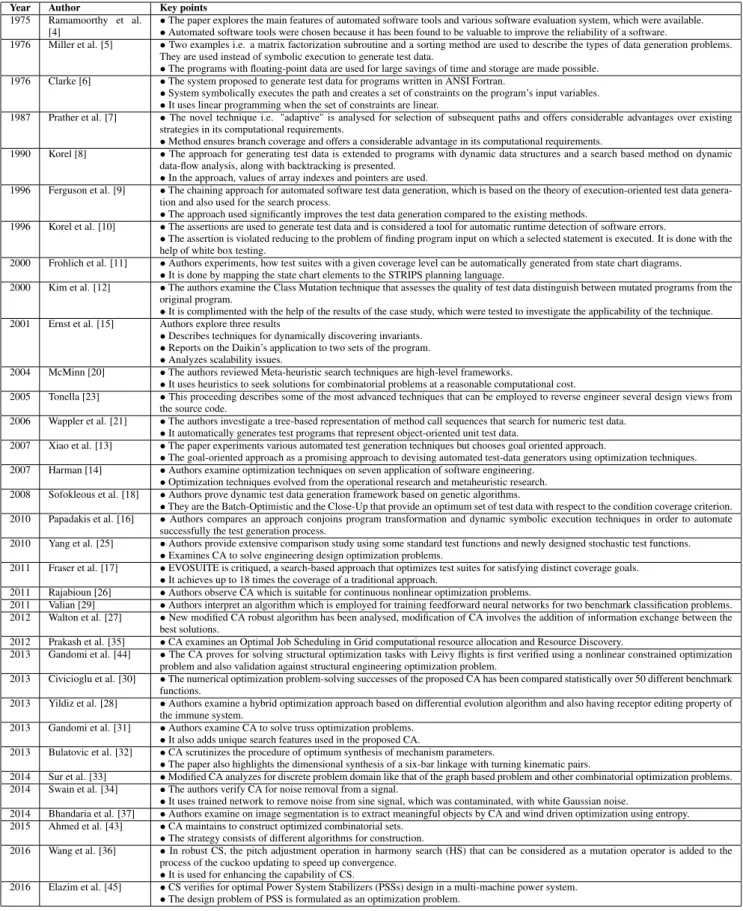
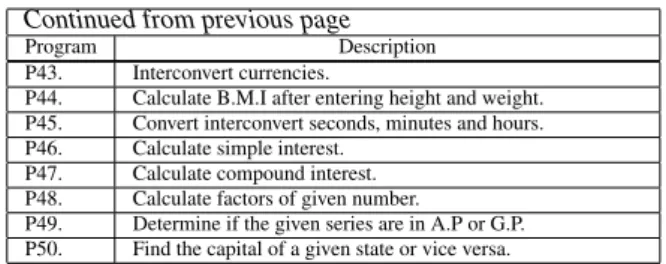
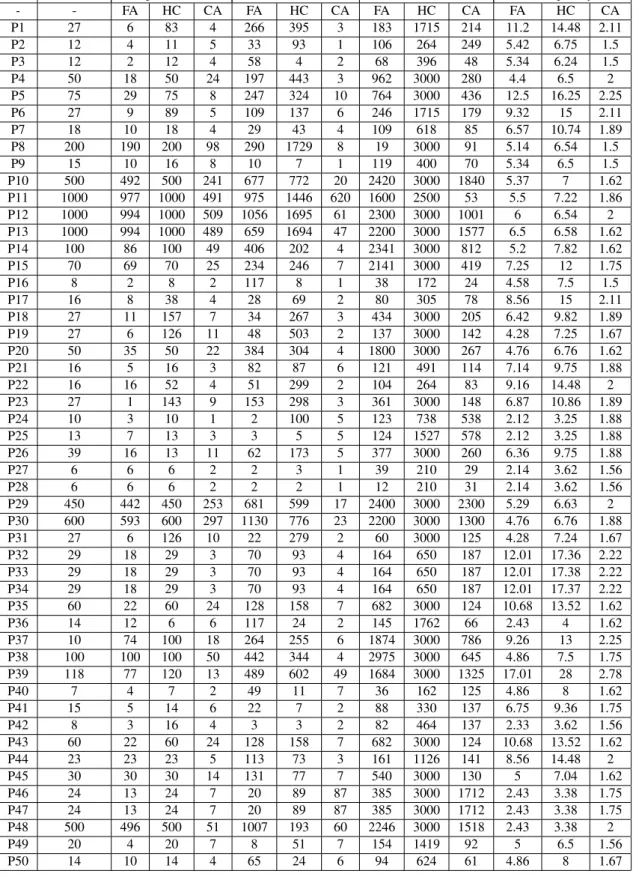
Table 7 shows comparative results for JAVA programs after applying FA, HC, and CA on them. The results for various parameters have been depicted in Table 8. The obtained results show that CA achieves best results in terms of optimized test data, duration, iteration, and complexity. Fig1 -Fig4 provides graphical comparisons of the algorithms us-ing the aforementioned metrics.
Figure 1 shows the number of optimized test data using FA, HC, and CA along with the total number of test data. In this figure line plots the number of optimized test data and a number of programs showing the maximum optimized result of CA. The square line represents test data using FA, triangle line shows the number of optimized test data using HC, cross line represent a number of test data using CA and the total number of test data are represented by diamond lines.
Through statically analysis, we can check whether the performance of all the algorithms is similar or not. As the theory of ANOVA states that for the larger value of com-puted value of F proves its better capability. To fulfill this objective ANOVA two-factor without replication for that we have to set null hypothesis, which states: H0: There is
not a significant difference between the various programs among different algorithms. To check the significance of the algorithms, authors are using ANOVA for optimization of test suite. In Table 9, 10, 11 and 12 Rows are Numbers of programs and Columns indicated all algorithms. The result
Figure 1: The comparison of FA, HC, and CA on number of optimized test data
is shown in Table 9.
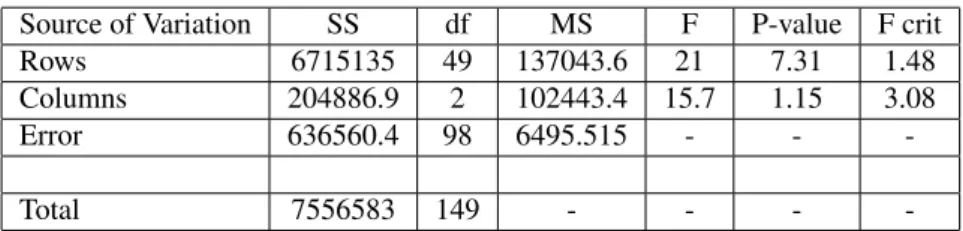
Since the computed values of F test statistic (21) is greater than that of critical value (1.48) in terms of number of programs and in terms of algorithms computed values of F test statistic (15.7) is greater than that of critical value (3) at 5 % level of significance, H0is not accepted and hence
the result of optimized test suite differs significantly. Similarly, other performance parameters like execution time and H0rejected their respective null hypothesis at 5%
level of significance. For execution time the computed val-ues of F test statistics (3.14) is greater than that of critical value (1.48) for number of programs and for different algo-rithms computed values of F test statistics (18.5) is greater than that of critical value (3) at 5% level of significance, so H0cannot accept and hence the duration of execution time
of the test suite differs significantly. Table 10 shows the result.
Figure 2 line plots show the comparison between FA, HC, and CA based on the time taken by the respective algo-rithms to optimize the test suite of the JAVA programs. The diamond line represents time taken by FA and the square line shows time taken by HC and triangle line plots in their presentation of CA.
Figure 2: The comparison of FA, HC, and CA on duration of test data
List one
Objective Function value
List two
Objective function value
List three
Objective function value
Buff
2 4 8 64 13 169 11
5 25 7 49 16 256 3
- - 10 100 - - 4
- - - 15
- - - 6
- - - 12
- - - 14
- - - 9
- - - 1
Table 4: lists which include objective function
List one List two List three
5 8 16
- 10
-Table 5: Updated lists after removing minimum value ob-jective function test data.
Test Data
Path Status Value
re-moved
9 One Not compatible
-4 Three Not compatible
-12 Three Compatible 12
9 Two Compatible 8
6 Two Not compatible
-3 Three Not compatible
-15 One Not compatible
-3 Two Not compatible
-6 Three Not compatible
-4 Two Not compatible
-14 Two Not compatible
-15 Two Not compatible
-15 Three Compatible 15
6 Three Not compatible
-11 Three Compatible 11
6 One Compatible 6
1 One Compatible 1
14 One Not compatible
-3 One Compatible 2
14 Three Compatible 14
Table 6: Status of egg and nest chosen
Figure 3: The comparison of FA, HC, and CA on Iteration of test data
For the Iteration, statically the computed value of F test statistics (5.5) is greater than that of critical value (1.48) for Rows and in Columns the computed value of F test statis-tics (71.7) is greater than that of critical value (3) at 5% level of significance, H0is not accepted and hence, the
it-eration differs significantly. Table 11 shows the result. Figure 4 gives the graphical representation of running time complexity of JAVA programs. CA run time complex-ity is based on Big O notation. CA outperforms as com-pared to rest of the algorithms. The diamond line repre-sents time taken by FA, the square line shows time taken by HC and triangle line plotting represents CA.
Figure 4: The comparison of FA, HC, and CA on complex-ity of test data
Main Iteration Optimized test data Iterations Complexity
Path number Test data HC CA FA HC CA FA HC CA FA
1 6 6 1 2 204 114 47 3.25 1.88 2.38
2 4 4 1 1 76 27 3.25 2.38
3 6 6 1 2 211 47 3.25 2.38
Table 7: Final compared result using the three algorithms on a case study
that, the computed value of F test statistics (3.8) is greater than that of critical value (1.48) for Rows and in Columns the computed value of F test statistics (113) is greater than that of critical value (3) at 5% level of significance, H0 is
not accepted and hence, the iteration differs significantly. Table 12 shows the result.
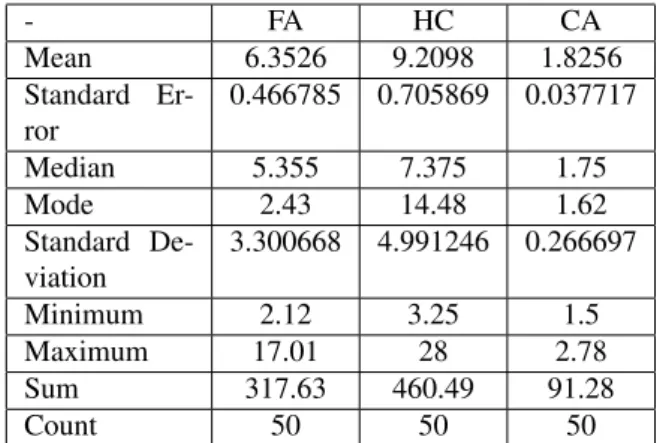
In Table 13, descriptive statistics for the result of test data of FA, HC, and CA algorithm are been mentioned. The given descriptive statistics include: mean, standard er-ror, median, mode, and standard deviation. At 95 % confi-dence, authors can say that the result of optimized test data of CA which shows much-improved performance as com-pared to FA and HC.
The descriptive statistics for the execution time of test data using FA, HA, and CA algorithm is mentioned in Ta-ble 14. At 95% confidence, authors can say that the dura-tion time of CA is shown much-improved performance as compared to FA and HA.
The descriptive statistics for the Iteration of test data us-ing FA, HC, and CA algorithm is mentioned in Table 15. At 95% confidence, authors can say that the execution time of CA is testifying much-improved performance as compared to FA and HC.
The descriptive statistics for the Cyclomatic complexity of test data using FA, HC, and CA algorithm is mentioned in Table 16. At 95% confidence, authors can say that the execution time of CA is testifying much-improved perfor-mance as compared to FA and HC.
The performance of the algorithms has been analyzed statistically. ANOVA two-factor without replication has been implemented to check the significant difference among the various algorithms. Descriptive statistics also be performed and the confidence interval is built on the ba-sis of average and standard error. Statistically, it was found that the performance of CA is better than that of FA and HA algorithms.
7
Threats
7.1
Internal threats
– The initial test data were generated by making use of the worst case analysis.
– The optimized test data were produced although the approach that we have adopted is purely randomized.
– This algorithm might take some amount of time to
make the buff list empty and hence, the process needs to be continued till it becomes empty.
– It may happen that a test data which does not belong to any path will be there in the buff list which would mean that the desired results might not be obtained.
External threats
– This algorithm is only applied to Java based programs and has also not been applied to any other application.
Construction threats
– The above program needs Java development kit and Java runtime environment.
– The calculated computation time might change every time as it could depend on the operating system and other system features.
8
Conclusion and future scope
CA has been proved to be effective in producing optimized test data. A large number of test data for all possible paths in a program under test were reduced without any redun-dancy. The reduced number of test data were effective in minimizing the overall cost, effort, and time of the test-ing phase in software development life cycle. In future, attempts can be made to extend the work by applying the algorithm to large datasets and for real-time applications as well. This potentially powerful optimization technique can be extended to study multi-objective optimization ap-plications with various constraints, even to NP-hard prob-lems. The studies can also focus on hybridization of CA with other metaheuristic algorithms.
References
[1] Sommerville, I. (2004)Software engineering, Inter-national computer science series. ed: Addison Wes-ley.
[2] Mathur, A. P. (2008)Foundations of Software Testing, Pearson Education India.
No. Total Data Optimization Duration(in ms) Iterations Complexity
- - FA HC CA FA HC CA FA HC CA FA HC CA
P1 27 6 83 4 266 395 3 183 1715 214 11.2 14.48 2.11
P2 12 4 11 5 33 93 1 106 264 249 5.42 6.75 1.5
P3 12 2 12 4 58 4 2 68 396 48 5.34 6.24 1.5
P4 50 18 50 24 197 443 3 962 3000 280 4.4 6.5 2
P5 75 29 75 8 247 324 10 764 3000 436 12.5 16.25 2.25
P6 27 9 89 5 109 137 6 246 1715 179 9.32 15 2.11
P7 18 10 18 4 29 43 4 109 618 85 6.57 10.74 1.89
P8 200 190 200 98 290 1729 8 19 3000 91 5.14 6.54 1.5
P9 15 10 16 8 10 7 1 119 400 70 5.34 6.5 1.5
P10 500 492 500 241 677 772 20 2420 3000 1840 5.37 7 1.62
P11 1000 977 1000 491 975 1446 620 1600 2500 53 5.5 7.22 1.86
P12 1000 994 1000 509 1056 1695 61 2300 3000 1001 6 6.54 2
P13 1000 994 1000 489 659 1694 47 2200 3000 1577 6.5 6.58 1.62
P14 100 86 100 49 406 202 4 2341 3000 812 5.2 7.82 1.62
P15 70 69 70 25 234 246 7 2141 3000 419 7.25 12 1.75
P16 8 2 8 2 117 8 1 38 172 24 4.58 7.5 1.5
P17 16 8 38 4 28 69 2 80 305 78 8.56 15 2.11
P18 27 11 157 7 34 267 3 434 3000 205 6.42 9.82 1.89
P19 27 6 126 11 48 503 2 137 3000 142 4.28 7.25 1.67
P20 50 35 50 22 384 304 4 1800 3000 267 4.76 6.76 1.62
P21 16 5 16 3 82 87 6 121 491 114 7.14 9.75 1.88
P22 16 16 52 4 51 299 2 104 264 83 9.16 14.48 2
P23 27 1 143 9 153 298 3 361 3000 148 6.87 10.86 1.89
P24 10 3 10 1 2 100 5 123 738 538 2.12 3.25 1.88
P25 13 7 13 3 3 5 5 124 1527 578 2.12 3.25 1.88
P26 39 16 13 11 62 173 5 377 3000 260 6.36 9.75 1.88
P27 6 6 6 2 2 3 1 39 210 29 2.14 3.62 1.56
P28 6 6 6 2 2 2 1 12 210 31 2.14 3.62 1.56
P29 450 442 450 253 681 599 17 2400 3000 2300 5.29 6.63 2
P30 600 593 600 297 1130 776 23 2200 3000 1300 4.76 6.76 1.88
P31 27 6 126 10 22 279 2 60 3000 125 4.28 7.24 1.67
P32 29 18 29 3 70 93 4 164 650 187 12.01 17.36 2.22
P33 29 18 29 3 70 93 4 164 650 187 12.01 17.38 2.22
P34 29 18 29 3 70 93 4 164 650 187 12.01 17.37 2.22
P35 60 22 60 24 128 158 7 682 3000 124 10.68 13.52 1.62
P36 14 12 6 6 117 24 2 145 1762 66 2.43 4 1.62
P37 10 74 100 18 264 255 6 1874 3000 786 9.26 13 2.25
P38 100 100 100 50 442 344 4 2975 3000 645 4.86 7.5 1.75
P39 118 77 120 13 489 602 49 1684 3000 1325 17.01 28 2.78
P40 7 4 7 2 49 11 7 36 162 125 4.86 8 1.62
P41 15 5 14 6 22 7 2 88 330 137 6.75 9.36 1.75
P42 8 3 16 4 3 3 2 82 464 137 2.33 3.62 1.56
P43 60 22 60 24 128 158 7 682 3000 124 10.68 13.52 1.62
P44 23 23 23 5 113 73 3 161 1126 141 8.56 14.48 2
P45 30 30 30 14 131 77 7 540 3000 130 5 7.04 1.62
P46 24 13 24 7 20 89 87 385 3000 1712 2.43 3.38 1.75
P47 24 13 24 7 20 89 87 385 3000 1712 2.43 3.38 1.75
P48 500 496 500 51 1007 193 60 2246 3000 1518 2.43 3.38 2
P49 20 4 20 7 8 51 7 154 1419 92 5 6.5 1.56
P50 14 10 14 4 65 24 6 94 624 61 4.86 8 1.67
Source of Variation SS df MS F P-value F crit
Rows 6715135 49 137043.6 21 7.31 1.48
Columns 204886.9 2 102443.4 15.7 1.15 3.08
Error 636560.4 98 6495.515 - -
-Total 7556583 149 - - -
-Table 9: ANOVA results based on Optimization
Source of Variation SS df MS F P-value F crit
Rows 8844974 49 180509.7 3.14 7.18 1.48
Columns 2132012 2 1066006 18.56 1.46 3.08
Error 5627039 98 57418.77 - -
-Total 16604025 149 - - -
-Table 10: ANOVA Result Of Execution Time/ Duration
Source of Variation SS df MS F P-value F crit
Rows 88715082 49 1810512 4.52 1.08 1.48
Columns 57403410 2 28701705 71.74 6.43 3.08
Error 39204947 98 400050.5 - -
-Total 185000000 149 - - -
-Table 11: ANOVA Result Of Iteration
Source of Variation SS df MS F P-value F crit
Rows 1160.181 49 23.67 3.88 5.7 1.48
Columns 1386.396 2 693.19 113.63 2.96 3.08
Error 597.8448 98 6.1 - -
-Total 3144.421 149 - - -
- FA HC CA
Mean 120.3 144.86 57.12
Standard Er-ror
36.80852 36.27629 18.16194
Median 14.5 44 7
Mode 6 16 4
Standard De-viation
260.2755 256.5121 128.4243
Minimum 1 6 1
Maximum 994 1000 509
Sum 6015 7243 2856
Count 50 50 50
Table 13: Descriptive Statistics For The Result Of Opti-mized Test data
- FA HC CA
Mean 225.26 308.78 24.68
Standard Er-ror
42.72953 62.64793 12.50474
Median 95.5 147.5 4.5
Mode 2 93 2
Standard De-viation
302.1434 442.9877 88.42186
Minimum 2 2 1
Maximum 1130 1729 620
Sum 11263 15439 1234
Count 50 50 50
Table 14: Descriptive Statistics For The Duration Of Test data
- FA HC CA
Mean 733.86 1887.24 459.44
Standard Er-ror
127.2218 170.9619 82.45547
Median 173.5 2750 183
Mode 164 3000 187
Standard De-viation
899.5941 1208.883 583.0482
Minimum 12 162 24
Maximum 2975 3000 2300
Sum 36693 94362 22972
Count 50 50 50
Table 15: Descriptive Statistics For The Iteration
- FA HC CA
Mean 6.3526 9.2098 1.8256
Standard Er-ror
0.466785 0.705869 0.037717
Median 5.355 7.375 1.75
Mode 2.43 14.48 1.62
Standard De-viation
3.300668 4.991246 0.266697
Minimum 2.12 3.25 1.5
Maximum 17.01 28 2.78
Sum 317.63 460.49 91.28
Count 50 50 50
Table 16: Descriptive Statistics For Complexity
[4] Ramamoorthy, C. V., and Ho, S. B. F. (1975) Test-ing large software with automated software evalua-tion systems, In ACM SIGPLAN Notices, ACM, pp. 382-394.
[5] Miller, W., and Spooner, D. L. (1976) Automatic gen-eration of floating-point test data,IEEE Transactions on Software Engineering, IEEE, pp. 223.
[6] Clarke, L. A. (1976) A system to generate test data and symbolically execute programs, IEEE Transac-tions on Software Engineering, IEEE, pp. 215-222.
[7] Prather, R. E., and Myers Jr, J. P. (1987) The path prefix software testing strategy,IEEE Transactions on Software Engineering, IEEE, pp. 761-766.
[8] Korel, B. (1990) The path prefix software testing strategy, IEEE Transactions on Software Engineer-ing, IEEE, pp. 870-879.
[9] Ferguson, R., and Korel, B. (1996) The chaining ap-proach for software test data generation,IACM Trans-actions on Software Engineering and Methodology (TOSEM), ACM, pp. 63-86.
[10] Korel, B., and Al-Yami, A. M. (1996) Assertion-oriented automated test data generation, 18th inter-national conference on Software engineering, IEEE, pp. 71-80.
[11] Fröhlich, P., and Link, J. (2000) Automated test case generation from dynamic models, In ECOOP 2000 Object-Oriented Programming, Springer Berlin Hei-delberg, pp. 472-491.
[12] Kim, S., Clark, J. A., and McDermid, J. A. (2000) Class mutation: Mutation testing for object-oriented programs,Proc. Net. ObjectDays, Citeseer, pp. 9-12.
[14] Harman, M. (2007) The current state and future of search based software engineering, Future of Soft-ware Engineering, IEEE, pp. 342-357.
[15] Ernst, M. D., Cockrell, J., Griswold, W. G., and Notkin, D. (2001) The current state and future of search based software engineering, IEEE Transac-tions on Software Engineering, IEEE, pp. 99-123.
[16] Papadakis, M., and Malevris, N. (2010) Automatic mutation test case generation via dynamic symbolic execution, IEEE 21st international symposium on Software reliability engineering (ISSRE), IEEE, pp. 121-130.
[17] Fraser, G., and Arcuri, A. (2011) Evolutionary gener-ation of whole test suites,11th International Confer-ence on Quality Software (QSIC), IEEE, pp. 31-40.
[18] Sofokleous, A. A., and Andreou, A. S. (2008) Auto-matic, evolutionary test data generation for dynamic software testing, Journal of Systems and Software, IEEE, pp. 1883-1898.
[19] Fraser, G., and Arcuri, A. (2011) Evosuite: automatic test suite generation for object-oriented software,In Proceedings of the 19th ACM SIGSOFT symposium and the 13th European conference on Foundations of software engineering, ACM, pp. 416-419.
[20] McMinn, P. (2004) Search-based software test data generation: A survey, Software Testing Verification and Reliability, Wiley, pp. 105-156.
[21] Wappler, S., and Wegener, J. (2006) Evolutionary unit testing of object-oriented software using strongly-typed genetic programming,In Proceedings of the 8th annual conference on Genetic and evolutionary com-putation, ACM, pp. 1925-1932.
[22] Ribeiro, J. C. B. (2008) Search-based test case gener-ation for object-oriented java software using strongly-typed genetic programming, In Proceedings of the 10th annual conference companion on Genetic and evolutionary computation, ACM, pp. 1819-1822.
[23] Tonella, P. (2005) Reverse engineering of object ori-ented code,In Proceedings of the 27th international conference on Software engineering, ACM, pp. 724-725.
[24] Lakhotia, K., Harman, M., and McMinn, P. (2007) A multi-objective approach to search-based test data generation, In Proceedings of the 9th annual con-ference on Genetic and evolutionary computation, ACM, pp. 1098-1105.
[25] Yang, X. S., and Deb, S. (2010) Engineering op-timisation by cuckoo search, International Journal of Mathematical Modelling and Numerical Optimisa-tion, Inderscience, pp. 330-343.
[26] Rajabioun, R. (2011) Cuckoo optimization algorithm,
Applied soft computing, Elsevier, pp. 5508-5518.
[27] Walton, S., Hassan, O., Morgan, K., and Brown, M. R. (2011) Modified cuckoo search: a new gradi-ent free optimisation algorithm,Chaos, Solitons and Fractals, Elsevier, pp. 710-718.
[28] Yildiz, A. R. (2013) Cuckoo search algorithm for the selection of optimal machining parameters in milling operations, The International Journal of Advanced Manufacturing Technology, Springer, pp. 55-61.
[29] Valian, E., Mohanna, S., and Tavakoli, S. (2011) Im-proved cuckoo search algorithm for feedforward neu-ral network training,International Journal of Artifi-cial Intelligence and Applications, Elsevier, pp. 36-43.
[30] Civicioglu, P., and Besdok, E. (2013) A concep-tual comparison of the Cuckoo-search, particle swarm optimization, differential evolution and artificial bee colony algorithms, Artificial Intelligence Review, Springer, pp. 315-346.
[31] Gandomi, A. H., Talatahari, S., Yang, X. S., and Deb, S. (2013) Design optimization of truss structures us-ing cuckoo search algorithm,The Structural Design of Tall and Special Buildings, Wiley, pp. 1330-1349.
[32] Bulatovic, R. R., Ðordevic, S. R., and Ðordevic, V. S. (2013) Cuckoo search algorithm: a metaheuristic ap-proach to solving the problem of optimum synthesis of a six-bar double dwell linkagem,Mechanism and Machine Theory, Elsevier, pp. 1-13.
[33] Sur, C., and Shukla, A. (2014) Discrete Cuckoo Search Optimization Algorithm for Combinatorial Optimization of Vehicle Route in Graph Based Road Network, In Proceedings of the Third International Conference on Soft Computing for Problem Solving, Springer, pp. 307-320.
[34] Swain, K. B., Solanki, S. S., and Mahakula, A. K. (2014) Bio inspired cuckoo search algorithm based neural network and its application to noise cancella-tion,International Conference on Signal Processing and Integrated Networks, IEEE, pp. 632-635.
[35] Prakash, M., Saranya, R., Jothi, K. R., and Vignesh-waran, A. (2012) An optimal job scheduling in grid using cuckoo algorithm,International Journal Com-puter Science Telecomm, pp. 65-69.
[36] Wang, G. G., Gandomi, A. H., Zhao, X., and Chu, H. C. E. (2016) Hybridizing harmony search algo-rithm with cuckoo search for global numerical opti-mization,Soft Computing, Springer, pp. 273-285.
driven optimization based study of satellite image segmentation for multilevel thresholding using Ka-pur’s entropy,Expert Systems with Applications, El-sevier, pp. 3538-3560.
[38] Mala, D. J., and Mohan, V. (2010) Quality improve-ment and optimization of test cases: a hybrid genetic algorithm based approach,ACM SIGSOFT Software Engineering Notes, ACM, pp. 1-14.
[39] Lotem, A., Nakamura, H., and Zahavi, A. (1992) Re-jection of cuckoo eggs in relation to host age: a pos-sible evolutionary equilibrium, Behavioral Ecology, ISBE, pp. 128-132.
[40] Yildiz, A. R. (2009) An effective hybrid immune-hill climbing optimization approach for solving de-sign and manufacturing optimization problems in in-dustry,Journal of Materials Processing Technology, Elsevier, pp. 2773-2780.
[41] Devadas, S., Ma, H. K. T., Newton, A. R., and Sangiovanni-Vincentelli, A. (1988) Synthesis and op-timization procedures for fully and easily testable se-quential machines, In International Conference on New Frontiers in Testing, IEEE, pp. 621-630.
[42] Chun, J. S., Jung, H. K., and Hahn, S. Y. (1998) A study on comparison of optimization performances between immune algorithm and other heuristic algo-rithms,IEEE Transactions on Magnetics, IEEE, pp. 2972-2975.
[43] Ahmed, B. S., Abdulsamad, T. S., and Potrus, M. Y. (2015) Achievement of minimized combinatorial test suite for configuration-aware software functional test-ing ustest-ing the Cuckoo search algorithm,Information and Software Technology, Elsevier, pp. 13-29.
[44] Gandomi, A. H., Yang, X. S., and Alavi, A. H. (2013) Cuckoo search algorithm: a metaheuristic approach to solve structural optimization problems, Engineer-ing with computers, Springer, pp. 17-35.
[45] Elazim, S. A., and Ali, E. S. (2016) Optimal Power System Stabilizers design via Cuckoo Search algo-rithm,International Journal of Electrical Power and Energy Systems, Elsevier, pp. 99-107.
[46] Papadakis, M., and Malevris, N. (2012) Mutation based test case generation via a path selection strat-egy,Information and Software Technology, 54(9), pp. 915-932.
[47] Papadakis, M., and Malevris, N. (2011) Automati-cally performing weak mutation with the aid of sym-bolic execution, concolic testing and search-based testing,Software Quality Journal, 19(4), pp. 691-723.
[48] Papadakis, M., and Malevris, N. (2013) Search-ing and generatSearch-ing test inputs for mutation testSearch-ing,