
Catalytic Water Oxidation Involving Ruthenium Polypyridyl Complexes
Jonah Wesley Jurss
“A dissertation submitted to the faculty of the University of North Carolina at Chapel Hill in partial fulfillment of the requirements for the degree of Doctor of Philosophy in the Department of Chemistry.”
Chapel Hill 2011
iii ABSTRACT
Jonah Wesley Jurss: Catalytic Water Oxidation Involving Ruthenium Polypyridyl Complexes
(Under the direction of Thomas J. Meyer and Joseph L. Templeton)
Light-driven water oxidation occurs in oxygenic photosynthesis in Photosystem II where reductive equivalents are produced to ultimately convert carbon dioxide into carbohydrates. This process effectively stores solar energy in the form of chemical bonds. Water oxidation is a key component in schemes for artificial photosynthesis, such as solar-driven water splitting into hydrogen and oxygen, 2H2O → O2 + 2H2, which could provide much needed clean, renewable fuels.
The “blue dimer”, cis,cis-[(bpy)2(H2O)RuIIIORuIII(OH2)(bpy)2]4+, is the first well characterized molecule known to catalyze water oxidation. It meets the stoichiometric requirements for water oxidation, 2H2O → O2 + 4e- + 4H+, by utilizing proton-coupled electron transfer (PCET) reactions in which both electrons and protons are transferred. In the key step, oxidation to the catalytically-active state, [(O)RuVORuV(O)]4+, results in
nucleophilic water attack to form the O-O bond, producing a peroxidic complex. The mechanism of blue dimer catalyzed water oxidation has been resolved to its clearest understanding yet, yielding new insights and opportunities for rational catalyst design.
iv
as a sacrificial oxidant. These homogeneous catalysts have been incorporated into devices by the synthesis of their phosphonic acid derivatized analogues to provide stable interfacial attachment to metal oxide surfaces. Low overpotentials for the electrocatalysis of water oxidation have been achieved with high turnover numbers.
Furthermore, a strategy for enhancing rates of water oxidation has been developed using a series of kinetically facile electron transfer mediators with varying thermodynamic driving force. Rate enhancements by factors of up to 30 have been obtained in solution and with surface-modified electrodes. An electrochemical kinetic analysis has been applied for homogeneous water oxidation with surface-modified electrodes.
The incorporation of catalysts with electron transfer mediators, which have been studied extensively as chromophores for excited state electron transfer reactions, has led to the design and synthesis of assemblies for electrocatalytic water oxidation, providing new insights into their application toward solar energy conversion. Another approach toward assemblies of this kind has been pursued by exploiting the pH dependence of phosphonic acid derivatized complexes by electrostatic association of cationic water oxidation catalysts to deprotonated, anionic redox mediator-chromophore adsorbates on electrode surfaces. This negates the need for difficult synthetic procedures and bridge design for attaching the
v
ACKNOWLEDGEMENTS
I am indebted to my advisors, Tom Meyer and Joe Templeton, for their guidance during graduate school. Their eager engagement with the research and valuable insight made my time at UNC exciting, productive, and primed for great intellectual growth. It has largely been their constructive criticism, timely encouragement, and praise that has helped shape my development as a chemist. To my benefit, their strengths in mentoring and directing research efforts complemented each other extremely well. It has been a pleasure to work with two such highly respected chemists, and even better people.
I am especially grateful for the friendships that have been made with members of the Meyer and Templeton research groups, in addition to many others of UNC Chemistry. I could not have asked for a better group of people to work with and spend so much time with over the last five years, inside and outside of the laboratory. There are too many friends and coworkers to list here, but a special thanks goes to Javier Concepcion. He has been a good friend from the beginning, great to work with, and his enthusiasm, optimism, and patient teaching in the laboratory have made a significant impact on me. Chris Gagliardi has also been a close friend from the beginning and one of the few people that always has me laughing. I also thank Jake Sprague for being a great friend and roommate for four years in Chapel Hill.
vi
the importance of education at an early age. To each of you and the rest of my family and friends, thank you: I love you dearly!
vii
TABLE OF CONTENTS
LIST OF TABLES……….…...ix
LIST OF FIGURES……….………….xi
LIST OF SCHEMES………...xxii
LIST OF SYMBOLS AND ABBREVIATIONS………...xxiii
CHAPTERS I. Solar Energy Conversion: Natural and Artificial Photosynthesis………...…...1
II. Electronic Structure of the Water Oxidation Catalyst, cis,cis-[(bpy)2(H2O)RuORu(OH2)(bpy)2]4+, The Blue Dimer………..……...42
III. Mechanism of Water Oxidation by the Blue Dimer, cis,cis-[(bpy)2(H2O)RuORu(OH2)(bpy)2]4+………...……..99
IV. One Site is Enough – Monomeric Catalysts for Water Oxidation……….……..185
V. Diffusional and Surface-adsorbed Electron Transfer Mediators………….……. 207
VI. Electron Transfer Mediator-Chromophore/Catalyst Assemblies ………... 236
VII. pH Dependence of Phosphonic Acid Derivatized [Ru(bpy)3]2+ and Electrostatic Synthesis of Redox Mediator-Chromophore/Catalyst Assemblies………..……... 248
APPENDICES A. Electronic Structure of the Water Oxidation Catalyst, cis,cis-[(bpy)2(H2O)RuORu(OH2)(bpy)2]4+, The Blue Dimer……….…….. 296
B. Mechanism of Water Oxidation by the Blue Dimer, cis,cis-[(bpy)2(H2O)RuORu(OH2)(bpy)2]4+……….…….. 384
viii
D. Diffusional and Surface-adsorbed Electron Transfer Mediators……….. 484 E. Electron Transfer Mediator-Chromophore/Catalyst Assemblies...………... 495 F. pH Dependence of Phosphonic Acid Derivatized [Ru(bpy)3]2+ and
Electrostatic Synthesis of Redox Mediator-Chromophore/Catalyst
ix
LIST OF TABLES Table 2.1. Crystallographic data for the cations in the salts
[(bpy)2(Cl)RuORu(Cl)(bpy)2](Ce(NO3)6) and
[(bpy)2(SO4)RuORu(SO4)(bpy)2].H2O(SO4)0.5………..50 Table 2.2. Comparison of important bond distances (Å) and angles (deg) in
[(bpy)2(HO)RuIVORuIII(OH2)(bpy)2](ClO4)4•2H2O, [(bpy)2ClRuIIIORuIVCl(bpy)2](ClO4)3•H2O,
[(bpy)2ClRuORuCl(bpy)2](Ce(NO3)6)•H2O,
and [(bpy)2(SO4)RuORu(SO4)(bpy)2](SO4)•H2O……….. 51 Table 2.3. Near-IR absorption bands for RuIIIORuIII and RuIVORuIII forms of
the blue dimer……… 57 Table 2.4. Raman band energies, polarizations (polarized, P, or depolarized, dp),
and proposed assignments for [(bpy)2(H2O)RuIIIORuIII(OH2)(bpy)2]4+
in water at pH = 1……….. 59 Table 2.5. Differential Raman cross-sections at various excitation wavelengths
for [(bpy)2(H2O)RuIIIORuIII(OH2)bpy)2]4+ in water at pH = 1………... 60 Table 2.6. Significant bond distances and angles from the crystal structure and
optimized geometries of the blue dimer with different numbers of water molecules and chloride ions in the outer coordination sphere………... 65 Table 2.7. Absorption band energies and proposed assignments for
[(bpy)2(H2O)RuIIIORuIII(OH2)bpy)2]4+ in water at pH = 1……… 68 Table 2.8. Comparison of selected bond cistances (Å) and angles (deg) for the
cations in [(bpy)2(H2O)RuIIIORuIII(OH2)(bpy)2](ClO4)4•2H2O, [(bpy)2(H3N)RuIIIORuIII(NH3)(bpy)2](ClO4)4•2H2O, and
[(bpy)2(O2N)RuIIIORuIII(NO2)(bpy)2](ClO4)2•2H2O………. 73 Table 2.9. Comparison between experimental and calculated geometries for
[(bpy)2(H2O)RuIIIORuIII(H2O)(bpy)2]4+………. 82 Table 2.10. Structural, magnetic, and spectrocoscopic data for Ru-O-Ru complexes…. 84 Table 2.11. Electrochemical data for adjacent 1e- redox couples for Ru-O-Ru
bridged complexes and calculated comproportionation constants, KC…….. 88 Table 3.1. Characteristic visible and near-infrared absorption bands of various
oxidation and protonation states of the blue dimer and intermediates
x
Table 3.2. Rate constants for Ce(IV) oxidation of [(H2O)RuIIIORuIII(OH2)]4+…….…. 111 Table 3.3. Summary of initial oxidative activation of blue dimer in 0.1 M HClO4……116 Table 3.4. Summary of rate constants in addition to Table 3 (23 ± 2 °C)……….. 153 Table 3.5. Selected Formal Potentials of Ce(IV/III) couple in Different Aqueous
Acid Solutions at 25 °C in V vs. NHE………... 175 Table 4.1. Water oxidation rate constants and E1/2 (V vs. NHE) values for the
RuIII/II, RuIV/III and RuV/IV couples in the series [Ru(tpy)(NN)(OH2)]n+
in 0.1 M HNO3………... 202 Table 4.2. As in Table 1 for the series [Ru(NNN)(bpy)(OH2)]2+………... 203 Table 5.1. Rate constant data for oxidation of I (0.1 M HNO3) or II (1 M HNO3)
at 298 K with [(H2O)RuIIIORuIII(OH2)4+] = 1.25×10⁻⁵ M,
[Redox Mediator] = 1.25×10⁻⁵ M and 30 equivalents of Ce(IV)……...…… 216 Table 7.1. Surface loading isotherms for phosphonic acid derivatized [Ru(bpy)3]2+
complexes on ITO……….. 259 Table 7.2. pKa values determined by spectrophotometric monitoring of absorbance
xi
LIST OF FIGURES
Figure 1.1. Photon flux and accumulated photocurrent from the sun……….…. 3 Figure 1.2. An illustration of a conventional dye-sensitized solar cell and its relative
energetics, reaction kinetics, and electrode current densities ………….….. 6 Figure 1.3. Crystal structure of the Photosystem II dimer at 3.5 Å resolution………….9 Figure 1.4. Chloroplast from corn. (a) An electron micrograph. (b) Schematic
diagram……….. 10 Figure 1.5. Schematic illustration showing the integrated components of oxygenic
photosynthesis embedded in the thylakoid membrane……….. 11 Figure 1.6. Detailed energy diagram (V vs. NHE) of electron transport chain,
commonly referred to as the Z-scheme, of photosynthesis……… 13 Figure 1.7. The Kok cycle of Photosystem II………...14 Figure 1.8. RuIV=O2+ schematic energy orbital diagram……….. 19 Figure 1.9. Reaction scheme describing the proton-coupled electron transfer
comproportionation of cis-RuII(bpy)2(py)(OH2)2+ and
cis-RuIV(bpy)2(py)(O)2+………. 20 Figure 1.10. Reaction scheme detailing the proposed oxygen-oxygen bond forming
step of water oxidation in the OEC……… 22 Figure 1.11. Reaction scheme depicting energy conversion via a charge separated
state promoted by excited-state electron transfer quenching………. 23 Figure 1.12. Diagrams showing key features of potential photosynthetic devices ……... 24 Figure 1.13. Plot of ln k vs. - G° and free energy-reaction coordinate (Q)
xii
Figure 2.3. Temperature dependence of (magnetic susceptibility per formula unit) and 1/ (inset) for the blue dimer in magnetic fields of 0.1 T and 5.0 T…... 54 Figure 2.4. Temperature dependence of T and eff (inset; magnetic moment per
formula unit) for the blue dimer in magnetic fields of 0.1 T and 5.0 T……. 54 Figure 2.5. UV-visible spectra for [(bpy)2(H2O)RuIIIORuIII(OH2)(bpy)2]4+ and
[(bpy)2(HO)RuIVORuIII(OH2)(bpy)2]4+ in 0.1 M HNO3……… 55 Figure 2.6. Near IR absorption of [(HO)RuIVORuIII(OH2)]4+ in 0.1 M DNO3………… 56 Figure 2.7. Resonance Raman spectrum of [(bpy)2(H2O)RuIIIORuIII(OH2)bpy)2]4+
in water at pH = 1 with 514.5 nm excitation………. 58 Figure 2.8a. Raman excitation profiles for [(bpy)2(H2O)RuIIIORuIII(OH2)bpy)2]4+
in water at pH = 2 vs. 0.5 M Na2SO4 for νsym(Ru-O-Ru) at 390 cm-1
and ν18(bpy) at 364 cm-1………. 62 Figure 2.8b. Raman excitation profiles for [(bpy)2(H2O)RuIIIORuIII(OH2)bpy)2]4+
in water at pH = 2 vs. 0.5 M Na2SO4 for νsym(Ru-O-Ru) at 390 cm-1,
ν(bpy) at 461 cm-1, and ν15(bpy) at 1040 cm-1………... 63 Figure 2.9. Energy level diagram for [(bpy)2(H2O)RuIIIORuIII(OH2)(bpy)2]4+ from
DFT calculations based on the B3LYP functional and LANL2DZ basis set. A closed-shell singlet ground state was assumed……… 66 Figure 2.10. UV-Vis-near IR spectrum of [(bpy)2(H2O)RuIIIORuIII(OH2)(bpy)2]4+
in water at pH = 1……….. 67 Figure 2.11. Molecular orbitals for [(bpy)2(H2O)RuIIIORuIII(OH2)(bpy)2]4+ involved
in MLCT and bridge-based electronic transitions in the near IR-visible…... 70 Figure 2.12a. Plot of sym(Ru-O-Ru) vs. < Ru-O-Ru for complexes in Table 10………… 86 Figure 2.12b. As in Figure 12a variation in the energy of the intense, low energy
visible absorption band with <RuORu………... 86 Figure 3.1. E1/2-pH diagram for [(bpy)2(H2O)RuIIIORuIII(OH2)(bpy)2]4+ at 25 oC,
I = 0.1 M, vs. SCE... 105 Figure 3.2. Addition of 1.95 x 10⁻⁴ M Ce(IV) to 6.5 x 10⁻⁵ M
[(H2O)RuIIIORuIII(OH2)]4+ in 0.1 M HClO4 at 25 °C ………... 110 Figure 3.3. Decay of electrolytically-prepared 5.0 x 10⁻⁵ M [(O)RuVORuIV(O)]3+
xiii
Figure 3.4. Decay of 5.0 x 10⁻⁵ M electrolytically prepared [(O)RuVORuIV(O)]3+
at pH 6, acidified to pH = 0 with 2.0 M CF3SO3H……… 113 Figure 3.5. Addition of 4 eq. of Ce(IV) to electrolytically prepared
[(O)RuVORuIV(O)]3+, acidified to pH = 0……….. 114 Figure 3.6. Addition of 3 eq. of Ce(IV) to 6.5 x 10⁻⁵ M [(H2O)RuIIIORuIII(OH2)]4+
in 0.1 M HClO4……….. 115 Figure 3.7. Calculated spectra and concentration profiles extracted from singular
value deconvolution from the data shown in Figure 6: addition of 3 eq.
of Ce(IV) to 6.5 x 10⁻⁵ M [(H2O)RuIIIORuIII(OH2)]4+ in 0.1 M HClO4……. 115 Figure 3.8. Experimental and calculated absorption spectra of [(O)RuVORuV(O)]4+….. 118 Figure 3.9. Addition of 2.8 eq. (1.4 x 10⁻⁴ M) of Ce(IV) to 5.0 x 10⁻⁵ M
[(HO)RuIVORuIII(OH2)]4+ in 0.1 M HClO4………...…….119 Figure 3.10. Addition of 3 eq. of Ce(IV) to 1.25 x 10⁻⁵ M [(HO)RuIVORuIII(OH2)]4+
in 0.1 M HNO3……….….. 120
Figure 3.11. Acid-base forms of intermediate I in 1.0 M CF3SO3H and
in 0.1 M CF3SO3H………. 121
Figure 3.12. Redox titration with Fe(aq)2+ in 0.1 M HNO3 after addition of 3 eq. of
Ce(IV) to [(HO)RuIVORuIII(OH2)]4+ to generate intermediate I…………... 122 Figure 3.13. Decay of intermediate I (5 x 10⁻⁵ M), generated by adding 3 eq. of
Ce(IV) to [(HO)RuIVORuIII(OH2)]4+ in 0.1 M HNO3 ………... 123 Figure 3.14. Addition of 30 eq. Ce(IV) to a concentration of 5.0 x 10⁻⁵ M blue dimer
in 0.1 M HNO3………... 124 Figure 3.15. Addition of 3 eq. Ce(IV) to 0.94 mM [(HO)RuIVORuIII(OH2)]4+
in 0.1 M HNO3………... 125 Figure 3.16. Acid-base forms of intermediate II in 0.1 M HNO3 and 1.0 M HNO3……..126 Figure 3.17. Redox titration with Fe(aq)2+ in 0.1 M HNO3 after addition of 30 eq.
Ce(IV) to [(H2O)RuIIIORuIII(OH2)]4+ to generate intermediate II…………. 126 Figure 3.18. Decay of intermediate II generated after the consumption of 30 eq.
xiv
Figure 3.19. (A) Absorbance vs. time trace obtained from the spectral monitoring shown in Figure 17 following the decay of intermediate II by the appearance of [(HO)RuIVORuIII(OH2)]4+ at its max, 495 nm.
(B) First order plot of kinetic trace in (A): -ln((At - A∞)/(A0 - A∞)) vs.
time (s) for absorbance at 495 nm………..127 Figure 3.20. Addition of 75 eq. of CeIV to 2.0 x 10⁻⁵ M blue dimer in 0.1 M HNO3……. 128 Figure 3.21. Absorbance vs. time traces monitoring Ce(IV) consumption at 360 nm
following addition of 30 eq. of Ce(IV) added (with respect to
5.0 x 10⁻⁵ M catalyst) to low concentrations of the blue dimer………. 129 Figure 3.22. First order plot (kobs vs. Blue Dimer Concentration (M)) of observed
zero order rate constants obtained from linear fits of data shown in Figure 21 showing the first order dependence of Ce(IV) consumption
on the concentration of catalyst………. 129 Figure 3.23. Addition of 30 eq. of Ce(IV) to different concentrations of
[(H2O)RuIIIORuIII(OH2)]4+ in 0.1 M HNO3 at 23 ± 2 °C. A 400 nm cut-off filter was used. (A) 1.5 x 10⁻³ M Ce(IV), 5.0 x 10⁻⁵ M blue dimer, (B) 3.0 x 10⁻³ M Ce(IV), 1.0 x 10⁻⁴ M blue dimer, (C) 0.015 M Ce(IV),
5.0 x 10⁻⁴ M blue dimer, (D) 0.03 M Ce(IV), 0.001 M blue dimer………... 131 Figure 3.24. Linear relationship for kobs (s-1) vs. anion concentration for appearance of
anated species at 455 nm. Addition of 30eq Ce(IV) to 5 x 10⁻⁵ M Blue
Dimer in 0.1 M HNO3 with increasing amounts of KNO3……… 132 Figure 3.25. Addition of different amounts of Ce(IV) to 0.001 M
[(H2O)RuIIIORuIII(OH2)]4+ in 0.1 M HNO3. A 400 nm cut-off filter was used. (A) 7.5 x 10⁻³ M Ce(IV) – 7.5 eq. (B) 0.015 M Ce(IV) – 15 eq.
(C) 0.03 M Ce(IV) – 30 eq. (D) 0.045 M Ce(IV) – 45 eq………. 133 Figure 3.26. Addition of increasing amounts of Ce(IV) to 0.001 M blue dimer in
0.1 M HNO3, representative spectra vs. time in Figure 25. (A) Monitoring the conversion to intermediate III at 455 nm.
(B) Its associated absorption maximum plotted vs. [Ce(IV)]……… 134 Figure 3.27. Redox titration with Fe(aq)2+. Addition of two sequential 1 eq. Fe2+
aliquots were required to reduce intermediate III to
[(H2O)RuIIIORuIII(OH2)]4+……….…… 134 Figure 3.28. Absorbance vs. solution pH following titration of intermediate III
xv
Figure 3.29. Decay of intermediate III in 0.1 M HNO3 at different catalyst
concentrations, monitoring appearance of [(HO)RuIVORuIII(OH2)]4+……... 136 Figure 3.30. Absorbance-time traces following addition of 30 eq of Ce(IV) to
[(bpy)2(H2O)RuIVO RuIII(H2O)(bpy)2]5+ (5 x 10⁻⁵ M) in 1.0 M HNO3…….. 137 Figure 3.31. Pseudo-first order kinetics for excess Ce(IV) consumption. Addition of
30 eq. of Ce(IV) with respect to 5.0 x 10⁻⁵ M [(HO)RuIVORuIII(OH2)]4+ in 1.0 M HNO3. (A) Plot of -ln(absorbance at 360 nm) vs. time to determine kobs. (B) kobs (s-1) vs. blue dimer concentration to establish
first order dependence on catalyst, k = 80 M-1s-1……….….. 139 Figure 3.32. Addition of 30 eq. of Ce(IV) to different blue dimer concentrations in
1.0 M HNO3, monitoring the growth of intermediate III,
[(O2NO)RuIVORuIV(OH)]4+, at its max of 455 nm……… 140 Figure 3.33. Oxygen evolution following addition of 30 eq. of Ce(IV) to 0.001M
[(H2O)RuIIIORuIII(OH2)]4+ in 1.0 M HNO3 at 23 °C………. 141 Figure 3.34. Addition of 30 eq. of Ce(IV) to 5.0 x 10⁻⁵ M [(H2O)RuIVORuIII(OH2)]5+
in 1.0 M CF3SO3H. (A) Ce(IV) consumption. (B) After Ce(IV) consumption, decay of oxidized catalyst to back to
[(H2O)RuIVORuIII(OH2)]5+ with max = 445 nm……… 142 Figure 3.35. Following Ce(IV) consumption at 360 nm, addition of 30 eq. Ce(IV)
with respect to 5.0 x 10⁻⁵ M blue dimer to different concentrations of
[(H2O)RuIIIORuIII(OH2)]4+ in 1.0 M CF3SO3H……….. 143 Figure 3.36. (A) Linear fits of first kinetic stage of Ce(IV) consumption in 1.0 M
CF3SO3H, zero order in Ce(IV). (B) Plot of kobs (x 10-6, M s-1)
(from (A)) vs. [Blue Dimer]2 (x 10-9, M2), k = 1.15 x 10³ M-1s-1………….. 144 Figure 3.37. (A) Ce(IV) consumption followed at 360 nm. Addition of 30 eq. Ce(IV)
with respect to 0.001 M blue dimer was added to different catalyst concentrations, ranging from 5.0 x 10⁻⁴ M to 1.77 x 10⁻³ M. (B) A plot
of kobs (M s-1) vs. the concentration of blue dimer squared (M2)…………... 145 Figure 3.38. Addition of 30 eq. Ce(IV) to 5.0 x 10⁻⁵ M blue dimer in 1.0 M HClO4…… 146 Figure 3.39. Addition of 39 eq. of Ce(IV) to 5.0 x 10⁻⁵ M [(HO)RuIVORuIII(OH2)]4+
in 1.0 M HClO4 and following the decay of the intermediate after
xvi
Figure 3.40. Second stage of zero-order Ce(IV) consumption in 1.0 M HClO4, monitoring the absorbance at 360 nm. (A) Addition of 30 eq. of Ce(IV) with respect to 5.0 x 10⁻⁵ M blue dimer to different catalyst concentrations. Linear fits are shown. (B) A plot of kobs (M s-1) vs.
Blue Dimer concentration (M)………... 148 Figure 3.41. Addition of 30 eq. of Ce(IV) to 5 x 10⁻⁵ M blue dimer in 0.1 M
CF3SO3H with increasing amounts of CF3SO3Li, monitoring Ce(IV)
consumption at 360 nm……….. 149 Figure 3.42. Addition of 30 eq. Ce(IV) to 5.0 x 10⁻⁵ M [(H2O)RuIIIORuIII(OH2)]4+
in 0.1 M HNO3 with 0.233 M added CeIII(NO3)63-……… 150 Figure 3.43. A simulated cyclic voltammogram of the blue dimer at pH 0.3,
scan rate = 20 mV/s……….….. 155 Figure 3.44. Cyclic voltammograms of the blue dimer (8 x 10⁻⁴ M) in (A) 0.1 M
HClO4 (the dashed curve was measured after holding the potential at
1.4 V for 3 minutes, then scanning reductively) and (B) 3 M HClO4……... 156 Figure 3.45. Possible pathways for water oxidation by [(O)RuVORuV(O)]4+……… 158 Figure 3.46. Calculated spectra and concentration profiles extracted from singular
value deconvolution from the data shown in Figure 13: decay of the peroxidic intermediate generated by addition of 3 eq. of Ce(IV) to
5.0 x 10⁻⁵ M [(HO)RuIVORuIII(OH2)]4+ in 0.1 M HNO3……… 162 Figure 3.47. Single wavelength fits for data shown in Figure 13, using the model
described in eqs 15-17……….….. 163 Figure 4.1. Plots of E1/2(V vs. NHE) vs. pH for the Ru(V/IV) and Ru(IV/II) redox
couples of [Ru(tpy)(bpm)(OH2)]2+ and for the Ru(IV/III) and Ru(III/II) redox couples of [Ru(tpy)(bpy)(OH2)]2+ in aqueous solution (I = 0.1 M;
T = 298 K; glassy carbon working electrode) ………... 191 Figure 4.2. Monitoring Ce(IV) at 360 nm after addition of 30 equivalents of Ce(IV)
to solutions of Ru(tpy)(bpm)(OH2)2+ at various concentrations in
0.1 M HNO3………... 192 Figure 4.3. Plot of kobs vs. concentration of Ru(tpy)(bpm)(OH2)2+. As can be seen
from the plot, the kinetics for Ce(IV) disappearance are first order with
xvii
Figure 4.4. Oxygen evolution/turnover number vs. time plot for the addition of 30 equivalents of Ce(IV) (567 mol) to 6.5 mL of 2.9 x 10⁻³ M
Ru(tpy)(bpm)(OH2)2+ (18.9 mol) in 1.0 M HNO3……….….. 194 Figure 4.5. Single site mechanism for water oxidation by the monomers,
[Ru(tpy)(bpm)(OH2)]2+ and [Ru(tpy)(bpz)(OH2)]2+……….……. 196 Figure 4.6. Single-site water oxidation catalysts……….. 198 Figure 4.7. X-ray structure of the trans-[Ru(tpy)(Mebim-py)(OH2)]2+ cation in the
salt trans-[Ru(tpy)(Mebim-py)(OH2)](ClO4)2……….….. 200
Figure 5.1. Spectral changes following the addition of 30 equivalents of Ce(IV) to a solution containing 1.25 x 10⁻⁵ M (H2O)RuIIIORuIII(OH2)4+ and
1.25 x 10⁻⁵ M [Ru(bpy)2(bpm)]2+ as redox mediator in 0.1 M HNO3……... 217 Figure 5.2. Spectral changes following the addition of 30 equivalents of Ce(IV) to
a solution containing 1.25 x 10⁻⁵ M (H2O)RuIIIORuIII(OH2)4+ and
1.25 x 10⁻⁵ M [Ru(bpy)2(bpz)]2+ as redox mediator in 1.0 M HNO3………. 218 Figure 5.3. A). Scan rate normalized (ip/v1/2) cyclic voltammograms (CVs) of
1 mM Blue dimer in 0.1 M triflic acid (HOTf) at an ITO electrode (1.55 cm2) at scan rates of 10 and 1000 mV/s, 23 ± 2 oC. A CV (ip/v) of
surface-adsorbed [Ru(4,4’-((HO2)2P(O)CH2)2bpy)2(bpy)]2+ on ITO (ITO-Ru2+), Г = 1.0 x 10⁻¹⁰ mol/cm2, 1.55 cm2, is shown in blue. B). CVs (ip/v1/2) of 1.0 x 10⁻⁴ M blue dimer in 0.1 M HOTf at ITO-Ru2+
( = 1.0 x 10⁻¹⁰ mol/cm2, 1.5 cm2) at various scan rates………223 Figure 5.4. Surface coverage isotherm for surface-adsorbed
[Ru(4,4’-((HO2)2P(O)CH2)2bpy)2(bpy)]Cl2 on ITO, determined by cyclic
voltammetry in 0.1 M HNO3 at 23 ± 2 oC………. 224 Figure 5.5. CVs of the peroxido intermediate formed by addition of x3 Ce(IV) to
1.0 x 10⁻⁴ M [(H2O)RuIIIORuIV(OH)]4+ in 0.1 M HOTf with surface adsorbed [Ru(4,4’-((HO2)2P(O)CH2)2bpy)2(bpy)]2+
on ITO (Γ = 1.0 x 10⁻¹⁰
mol/cm2; 1.52 cm2)………... 227 Figure 5.6. (A) Concentration dependence of limiting currents for water oxidation
by controlled potential electrolysis in stirred solutions of 0.25 mM, 0.5 mM, and 0.75 mM [(bpy)2(H2O)RuIIIORuIV(OH)(bpy)2]4+ in
0.1 M HOTf with 2.5 x 10⁻⁵ M [Ru(4,4’-((HO2)2P(O)CH2)2bpy)2(bpy)]2+ in the external solution (4 ml total volume) at
xviii
versus NHE. The solutions were stirred by a magnetic stir bar at rates sufficient that ilim was independent of stir rate. (B) kobs = kact values calculated from the expression rate = kcat[(H2O)RuIIIORuIV(OH)4+] = ilim/nFΓA with ilim the limiting current, kcat the catalytic rate constant, A the electrode surface area, and n = 4, the electrochemical
stoichiometry. For the electrode reaction, kobs = kcat = kETKA, with kET the electron transfer rate constant and KA the association complex
constant between ITO-Ru2+ and [(H2O)RuIIIORuIV(OH)]4+……….. 228 Figure 5.7. Scan rate normalized cyclic voltammograms of 1 mM Blue dimer in
0.1 M HClO4 at ITO-[Ru(4,4’-((HO2)2P(O)CH2)2bpy)2(bpy)]2+ (Γ ~ 1x10⁻¹⁰
mol/cm2; 1.47 cm2)……… 229 Figure 6.1. (A) Structures of tpy and Mebimpy. (B) Redox mediator-water
oxidation catalyst assembly (2-(PO3H2) anchored to a metal oxide
electrode………. 240 Figure 6.2. (A)Absorbance-time trace at 546 nm for 1 following addition of 10
equivalents of Ce(IV) to [(bpy)2RuII(bpm)RuII(tpy)(OH2)]4+ in 0.1 M HNO3 at 298 K. The fit of the absorbance-time trace to the mechanism in Scheme 1 is shown with k1 = 2.1×10³ M-1s-1;
k2 = 390 M-1s-1; k3 = 104 M-1s-1; kO-O = 1.9×10⁻³ s-1 and k4 = 40 M-1s-1. (B) As in A), spectra of intermediates obtained by stopped flow
measurements during the course of the reaction……… 244 Figure 6.3. Electrolysis of 1-(PO3H2) anchored to FTO at 1.8 V in 1.0 M HClO4.
Number of turnovers: 8,900; TOF = 0.3 s-1; current density ~
6.7 A/cm2; ~ 7×10-11 mol/cm2; A = 1.95 cm2……….. 245 Figure 7.1. Proposed surface binding modes of phosphonic acid groups at a
metal oxide surface. (a) monodentate, (b) and (c) bidentate, and
(d) tridentate………... 251 Figure 7.2. Isotherm - surface coverage (mol/cm2) vs. concentration of stock
solution (M) containing [Ru(4,4’-(H2O3P)2-bpy)2(bpy)]Cl2 in
0.1 M HNO3………... 258 Figure 7.3. Surface loading (mol/cm2) vs. time for the [Ru(bpy)3]2+ series with
4,4’-(H2O3PCH2)2-bpy on ITO……….. 260 Figure 7.4. E1/2-pH diagram of [Ru(4,4’-(H2O3PCH2)2-bpy)n(bpy)3-n]2+ series on
ITO, ionic strength was kept constant at1.0 M with LiClO4, 23 °C,
xix
Figure 7.5. [Ru(bpy)2(4,4’-(H2O3P)2-bpy)]2+ (1.0 x 10⁻⁴ M) in 0.1 M H3PO4 acidified to pH 1 with HNO3 containing 0.9 M NaClO4 supporting electrolyte. Left: dilution corrected raw data. Right: contributing
species ………... 266 Figure 7.6. Concentration vs. pH curves for different acid-base forms of
[Ru(bpy)2(4,4’-(H2O3P)2-bpy)]2+ (1.0 x 10⁻⁴ M) in 0.1 M H3PO4 acidified to pH 1 with HNO3 containing 0.9 M NaClO4 supporting
electrolyte………... 266 Figure 7.7. [Ru(bpy)2(4,4’-(H2O3P)2-bpy)]2+ (1.0 x 10⁻⁴ M) in 0.1 M H3PO4
acidified to pH 1 with HNO3 containing 0.9 M NaClO4 supporting
electrolyte. Single wavelength fits………. 267 Figure 7.8. [Ru(4,4’-(H2O3P)2-bpy)2(bpy)]2+ (1.0 x 10⁻⁴ M) in 0.1 M H3PO4
acidified to pH 1 with HNO3 containing 0.9 M NaClO4 supporting electrolyte. Left: dilution corrected raw data. Right: contributing
species ………... 268 Figure 7.9. Concentration vs. pH curves for different acid-base forms of
[Ru(4,4’-(H2O3P)2-bpy)2(bpy)]2+ (1.0 x 10⁻⁴ M) in 0.1 M H3PO4 acidified to pH 1 with HNO3 containing 0.9 M NaClO4 supporting electrolyte………... 268 Figure 7.10. [Ru(4,4’-(H2O3P)2-bpy)2(bpy)]2+ (1.0 x 10⁻⁴ M) in 0.1 M H3PO4 acidified
to pH 1 with HNO3 containing 0.9 M NaClO4 supporting electrolyte.
Single wavelength fits……… 269 Figure 7.11. [Ru(bpy)2(4,4’-(H2O3PCH2)2-bpy)]2+
(2.0 x 10⁻⁴ M) in 0.1 M H3PO4 acidified to pH 1 with HNO3 containing 0.9 M NaClO4 supporting electrolyte. Left: dilution corrected raw data. Right: contributing
species... 270 Figure 7.12. Concentration vs. pH curves for different acid-base forms of
[Ru(bpy)2(4,4’-(H2O3PCH2)2-bpy)]2+ (2.0 x 10⁻⁴ M) in 0.1 M H3PO4 acidified to pH 1 with HNO3 containing 0.9 M NaClO4 supporting
electrolyte………... 271 Figure 7.13. [Ru(bpy)2(4,4’-(H2O3PCH2)2-bpy)]2+
(2.0 x 10⁻⁴ M) in 0.1 M H3PO4 acidified to pH 1 with HNO3 containing 0.9 M NaClO4 supporting
electrolyte.Single wavelength fits……….. 272 Figure 7.14. [Ru(4,4’-(H2O3PCH2)2-bpy)2(bpy)]2+ (1.13 x 10⁻⁴ M) in 0.1 M H3PO4
acidified to pH 1 with HNO3 containing 0.9 M NaCl supporting electrolyte. Left: dilution corrected raw data. Right: contributing
xx
Figure 7.15. Concentration vs. pH curves for different acid-base forms of [Ru(4,4’-(H2O3PCH2)2-bpy)2(bpy)]2+
(1.13 x 10⁻⁴ M) in 0.1 M H3PO4 acidified to pH 1 with HNO3 containing 0.9 M NaCl supporting
electrolyte………... 274 Figure 7.16. [Ru(4,4’-(H2O3PCH2)2-bpy)2(bpy)]2+ (1.13 x 10⁻⁴ M) in 0.1 M H3PO4
acidified to pH 1 with HNO3 containing 0.9 M NaCl supporting
electrolyte. Single wavelength fits………. 274 Figure 7.17. [Ru(4,4’-(H2O3PCH2)2-bpy)3]2+ (1.1 x 10⁻⁴ M) in 0.1 M H3PO4
acidified to pH 1 with HNO3 containing 0.9 M NaClO4 supporting electrolyte. Left: dilution corrected raw data. Right: contributing
species……… 275 Figure 7.18. Concentration vs. pH curves for different acid-base forms of
[Ru(4,4’-(H2O3PCH2)2-bpy)3]2+ (1.1 x 10⁻⁴ M) in 0.1 M H3PO4 acidified to pH 1 with HNO3 containing 0.9 M NaClO4 supporting
electrolyte………... 276 Figure 7.19. [Ru(4,4’-(H2O3PCH2)2-bpy)3]2+ (1.1 x 10⁻⁴ M) in 0.1 M H3PO4 acidified
to pH 1 with HNO3 containing 0.9 M NaClO4 supporting electrolyte.
Single wavelength fits……… 276 Figure 7.20. [Ru(4,4'-(H2O3P)2-bpy)2(bpy)]2+ -10 mol/cm2),
soaked in 0.001 M [Ru(Mebimpy)(bpy)(OH2)]2+ in 0.025 M pH 5 acetate buffer (~4 h). CVs measured in clean 0.1 M pH 5 acetate buffer. (A) CV at scan rate = 100 mV/s. (B) Plot of oxidative current (ia) of first
Ru(III/II) wave vs. scan rate (V/s): R = 0.99996………... 280 Figure 7.21. Normalized CVs (current divided by scan rate). [Ru(4,4'-(H2O3P)2
-bpy)2(bpy)]2+ on ITO ( = 1.0 x 10⁻¹⁰ mol/cm2), soaked in 0.001 M [Ru(Mebimpy)(bpy)(OH2)]2+ in 0.025 M pH 5 acetate buffer (~4 h).
CVs measured in clean 0.1 M pH 5 acetate buffer. Scan rates shown…….. 281 Figure 7.22. [Ru(4,4'-(H2O3P)2-bpy)2(bpy)]2+ on ITO, soaked in 0.001 M
[Ru(Mebimpy)(bpy)(OH2)]2+ in 0.025 M pH 5 acetate buffer (~4 h). CVs in 0.1 M pH 5 acetate buffer following a controlled potential electrolysis (CPE) at 1.71 V vs. NHE for ~3100 s. (A) Scan rate normalized CVs (current divided by scan rate). (B) A plot of the
oxidative peak potential of the catalyst Ru(III/II) wave vs. scan rate……... 283 Figure 7.23. [Ru(4,4'-(H2O3P)2-bpy)2(bpy)]2+ on ITO, soaked in 0.001 M
[Ru(Mebimpy)(bpy)(OH2)]2+ in 0.025 M pH 5 acetate buffer (~4 h). CVs in 0.1 M pH 5 acetate buffer following a controlled potential
xxi
Figure 7.24. [Ru(bpy)2(4,4’-(H2O3P)2-bpy)]2+ ( = 1.0 x 10⁻¹⁰ mol/cm2) on ITO in 0.075 M CF3SO3Na and 0.025 M phosphate buffer. Repeated cyclic
xxii
LIST OF SCHEMES
Scheme 2.1. Computational models of the blue dimer electronic structure………... 44 Scheme 2.2. Comproportionation in a mixed valence system……… 87 Scheme 3.1. Generic scheme of catalyzed Ce(IV)-driven water oxidation ………... 109 Scheme 3.2. E1/2 potentials in 0.5 M CF3SO3H, given in V vs. Ag/AgCl……….. 154 Scheme 3.3. Proposed mechanism involving covalent hydration and a transient
ligand radical in blue dimer catalyzed water oxidation………. 171 Scheme 3.4. Mechanism of Ce(IV)-driven water oxidation by the blue dimer in
1.0 M CF3SO3H (and 1.0 M HClO4)………. 178 Scheme 3.5. Coordination expansion and 18O labeling in RuIVORuIV………... 179 Scheme 3.6. Proposed mechanism of catalytic water oxidationby the blue dimer
(protonation states of each intermediate are shown for pH 1)………... 180 Scheme 5.1. Mechanism of Ce(IV)-driven water oxidation by the Blue Dimer…….…... 210 Scheme 5.2. Blue dimer catalyzed Ce(IV) water oxidation utilizing redox mediators….. 219 Scheme 5.3. Electrochemically driven water oxidation by the blue dimer with
added redox mediators………... 220 Scheme 6.1. Reactions and rate constants for water oxidation by
xxiii
LIST OF SYMBOLS AND ABBREVIATIONS
A ampere
A area
AM air mass
Appx. Appendix
cm centimeter
EPR electron paramagnetic resonance
eV electron-volt
G global
HOMO highest occupied molecular orbital
i current
IR infrared
ITO tin-doped indium oxide
K Kelvin
LUMO lowest unoccupied molecular orbital
m meter
M molar
ms millisecond
NHE natural hydrogen electrode
nm nanometer
r radius
s second
xxiv
T tesla
TW terawatt
UV ultraviolet
V volt
Vis visible
W watt
XRD x-ray diffraction
Å angstrom
° or deg degrees
molar extinction coefficient surface coverage
A microampere
s microsecond
CHAPTER 1
2
The best candidate for an environmentally benign, sustainable replacement of fossil
fuels is solar energy, an inexhaustible resource that supplies 120,000 TW of electromagnetic
radiation to the earth per annum. Solar energy is most commonly converted into electricity
using photovoltaic cells and dye-sensitized photoelectrochemical cells - the so-called Grätzel
cells. Photons are captured with these cells as absorbed light excites electrons to create
electron-hole pairs which are separated and driven in opposite directions to generate current.
Lifetimes approaching 30 years and efficiencies of 15 to 20% have been obtained with
first-generation photovoltaic cells made from expensive poly-crystalline silicon.1 Although
eighty-five percent of the commercial solar cell market is comprised of first-generation
photovoltaics, their high manufacturing cost has prevented widespread implementation. More
affordable materials have been pursued, such as amorphous or nanocrystalline Si,2-5 CdTe,6-8
and CuInSe2.9 However, these materials have been plagued by low efficiencies due to an
observed decrease in device performance with lower material purity.
In photovoltaics, electron-hole pairs are formed by direct band gap excitation of the
semiconductor. Subsequent charge separation is achieved with a p-n junction that is usually
introduced by doping, or with a Schottky junction that utilizes differences in the work
function of specific materials.10-12 Consequently, an internal electric field is formed that
directs conduction band electrons toward the n-type region, whereas a preference for valence
holes is indicative of the p-type region. The photogenerated charges flow in opposite
directions; the resulting asymmetry produces electrical current accompanied by a potential
difference at the external electrodes, which can be applied to a load. One limitation of direct
band gap excitation is the discrimination of absorbed light, such that only incident light of
3
edges will be absorbed. Wavelengths of higher energy create “hot carriers” or “hot excitons”
that relax through electron-phonon scattering modes in pico- to subpicosecond time regimes
to release the excess kinetic free energy as heat.13-15 A significant amount of the available
light energy, ranging from 0.5 to 3.5 eV in the solar spectrum,16 (Figure 1.1) is dissipated as
heat in this manner, or not absorbed at all. Assuming comprehensive carrier cooling along with
the narrow light selectivity of photovoltaics, a maximum thermodynamic efficiency of ~33%
is possible.17
Figure 1.1.18 Photon flux of the AM 1.5 G spectrum at 1000 W m-2 (ASTM G173-03), and calculated accumulated photocurrent.18
The thickness of the cell dictates the amount of light that will be absorbed, which
decrees an optimal thickness for light harvesting and collection of electron-hole pairs. The
constraint being that electron-hole pairs have a discrete lifetime before recombination occurs
and, consequently, must diffuse to the electrical junction prior to this nonproductive process.
4
defects in the material that obstruct the separation of electron-hole pairs causing shorter
lifetimes and a higher degree of charge recombination. To circumvent the expense of high
purity materials, research is underway to reduce the necessary distance for charges to travel
within the semiconductor by designing specifically-oriented, structural features, such as high
aspect-ratio nanorods,19-22 into the material morphology. The rods then maintain the
thickness component of the semiconductor material to maximize light harvesting, but the
electron-hole pairs can also reach the electrical junctions by traveling orthogonally to the
long dimension of the rod and out radially along the short axis.1 Structural features can also
enhance light absorption by allowing incident photons to be reflected or diffracted back into
the material for subsequent absorption rather than being lost by the same processes at a
planar surface where such recycling is not possible.22-25 Dye-sensitized photoelectrochemical
(DS-PEC) cells represent another route toward a low-cost device for converting solar energy
to electricity. These cells are commonly referred to as photogalvanic cells or Grätzel cells
after Michael Grätzel who has pioneered their development over the last twenty years.26-31
DS-PEC cells are characterized by a mesoscopic, semiconducting metal oxide film in
which a monolayer of dye has been attached to the surface by some functional group (such as
carboxylic acids,32-34 phosphonic acids,35-39 siloxanes,40-43 acetylacetonates,44,45 amides,46-48
or boronic acids49) imparting high stability in a range of appropriate media for these cells.
This functionalized metal oxide film operates as a photoanode and is placed in contact with a
redox active electrolyte or a hole conducting organic layer that bridges a gap to a separate
counter electrode that is also connected to the photoanode by an external wire, thus
completing a circuit, see Figure 1.2. Stable, wide band gap semiconductors are used in these
5
also been studied.29,58,59 Sensitization is the process of generating photocurrent with light
energy that is less than the semiconductor band gap, and light-absorbing dyes used in this
manner are called sensitizers. The dye absorbs light to form an excited state that undergoes
reductive quenching, on the femto- to picosecond time-scale, via electron injection to the
metal oxide conduction band.14,60 A built-in inhibition to back electron transfer arises from
the absence of energy levels in the semiconductor band gap.61 Next, the oxidized dye is
reduced by electron transfer from the electrolyte, typically the iodide/triiodide couple, eq. 1,
in an organic solvent, such as acetonitrile.
I3– + 2e– ↔ 3I– (1)
Back electron transfer of the photo-injected electron to the oxidized sensitizer is avoided
when regeneration of the dye occurs from iodide, I–. The latter process is faster and
exemplifies one of many favorable kinetic phenomena that operate in the Grätzel cell, Figure
1.2.30,60 Subsequent reduction of the triiodide at the chemically-inert counter electrode,
typically containing a catalytic amount of platinum, regenerates iodide after intervening
electron migration through the external wire. The energy difference between the Fermi level
of the photoanode and the redox potential of the electrolyte, I3–/I– in this case, establishes an
6
E
(S
+/S)
(S
+/S*)
(I
-/I
3-)
photoanode
counter
electrode
load
e
-e
-e
-e
-e
-7 5
1
4 3
2
TiO
26
dye
redox
electrolyte
Figure 1.2. An illustration of a conventional dye-sensitized solar cell and its relative energetics, reaction kinetics, and electrode current densities. The processes are: (1) initial light absorption of the sensitizer, followed by (2) rapid excited-state electron injection into the TiO2 conduction band with k = 1010 - 1012 s-1 (3) back electron transfer to oxidized donors, I3– (4) charge recombination of injected electrons with oxidized sensitizers, k = 106 s-1 (5) electron migration through the TiO2 film, k = 10 - 103 s-1 (6) reduction of triiodide at the counter electrode (7) regeneration of the oxidized dye by iodide with k = 108 s-1. The current density at the photoanode is j0 = 10-11 - 10-9 A/cm2 and at the counter electrode, j0 = 10-2 - 10-1 A/cm2.60,62 Competing processes are indicated by the dashed arrows.
Anatase TiO2 nanocrystals of 20 nm diameter, that have shown the best performance,
are spread on a conducting glass electrode and annealed at 450 °C in a short sintering process
to establish an interconnected film of electronically-coupled particles.63 The advent of
sponge-like, nanostructured films of high surface area26 was a substantial breakthrough in the
7
attached to a flat semiconductor surface is extremely low.64 The optical density of a
two-dimensional cross section of a standard DS-PEC cell relative to a planar metal oxide surface
is >102 higher with typical values being ~5.0 x 10⁻⁸ mol/cm2 and ~1.0 x 10⁻¹⁰ mol/cm2,
respectively.65 Electron percolation through the TiO2 network66 is facilitated by charge
compensating cations in the electrolyte.67 Interpenetrating cations screen the
negatively-charged electron by shadowing its migration through the film, thereby eliminating the
internal field along with associated drift term that would appear in the relationship describing
charge transport.60 In the absence of this effect, movement of electrons throughout the
material would be impeded where the Coulombic potential of percolating electrons is
accompanied by an uncompensated local space charge. Electrons migrate rapidly through the
TiO2 layer with a diffusion coefficient of 10-4 cm2 s-1, which translates to a 10 ms traverse of
a 10 µm thick film. Note that the electrochemical potential of the electron is maintained
during diffusion.30
Electron injection from the excited state sensitizer is in competition with radiative as
well as nonradiative deactivation pathways. This deleterious decay occurs with rapid kinetics
ranging from 103 to 1010 s-1.15,60 Thus, injection kinetics need to be much faster so that a high
quantum yield for electron transfer to the conduction band is obtained. The nature of the
functional group providing surface attachment becomes a critical element in cell design as it
relates to the degree of electronic coupling between the lowest unoccupied molecular orbital
(LUMO) of the dye and the conduction band of the metal oxide.15,35,60,68,69 Stability is also
tied to this chemical interaction between the dye and exposed titanium atoms. For practical
application, device performance should be consistent for at least twenty years, which
8
A number of areas have been heavily researched to improve the efficiencies of
Grätzel cells – new semiconductors,29,58 sensitizers,70-75 redox electrolytes,76-83 functional
groups for surface attachment.18,31 However, energy storage is a lingering issue with these
systems; sunlight is diffuse (~170 W m-2) and intermittent, requiring its efficient storage
before the sun can be used to power human civilization day and night, rain or shine.1 The
electrical output of solar cell technology can be coupled to catalysts for the production of
solar fuels, but sequential conversion from solar energy to electrical energy to chemical
energy is inundated by the cumulative device inefficiencies.84 Commercial water
electrolyzers that catalyze water splitting, i.e. 2H2O → 2H2 + O2, operate at ~70% energy conversion efficiency, hence H2 production can be achieved with an overall competence of
~12%.85 Manufacturing costs along with inefficiencies in conversion and storage have to be
reduced before large-scale fuel production becomes viable. Inexpensive, robust catalysts
exhibiting low overpotentials and kinetically facile chemical transformations are required to
improve these conversions toward far-reaching commercial expediency.86 Solar fuel can also
be generated from the reduction of CO2 to generate chemicals such as methane, methanol, or
higher order hydrocarbons. CO2 also represents an abundant C1 substrate that can be
exploited in value added synthesis as a cheap chemical feedstock; its utilization would
inherently reduce its atmospheric concentration. In principle, the direct conversion from solar
energy to solar fuels could be achieved with higher overall efficiencies by omitting the
transitional step through electricity.84 Nature has provided a blueprint for how one might go
about this process.
In biology, the water-splitting reaction is accomplished by oxygenic photosynthesis.
9
apparatus of green plants, molecular oxygen is released at the Oxygen Evolving Complex
(OEC) according to the reaction in eq. 2.
2H2O → O2 + 4H+ + 4e– (2)
Figure 1.3.87 Crystal structure of the Photosystem II dimer within the thylakoid membrane at 3.5 Å resolution. Helices are represented as cylinders. All protein subunits, and cofactors assigned by Ferreira and coworkers.87
Single-electron activation of the OEC transpires via the Kok cycle beginning with state S0
and culminating with oxygen evolution from the transient S4 state after 4e– and 4H+ have
been removed.88 The reductive equivalents are used to drive the synthesis of adenosine
triphosphate (ATP) and nicotinamide adenine dinucleotide phosphate (NADPH), by ATP
synthase and Photosystem I, respectively. Chemical energy is thereby produced from solar
energy; a subsequent reaction, spurred by ATP and NADPH, occurs to reduce CO2 to
10
impressive 4.56 eV per cycle in two photogenerated NADPH molecules, in addition to seven
equivalents of ATP with 7.5 kcal/mol stored/ATP.84
The machinery of photosynthesis is housed in organelles called chloroplasts; a single
cell found in the leaves of green plants can have from 1 to 1000 of these. A phospholipid
membrane provides the exterior shell of the ~5 µm ellipsoidal chloroplast structure, and
within this casing, an aqueous fluid called the stroma is present. Long thylakoid “floors”
called lamella are arranged within the stroma that allow flattened disc-like structures bound
by a thylakoid membrane to stack into columns called grana, as shown in Figure 1.4.
Figure 1.4.89 Chloroplast from corn. (a) An electron micrograph. (b) Schematic diagram.89
Embedded within the thylakoid membrane are four major protein complexes: Photosystem I,
Photosystem II, cytochrome b6f, and ATP synthase. The thylakoid lumen is a fluid contained
within the sac formed by the thylakoid membrane. Nearly 100% of the energy input for life
on earth is provided by the solar fuel produced from this complex, three-dimensional
11
Figure 1.5. Schematic illustration showing the integrated components of oxygenic photosynthesis embedded in the thylakoid membrane.90
Shortly after nature was able to use water as a source of protons and electrons,
oxygen-dependent life forms appeared on Earth.91 This overall process is essential for life as
we know it, providing oxygen as a metabolic oxidant and maintaining the earth’s atmosphere
in its current constitution.92 Natural photosynthesis is initiated by light absorption by a
chlorophyll pigment, P680, that results in an excited state (P680*). The excited electron is then
quenched by a nearby electron acceptor molecule, pheophytin, and sent “downhill” toward
Photosystem I on a wireless electron transport chain. Following pheophytin, the electron is
shuttled to a neighboring benzoquinone acceptor, QA. The resulting charge separated state,
P680+ - QA•–, has a physical separation of ~17.5 Å and transiently stores ~1.4 eV of free
energy, having been converted from the 1.8 eV of solar energy captured in the initial excited
state. The electron transfers are driven by a free energy gradient through a series of
12
to increase the lifetime of the charge separated state. Recombination is in competition with
using the energy for productive chemistry, where back electron transfer only produces local
heating and wasted redox equivalents. The hole, or the oxidized chlorophyll P680, is reduced
on the donor side of P680 by long-range proton-coupled electron transfer oxidation of a
tyrosine residue, Yz, ~10 Å away. E°’ of the (P680+/P680) couple is 1.2 V vs. NHE; notice that
it is a strong oxidant, thermodynamically capable of oxidizing water with E°’ (O2/H2O) =
0.82 V at pH 7. This portion of the electron transport chain is necessarily shorter in this
direction (between the chlorophyll pigment and the OEC), in order to maintain a
thermodynamically-sufficient oxidizing hole. Tyrosine Yz is hydrogen bonded through its
phenolic hydrogen to the imidazole nitrogen of a histidine residue, His191.93,94 A scheme of
the electron transport chain is shown in Figure 6. Oxidation of tyrosine Yz by P680+ is
relatively slow with k ~ 107 s-1, but highly effective with a per photon adsorbed efficiency of
η ~ 0.9. Favoring this process is the much slower (k ~ 7 x 10³ s-1) back electron transfer
recombination of the P680+ - QA•– charge separated state. Back electron transfer is slowed
dramatically by the long distance involved and the inverted region arising from the highly
favorable ∆G°’.84 In the inverted region, the sum of inner-sphere and outer-sphere
reorganization energy (λ = λi + λo) is lower in energy than the driving force (∆G°) for
electron transfer, such that the rate of electron transfer and non-radiative decay actually slow
13 0.8 0.4 -0.4 -0.8 -1.2 0
E0 (V) H2O
Mn center z
P680
proton gradient O2 +
P680*
hν1
QA QB Ph QH2 Cytochrome bf complex proton gradient PC P700 hν2 P700* A0 A1 Fe-S Fd Fp NADP+ proton gradient
Photosystem II Photosystem I
Figure 1.6. Detailed energy diagram (V vs. NHE) of electron transport chain, commonly referred to as the Z-scheme, of photosynthesis.89
Nevertheless, the oxidation of tyrosine, Yz, increases the distance between redox
equivalents to ~28 Å in the new charge separated state, Yz•+ - QA•–. Recombination is further
slowed to make sufficient time available for oxidative activation of the OEC, the water
oxidizing reaction center of Photosystem II. The tyrosine, Yz, is spatially separated from the
nearest Mn ion of the [CaMn4] cluster by around 7 Å.94,96 This first electron transfer
activation of the OEC by Yz•+ initiates the Kok cycle for water oxidation. Activation of the
OEC is relatively slow, ranging from 0.1 to 1 ms depending on the specific step within the
14
Figure 1.7.97 The Kok cycle of Photosystem II showing the five steps involved in the four photon process of water oxidation, the proton loss in each transition, and the corresponding reaction half-times. Oxidation of the OEC is mediated by the redox active tyrosine Yz.97
Thus, QA•– reduces proximate electron acceptor, QB, a plastoquinone, to lengthen the charge
separation to around 50 Å. A second reduction of QB•–, accompanied by two protons
originating from the stroma, takes place in the second stage, S1→ S2, to give the reduced plastoquinol, H2QB.This mobile electron-proton carrier then diffuses through the thylakoid
membrane to the cytochrome b6f complex (plastoquinol-plastocyanin reductase) where it is
oxidized back to QB resulting in reduced Cu(I) plastocyanin.84 The energy released in the
thermodynamically favored electron transfer is used to translocate the protons supplied by
H2QB from the stroma into the lumen. In this manner, cytochrome b6f acts as a proton pump,
15
chain to Photosystem I via plastocyanin. This begins a process in which a proton gradient is
established, which is ultimately used for the synthesis of ATP.
ATP synthase and cytochrome b6f work in concert to generate ATP in a process
called photophosphorylation. Electron transfer along the electron transport chain produces an
electrochemical potential gradient (∆Ψ) that is coupled to the translocation of protons by
cytochrome b6f across the thylakoid membrane. As cytochrome b6f pumps protons from the
lumen to the stroma, the ensuing proton gradient (∆pH) creates a proton-motive force (pmf)
that is used to drive ATP synthase to form ATP from adenosine diphosphate (ADP) and
inorganic phosphate (Pi). Electrical neutrality is avoided to allow the accumulation of
∆Ψ and ∆pH, both of which are needed to establish pmf. A key function of membrane
compartmentalization in biological systems is maintaining these gradients, or imbalances. At
the heart of bioenergetics is the coupling of a thermodynamically favorable reaction with a
thermodynamically unfavorable reaction, such that the overall free energy of the system
decreases, allowing the desired work to be accomplished. For example, a high-energy state
transitions to a lower-energy state in order to afford uphill reactions such as charge
separation and osmotic gradients.85
A continuous stream of protons is supplied to the lumen (~pH 4) from water
oxidation at the OEC and is consumed in the terminal proton-coupled reduction of NADP+ to
NADPH. Electrons supplied, ultimately from water, to cytochrome b6f and onto Photosystem
I through the mobile, water-soluble plastocyanin culminate at chlorophyll, P700. Subsequent
light absorption takes places at P700 to enhance the reducing strength of the electrons prior to
the reduction of NADP+ to NADPH by ferredoxin: NADP+ oxidoreductase. Once ATP and
16
known as the Calvin cycle. The overall conversion of solar energy to chemical energy
executed in natural photosynthesis is given in eq. 3.
6CO2 + 6H2O + 24hν→ C6H12O6 + 6O2 ; ∆G°’ = 29.1 eV, n = 24 (3)
A closer examination of chlorophyll reveals many pigment molecules arranged to
form a light harvesting antenna that serves to increase the absorption cross section. Light
absorption is then found to initiate an excited state that after a series of energy transfer steps
is funneled to a reaction center where charge separation takes places. Covalent bonds arrange
the pigments spatially to account for intermolecular distance, relative angles, and electronic
coupling. Two different energy transfer mechanisms, identified as Dexter and Förster, are
possible in any given system. Dexter energy transfer occurs between chromophores that have
sufficient orbital overlap following van der Waals contact.93 This is otherwise known as
electron superexchange and bears a distance dependence that decays by e-2r (where r equals
radius) as the orbital overlap decreases. Förster energy transfer is a through-space mechanism
with r-6 dependence that originates from nonradiative coupling of a donor emission dipole
and an acceptor absorption dipole. Weaker distance dependence is observed in this
mechanism, allowing Förster energy transfer to occur over much longer distances.98 A lot of
flexibility is offered between the two mechanisms for designing light harvesting arrays that
can take advantage of bridging ligands and distance in order to direct excited state energy
transfer to a specific location.
Recent spectroscopic studies and X-ray diffraction of Photosystem II reveals a
complex structure that enables the management of protons and electrons exiting the active
site.87,99-103 The OEC consists of a Mn3Ca cluster in a cubic arrangement with oxygen atoms
17
Mn in the cluster. Oxygen is thought to evolve at this dangling Mn.87,100,101,103,104 The OEC is
an intricate structure that has been described as being “wired for protons”.94 A proton
transport chain is directed away from the OEC to manage protons through their transfer along
a series of Lewis basic amino acid residues that line a hydrophilic channel. In a matter of ~10
µs, protons navigate 30 Å along the proton exit channel to reach the lumen.94 The lengths
that photosynthesis goes to in establishing pmf explicate the importance of proton
management. Furthermore, proton coupled electron transfer (PCET) plays an important role
in the light-driven reactions of photosynthesis.94
PCET broadly refers to reactions in which both electrons and protons are transferred.
This involves the stepwise reactions: proton transfer following by electron transfer (PT-ET)
and electron transfer followed by proton transfer (ET-PT), as well as a third,
mechanistically-distinct pathway characterized by the simultaneous movement of a proton and an electron.
This concerted process is identified as coupled-electron proton transfer (EPT).105-119 EPT is
different from H-atom transfer (HAT) or hydride transfer in which both the electron and
proton are transferred from the same chemical bond. Mechanistically, EPT is distinguished
by electrons and protons transferring from different orbitals on the donor to different orbitals
on the acceptor.96 There are design elements to consider originating from the intrinsic mass
difference between protons and electrons, and the required overlap of their respective
donor-acceptor wavefunctions. Their coupled long-range transfer requires an architectural scaffold
that facilitates this process. Protons can tunnel over a limited distance of only a few
angstroms, whereas tens of angstroms can be tunneled by electrons. Therefore, nature
18
short-range proton transfers using hydrogen bonding.85 This is clearly demonstrated in the
proton transport channel trailing away from the OEC.
There are thermodynamic and kinetic implications associated with PCET. Kinetically
inhibited pathways and high energy intermediates in reactions involving protons and
electrons can be avoided when the concerted mechanism is available.84,96,105,106 Charge
accumulation is also avoided in PCET reactions as electrons and protons are lost. Consider
the oxidation of [RuII(bpy)2(py)(OH2)]2+ to [RuIII(bpy)2(py)(OH)]2+ to [RuIV(bpy)2(py)(O)]2+
where the overall charge is maintained over two adjacent redox couples.96,105 The separation
between these redox couples is a mere 0.11 V. Adjacent metal couples in which charge
build-up is observed typically have ∆E°’ ranging from 0.5 to 1.5 V. The Ru(IV/III) and Ru(III)/II)
couples in Ru(bpy)2Cl2 have ∆E°’ = 1.7 V.84 “Redox potential leveling” is a term used to
describe the occurrence of closely spaced redox couples that originate from PCET
reactions.106 PCET occurs due to the decreased electron content and its effect on the pKa
properties of the molecule having acidic protons. The narrow potential range between redox
couples in cis-Ru(bpy)2(py)(OH2)2+ points to the significant stabilization of Ru(IV), which
arises from proton loss and oxo formation. An orbital basis for this behavior is described in
Figure 1.8. The multiple bonding Ru=O interaction is manifest by the overlap between dπ
orbitals on Ru and the 2pπ orbitals on oxygen. The spO and pπ,O electron pairs on oxygen are
available for electron donation and orbital interaction with the vacant dπ* orbitals, which are
largely 4dRu in character. The dπn orbitals are also largely 4dRu in nature, but are of the wrong
19
Figure 1.8.105 RuIV=O2+ schematic energy orbital diagram.105
Illustrated in Figure 1.9 is the comproportionation reaction of cis-RuII(bpy)2(py)(OH2)2+ and
cis-RuIV(bpy)2(py)(O)2+ (bpy = 2,2’-bipyridine and py = pyridine) to generate two
equivalents of cis-RuIII(bpy)2(py)(OH)2+.120-122 Three possible mechanisms are described: (a)
electron transfer followed by proton transfer, (b) proton transfer followed by electron
transfer, and (c) concerted electron-proton transfer. The net reaction is the same in each case,
but the energetics explain why the only observable pathway in the comproportionation
reaction is the simultaneous transfer of the electron and proton. Specifically, the electron
transfers from dπRu(II) to dπ*Ru(IV) and the proton transfers from σO-H to pπO or sp2O. Reaction
(a) is accessible, but is uphill by at least 0.55 eV because RuIII-O+ is formed and the
estimated pKa for RuIII-OH22+ is >13. The experimental value of the reaction for ∆G≠ is
0.44 eV, excluding any significant contribution of pathway (a). An even less favorable
driving force (> 0.59 eV) is calculated for reaction (b) due to the low proton affinity of the
oxo group. The EPT pathway (c) is the low-energy mechanism and dominates the reactivity
20
Figure 1.9. Reaction scheme describing the proton-coupled electron transfer
comproportionation of cis-RuII(bpy)2(py)(OH2)2+ and cis-RuIV(bpy)2(py)(O)2+. ∆G°’ values are cited for each of the mechanistic possibilities (ET-PT, EPT, and PT-ET).105
PCET allows for the accumulation of multiple redox equivalents at a single site or
cluster. It is used extensively throughout biology, and is of paramount consequence in small
molecule activation and energy conversion. The proton-coupled electron transfer reaction of
tyrosine Yz with histidine His191 has been studied in detail, and plays an important role in the
oxidative activation of the OEC.94,123-125 Oxidation of tyrosine Yz involves the transfer of a
proton to His191. Oxidation of Yz is in competition with the charge recombination back
reaction between P680+ and the reduced quinone QA•–, requiring rapid kinetics. At full speed
Photosystem II can oxidize approximately 200 water molecules per second.1 Thermodynamic
values have been calculated showing the energetic advantage afforded by the coupled
movement of protons and electrons, where the EPT pathway is favored over the nearest
sequential pathway (ET-PT, PT-ET) by almost 0.5 eV. The pKa of 10 for the tyrosyl phenolic
21
EPT is utilized at the OEC during oxidative activation as well as in the
oxygen-oxygen bond forming step of water oxidation. Removal of the Ca ion from the coordination
sphere of the OEC, Mn4O4Ca cluster, has been shown to inhibit the S2→ S3 transition, where O···O coupling is thought to occur. This result, in conjunction with various spectroscopic
measurements that have focused our view of the OEC, indicate the appended Mn ion and Ca
ion are at the epicenter of water oxidation. Aqua ligands fill the coordination spheres of these
ions and an aspartate residue, Asp170, is found in close proximity. As the electron density in
the cluster decreases with each sequential oxidation, proton acidity increases, such that
MnIV=O is formed and proton loss, enabled by Asp170, gives Ca-OH–.94 Again, removal of
Asp170 disables the OEC toward water oxidation, emphasizing its contribution to the
observed reactivity.84 Nucleophilic attack by a lone electron pair of oxygen, originating from
the native Ca-OH2 group, on the electrophilic oxo substituent of the MnIV ion is proposed,
Figure 1.10. It follows then that a high energy Mn-(HOOH) intermediate would be
implicated after O-O bond formation without prior deprotonation of the Ca-OH2 substituent.
Asp170 provides an internal base, enabling a more energetically feasible pathway –
deprotonation of Ca-OH2 to Ca-OH– prior to O-O coupling. While the carboxylate anion, –
OOC-Asp170 (pKa 4-5), appears to be too far away for direct proton transfer from Ca-OH2,
hydrogen bonding to Asp170 by a second aqua ligand at the Mn ion likely mediates proton
transfer. Participation of Asp170 is further explained as alternative pathways invoking a
water molecule acting as a proton transfer agent are unfavorable in light of its pKa values,
pKa(H2O) = 15.7 and pKa(H3O+) = -1.74. Water is neither a good nucleophile nor a good
22
Ca2+(aq) equal to 9.7; conversely, oxidation of MnII-OH2 to MnIV=O gives water more
electrophilic character.94
Figure 1.10. Reaction scheme detailing the proposed oxygen-oxygen bond forming step of water oxidation in the OEC.94
Using nature as a guide, key features and underlying concepts gleaned from natural
photosynthesis can be implemented into strategies for the conversion of solar energy to
chemical fuels. In a breakthrough experiment, a short-lived charge separated state was
discovered in solution upon electron transfer quenching of excited state [Ru(bpy)3]2+* by
methylviologen (MV2+) and reduction of the resulting oxidized metal complex by
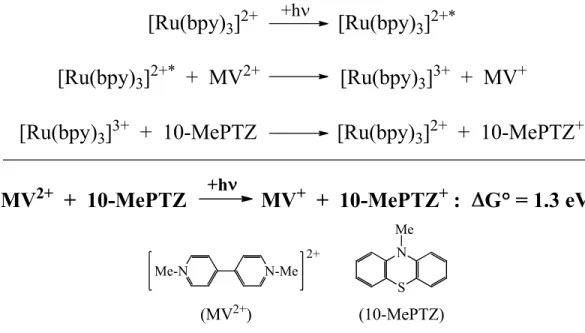
triphenylamine (NPh3).126 A similar experiment is described in Figure 1.11 using
10-methylphenothiazine (10-MePTZ), in which visible light is used to drive an endoergic
23
[Ru(bpy)
3]
2+ +h[Ru(bpy)
3]
2+*[Ru(bpy)
3]
2+*+ MV
2+[Ru(bpy)
3]
3++ MV
+[Ru(bpy)
3]
3++ 10-MePTZ
[Ru(bpy)
3]
2++ 10-MePTZ
+MV
2++ 10-MePTZ
MV
++ 10-MePTZ
+:
G = 1.3 eV
+h
Me-N N-Me
2+
(MV2+)
S N Me
(10-MePTZ)
Figure 1.11. Reaction scheme depicting energy conversion via a charge separated state promoted by excited-state electron transfer quenching.61
The photogenerated electron transfer products allowed the transient storage of 1.3 eV of
energy, but there was no directional control or molecular basis for storing or utilizing the
redox equivalents before recombination. This initial experiment, however, provided the basis
for a new field called artificial photosynthesis. Later a conceptual report outlining an
integrated modular assembly was introduced127 in order to emulate the fundamental steps
required for natural photosynthesis: 1) light absorption, 2) excited state electron transfer
quenching, 3) redox separation by electron transfer, 4) electron transfer activation of
catalysts, 5) repetition of steps 1-4 to accumulate multiple redox equivalents at catalyst sites,
and 6) subsequent reaction of the activated catalysts.61
Figure 1.12 illustrates two possible strategies toward the development of integrated
modular assemblies, each bearing key components of an artificial photosynthetic apparatus.
24
h
ν
D = Electron Donor
C = Chromophore
2 H
2O
4H
++O
2
++ 4 H
+2 H
+e
-e
-H
2C
Cat
OxD
A
Cat
Rede
-e
-Light
Harvesting
Antenna
Figure 1.12. Diagrams showing key features of potential photosynthetic devices. (Top) Photochemical water splitting into H2 and O2 with an integrated modular assembly detailing electron transfer events after excitation of the light harvesting antenna.61 (Bottom) A high surface area metal oxide has replaced the antenna array, and photochemical water oxidation is coupled to the reduction of CO2 to methane. Abbreviations are: CatOx = oxidation catalyst, CatRed = reduction catalyst, D = electron transfer donor, C = chromophore, A = electron transfer acceptor, and PEM = proton exchange membrane.61
In the top assembly, light absorption would likely require a light harvesting antenna to
achieve efficient operation. Solar energy is diffuse and the absorption cross-section of a

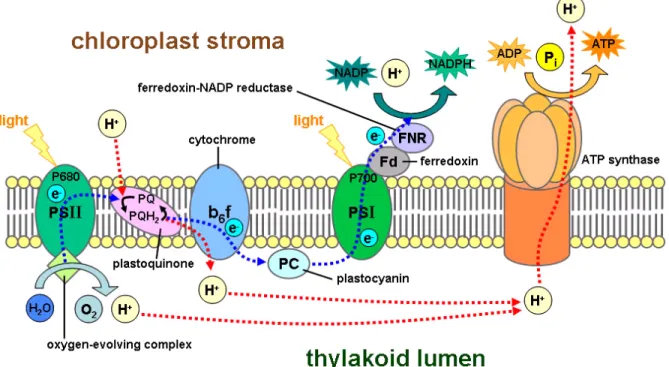


![Figure 2.2. Crystal structure of cis,cis-[(bpy) 2 (SO 4 )Ru IV ORu III (SO 4 )(bpy) 2 ]](https://thumb-us.123doks.com/thumbv2/123dok_us/8315872.2203224/73.918.319.637.514.810/figure-crystal-structure-cis-cis-bpy-oru-iii.webp)

![Table 2.5. Differential Raman cross-sections at various excitation wavelengths for [(bpy) 2 (H 2 O)Ru III ORu III (OH 2 )bpy) 2 ] 4+ in water at pH = 1](https://thumb-us.123doks.com/thumbv2/123dok_us/8315872.2203224/84.918.142.806.199.838/table-differential-raman-cross-sections-various-excitation-wavelengths.webp)
![Figure 2.8b. Raman excitation profiles for cis,cis-[(bpy) 2 (H 2 O)Ru III ORu III (OH 2 )bpy) 2 ] 4+ in water at pH = 2 vs](https://thumb-us.123doks.com/thumbv2/123dok_us/8315872.2203224/87.918.224.721.97.665/figure-raman-excitation-profiles-iii-oru-iii-water.webp)
![Table 2.7. Absorption band energies and proposed assignments for cis,cis- cis,cis-[(bpy) 2 (H 2 O)Ru III ORu III (OH 2 )bpy) 2 ] 4+ in water at pH = 1, see text](https://thumb-us.123doks.com/thumbv2/123dok_us/8315872.2203224/92.918.190.758.184.717/table-absorption-energies-proposed-assignments-oru-iii-water.webp)
