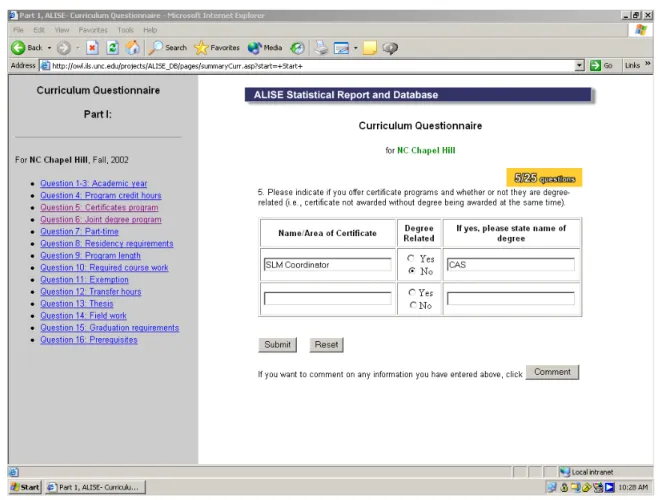
January 2003. 149 pages. Advisor: Stephanie W. Haas
Each year the Association of Library and Information Science Education (ALISE) publishes the ALISE Statistical Report. The report contains statistical information on library and information science programs that are accredited by the American Library Association (ALA). The current process for collecting and compiling statistical data from schools involves many manual tasks. Among these are paper questionnaire submission via standard mail, input of data into several databases for archiving purposes, and compilation of statistics by individual authors of the report’s five chapters. This paper describes the development of an online questionnaire system, to collect the statistical data and automate the process of data input, data update and data storage. A usability study was also conducted to gather feedback from users and to improve the user interface.
HEADINGS:
Online survey--Design
Database--Management--Systems Information system--Design Interface design
PROCESSING OF STATISTICAL INFORMATION
by Yanfang Jiang
A Master’s paper submitted to the faculty of the School of Information and Library Science of the University of North Carolina at Chapel Hill
in partial fulfillment of the requirements for the degree of Master of Science in
Information Science.
Chapel Hill, North Carolina January 2003
Approved by:
Table of Contents
Introduction……….. 1
Project Background
Project Introduction………...………. 2Project Scope..………..……….. 4
Project Description
User Analysis………. 5Task Analysis..………..………. 6
Business Requirements and Rules...……….……. 8
Risk Assessment and Management……….... 8
Technology Justifications………... 9
Critical principles and factors……….………10
System Description and Design Decisions
Overall Structure and Shared Features………... 13Overall Structure……… 13
Comment Mechanism……… 14
Progress Indication and Derivative Questions..………. 15
Data Checking Mechanism……….… 18
Concept Definition……….…. 19
Students Questionnaire………... 20
Faculty Questionnaire………...……….. 25
Curriculum Questionnaire…………...……… 29
Income and Expenditure Questionnaire……….. 31
Professional Continuing Education Questionnaire……….… 34
Usability Study
Background………. 38
Data Analysis……….. 39
Other Concerns
Network Stability……… 41Multiple Online Accesses………42
Future Implementation………. 42
Conclusion
The Next Phase .……….. 45Lessons Learned……….. 46
Endnote………. 48
Reference……….. 49
List of Tables
Table 1: Student Enrollment by Program and Gender……… 22List of Flowcharts
Flowchart 1: Example for Data Integrity Checking………... 25Flowchart 2: Three-level Architecture of the Repeated Question……….. 28
List of Figures
Figure 1: Example of New Program data submission……… 30Figure 2: Screenshot for Interface of Duke Online Application System……… 43
Appendix 2: ALISE Faculty Questionnaire (Non-confidential)……… 71
Appendix 3: ALISE Curriculum Questionnaire……… 78
Appendix 4: ALISE Income and Expenditure Questionnaire………... 93
Appendix 5: ALISE Professional Continuing Education Questionnaire…………. 104
Appendix 6: The Usability Consent Letter……….. 114
Appendix 7: The Usability Cover Letter………. 117
Appendix 8: The Usability List of Tasks………. 120
Appendix 9: The Usability Feedback Form………. 122
Appendix 10: The Usability Survey………. 130
1. Introduction
The Association for Library and Information Science Education (ALISE) is a non-profit organization whose aim is to promote excellence in research, teaching, and service for library and information science education (http://www.alise.org). Each year, ALISE publishes the Association of Library and Information Science Education Statistical Report, currently in its 23rd year of publication. The statistical report contains statistics and objective analysis of various aspects of LIS programs offered by schools that have been accredited by the Committee on Accreditation (COA) of the American Library Association (ALA). Currently there are 56 schools participating in the ALISE Statistical Report project.
This paper describes the design, and development of the ALISE Statistical Report Online Questionnaire System, including changes made to the backend database as a result, and a usability study of the system interface.
2. Project Background
2.1 Project Introduction
The ALISE Statistical Report, provided as a service to the association members, is intended to “compile, analyze, interpret, and report statistical (and other descriptive) information about library/information science programs offered by schools that are members of ALISE 1.” Each year a new edition of the report is generated based on the
data collected from participating schools. The report contains five chapters: Students, Faculty, Curriculum, Income & Expenditure, and Professional Continuing Education. In each chapter, data compiled from one of five questionnaires submitted by schools are reported and discussed. (The names of the questionnaires correspond to the chapter names.) Please refer to Appendices 1-5 for the original paper questionnaires.
Compiling the report requires the following steps:
• Questionnaire distribution
• Data collection
• Data analysis and report generation.
set was mailed to the chapter author. Each author was responsible for compiling and aggregating data from all questionnaires they received from the ALISE editors. After completion, each author sent the chapter in Microsoft Word format back to the ALISE editors. The editors and their assistant applied the same style and formatting to all chapters, checked for and corrected errors in statistical calculations, and edited and consolidated the five chapters into the ALISE Statistical Report.
In 1995, Dr. Daniel and Dr. Saye of the School of Information and Library Science (SILS) at the University of North Carolina at Chapel Hill submitted their proposal to serve as the co-editors of the ALISE Statistical Report. They proposed to establish a database and automate the data collection and analysis process, thereby replacing the current manual process. The executive board of ALISE accepted the proposal in December 1995. Since then, the automation of the ALISE Statistical Report Project has been proceeding. In 1997, the ALISE team began creating Access databases to store data from the Students, Faculty and Income & Expenditure questionnaires for archiving purposes. However, these databases are independent from each other, and all the data from the above three questionnaires are entered manually, questionnaire by questionnaire. Since 1997 the ALISE Statistical Report has been also available online, as well as in printed form. The online report contains the same information as the paper report, but there is a slight difference in format. In the paper report, tables containing data and statistics are embedded within the text; in the web version, the tables are separate but can be linked to from within the textual report.
questionnaires were mailed to schools, and in recent years, were also available online. This move eliminated the need for ALISE editors to print and mail questionnaires to schools. With the success of this change, the ALISE team wanted to further the automation and design a database-driven online questionnaire system to automate the data collection process.
During the first phase of the development, Heather Wolf created a relational Access database based on the logical analysis of the data collected2. The Access database comprised 29 tables, which captured all the data across the five questionnaires. She also created a prototype of the online questionnaire, which was composed of one login page, and two pages of the Students Questionnaire. The prototype was implemented using Active Server Page (ASP).
2.2 Project Scope
The goal of the second phase, described in this paper, was to design and implement a comprehensive web-based database-driven questionnaire system to automate the process of data collection of the entire set of questionnaires.
The main part of the project concerned the design and development of the data submission component. It comprises five separate sections corresponding to the five chapters in the paper questionnaires: Students Questionnaire; Faculty Questionnaire (non-confidential section); Curriculum Questionnaire; Income and Expenditure Questionnaire and Professional Continuing Education Questionnaire.
Users trying to access the system are required to provide the correct user names and passwords; otherwise access will be denied. Each page within the system also contains the password checking mechanism; which prevents someone from opening a single page within the system by merely attempting to type in a corresponding URL.
Since data in each chapter has its own characteristics, the design of each part varies in terms of structure, navigation, data checking mechanisms, page layout, etc., each of which are detailed in the system description and design decisions section.
A usability test was conducted to collect user feedback for the future improvement of the interface.
3. Project Description
3.1 User analysis
Wolf conducted a very thorough analysis of the users of the system in the first phase of development. According to her, potential users of the ALISE statistical information data collection and reporting process can be categorized into three groups: 1) those who submit school data via questionnaires to ALISE editors, 2) those who process that information and prepare it for publication, and 3) those who access information contained in the paper report and/or on the web site 3.
information science, journalists, others interested in statistics on ALA-accredited programs in library and information science, and the general public 4. Each group imposes specific requirements for the system and system design needs to take these requirements into considerations.
Within the scope of this project, specifically the online questionnaire system, the first user group is the primary one. The user analysis presented in the next section therefore focuses on this group. Design considerations regarding this group include the transition to a new method of data submission, time constraints due to busy schedules, confirmation of questionnaire submission/completion, and ease of use.
3.2 Task Analysis
The frequency or timing of the task
• How frequently do users perform the task? On average, once a year, when prompted to submit the school's current information.
• What are the time constraints on the task? There is a submission deadline for all sections of the questionnaire.
The complexity and difficulty of the task
• How structured is the task? The task is highly structured and predictable.
The relationship of the task to other user tasks
• Is system use mandatory or discretionary? System use is discretionary at this point. It is still possible to submit a paper questionnaire to ALISE instead of using the web interface, but in the near future, it is expected that all users will be required to use the system.
• How important is the task? The task is very important to ALISE as it maintains a comprehensive listing of school information.
The physical environment of task performance
• Where is the task performed? The task is performed in a typical university office setting with good lighting, moderate temperature, low dust levels, etc.
• What other tools does the user have? Users have information about their school available, which may be in several different locations and forms. Although how they organize it before it gets entered is outside the scope of our system, it may still have an effect on system design, for knowing how users collect and organize the data can help us with a logical and feasible design, which will possibly reduce the data entry errors.
Planning for learning and breakdowns
• What training will be provided? How is the task learned? No face-to-face training will be provided. Use of the system should be self-evident. Tasks are structured to resemble the printed questionnaire that has been used in the past.
3.3 Business Requirements
There are some general requirements for the design of the online ALISE questionnaire.
• The new system should be able to collect all types of statistical data currently presented both in the paper report and on the web site.
• Rather than being entered by the user, values for specified total fields will be calculated on the fly using ASP, and then entered into the database.
• The new online questionnaires should employ data validation to prevent data type mismatch. For example, in paper questionnaires, a user may enter text data when numeric data are required or he/she may submit data that is inconsistent with total calculated from data entered previously.
• Access security should be implemented via the login page; therefore, only authorized personnel can access to the online questionnaires.
3.4 Risk Assessment
After careful analysis of the business requirements of the project and the objectives that must be met, the following risks have been identified:
• Security
o The log-in page must keep unauthorized users out.
o Data needs to be stored securely so that unauthorized individuals do not obtain information.
• Data integrity
o False or incorrect data may be entered by the user.
• Accessibility
o The server needs to be able to handle the load. Currently there are 56 schools participating in the project. Each school may have 1-5 LIS administrators entering the data. So the total number of users of the system is between 56 and 280.
3.5 Technology Justification
Active Server Pages (ASP) was chosen to implement the online questionnaire for several reasons.
• The database was designed in MS Access. ASP is the major dynamic web application product developed and promoted by Microsoft. It works seamlessly with the MS Access database.
• ASP is both simple to use and very powerful. More importantly, it provides full programming capability, unlike a tool such as ColdFusion, which "hides" much of the functionality from the developer. To develop in ASP, one must write all code necessary or access specific code contained in prewritten objects. Although ColdFusion is an extremely powerful tool, it is geared more towards developers with little or no programming experience. The online questionnaire submission involves server-side calculations and validation based on those calculations. We felt that developing this functionality using ASP was more straightforward and provided a valuable programming experience.
elaborated in the decision and system description section. JavaScript is a client-side script, which works well for the data validation and popup windows. By using client-side scripting, we were also able to shorten the response time of the data validation, and alleviate the load on the server.
3.6 Critical principles and factors
The following aspects are important factors that need to be taken into consideration in implementing the system:
3.6.1 Limitations and constraints of existing database design on web application
The database was designed before the application design of the online questionnaires. Since it is the backbone of the whole system, its design can substantially influence the design of the online application in various ways.
In implementing the online questionnaires, I primarily based the online system on the structure of the existing database, but modifications to the database were also made when new features needed to be included or when the existing system could not provide the flexibility and ease of use that the online application requires. There were additions of tables and reorganizations of data. For example, in the original design there was no provision for users’ comments. In implementing the system, comments were regarded as an indispensable and important feature of the system; therefore six tables were added to collect comment data.
3.6.2 The internal logical relationships among data
Understanding the relationships among the data and how users collect them is crucial in designing a logical system, which facilitates users orientation and reduces data entry errors. All the design details, such as grouping and ordering questions, deciding in what format to provide the definitions, etc. will substantially affect users interaction and success with the system.
Thanks to regular meetings with the ALISE editors, Dr. Evelyn Daniel and Dr. Jerry Saye, my understanding of the data and users was highly enhanced, which greatly helped in the design of the system.
3.6.3 Maximum vs. minimum display
One of the biggest differences between the paper questionnaire and the online questionnaire is what we call the “content display principle”. Since the paper questionnaire is fixed and static, it looks the same to all users. It must contain all the content necessary for any user’s maximum need. Users with smaller data collection needs must go through the entire content, select the few relevant fields to enter data and leave the rest blank. This approach illustrates a limitation of the paper questionnaire. The whole process is time-consuming, confusing and open to errors.
In designing the online questionnaire, I was fully aware of the difference between the two formats and strove to incorporate the dynamic, well-tailored content display mechanism into the system.
3.6.4 The interface design principles
The online questionnaire is an online information system, which is presented to users through interfaces; therefore several design principles 5 were taken into consideration.
• Visibility of system status: The system should always keep users informed about what is going on, through appropriate feedback within reasonable time.
• Match between system and real world: The system should speak the users' language, with words, phrases and concepts familiar to the user, rather than system-oriented terms. It should follow real-world conventions, making information appear in a natural and logical order.
• User control and freedom: Users often choose system functions by mistake and will need a clearly marked "emergency exit" to leave the unwanted state without having to go through an extended dialogue. In the online questionnaire system, the task itself does not allow a great deal of freedom on the user’s part; however, the control aspect is applicable.
• Error prevention: Even better than good error messages is a careful design, which prevents a problem from occurring in the first place.
3.6.5 Consistency with the paper version
As stated above, one of the business requirements of the system is that the new system should be able to collect all types of statistical data currently presented both in the paper report and on the web site, which means there should exist a consistency between the paper questionnaire and the online questionnaire in terms of content.
3.6.6 Flexibility to accept “extra” information using comment fields
Users may need to provide additional information about data they enter. A comment field mechanism is provided for each field.
4. Design Decision and System Description
This section opens by describing the overall structure of the system and the features that are shared by all the questionnaires. Then it describes the individual design decisions and features for each questionnaire.
4.1 Overall structure and shared features
4.1.1 Overall structure
update scenario follows the submit scenario, but exceptions exist. For example, the first part (Questions 1-16) of the Curriculum Questionnaire contains questions to which the answers change infrequently, while the second part (Question 17-25) contains questions to which the answers change from year to year. We decided to provide users two different structures for these two parts. For the first part, we provided users with the data submitted in the previous year, so that users just need to update their information instead of reentering it. This is actually an update scenario in format. After users complete the first part, updating any information that has changed since last year, they will enter current data in the second part, later updating it if needed.
4.1.2 Comment mechanism
Another architectural feature that appears in all the chapters is a special comment window where users can enter additional comments on most fields. The challenge in designing the comment mechanism lies in the fact that it is possible for users to make comments on any field, so the comment mechanism must enable users make comments on every single field on every single page. At the same time since the comment mechanism is just a supplementary component of the system, the design should be simple and portable, and unobtrusive when not wanted.
separate Web page. A user who wishes to enter a comment clicks the button on the main page and open the comment window. The ID of the page that the user opens is automatically passed to the window, and the user just need to enter the number of the item (which is clearly marked before each item) on which he/she wants to make comment, and the comment itself. After the user writes the comment and clicks the submit button, a follow-up Web page appears that confirms the number of the item he/she just commented along with two options:
1. Choose to enter a comment to another item
2. Exit the comment window and back to the main page
This approach to the comment mechanism applies one of most important programming principles: encapsulation, which saves repeating code on every Web page, enables reuse of code and helps improve system performance. All the data collection Web pages of one questionnaire share the same comment Web page and follow-up page. Therefore, for the whole system, there are only 5 sets of comment and follow-up Web pages, while still allowing comments on any single item throughout the whole questionnaire system.
4.1.3 Progress Indication and Derivative Questions
questionnaire they have completed. This gives them an overview of their progress. If users have time constraints on completing the questionnaire, this also helps them allocate their time for each question. The progress indicator has striking colors and is placed at the same location on each page for each chapter. This reflects the interface design principle “consistency and standards” described in 3.6.4.
The original design of the progress indicator was based on the total number of pages included in each questionnaire. The indicator showed the total number of Web pages in the questionnaire and the number of the current Web page. For example, 14/20 would indicate that there were 20 Web pages altogether in this questionnaire and the user was currently at the 14th page. The advantage of the design is that it is clear and intuitive.
However, this design has an unavoidable problem: For most of the chapters of the questionnaires there is no fixed number of total pages. The total number varies from school to school, because there are some derivative questions.
A derivative question is a question that is derived from a higher-level question. For example, users will first be asked whether their school provides a certain type of service. If the answer to this question is “yes”, users will further be asked a series questions regarding the details of this service; otherwise, they can skip them and jump to the next question. Several chapters of the questionnaire system include this type of questions.
designed a multilevel structure mechanism based on the structural features and internal relationship of the questions. Most derived questions could be handled using a two-level structure. In this structure the main question and its derived questions were separated onto two pages. Scripts were added to the first part of the second page to check the answer to the main question. If the appropriate answer is given, users will be brought to the derived questions; otherwise, they will be brought to the next page without ever being aware of the hidden derived questions. For example, in the Continuing Professional Education Questionnaire, there is a question regarding continuing education (CE) courses designed for practitioners: “Do you offer CE courses specifically designed for practitioners who were not candidates for a degree (i.e., not enrolled in 6th year, masters, or doctoral degree programs) for which academic credits were granted?” If the answer to this question is “yes”, the user must answer a series of questions about these courses; otherwise, the user skips these questions and goes directly to the next page.
The derivative questions made it very hard to design the progress indicator, since the denominator may vary depending on users’ answers to specific questions. The change of denominator as the user proceeds will inevitably cause confusion. Therefore a different approach was needed.
paper questionnaire, the main question and its related derivative questions are all questions, and they are grouped as one single question set numbered with different sub-sets, for example, 1.A, 1.B and 1.C. This structure suggests that users think about the question as the basic unit, regardless of the number of derived questions they must complete. Therefore, the question is a more natural indication of progress than the page, it carries over from the paper format to the web format, and it is also easier to implement in a logical way.
Based on the above consideration, the progress indicator was then changed to base on the question instead of on Web page.
4.1.4 Data validation mechanism
The questionnaires collect various types of data: numeric, binary, date, text and memo. Since the data are collected for statistical purposes, numeric data are the most important data type collected. One of business rules of the system requires that the new online questionnaires should employ data validation to prevent data type mismatch. To meet the requirement, a numeric data validation mechanism for each numeric field was created using JavaScript. Whenever users enter a nonnumeric value on a numeric field, an error message will pop up reminding users of the type of data needed, and asking them to check and reenter valid data.
email address. These fields are all required fields. If a user fails to complete a field such as title, when he/she clicks the submit button, an error message will pop up that says “Title is a required field, please enter your information in that field before you proceed”. Only when the user completes all the required fields, can he/she proceed to the next page. Another example is for checking the validity of email addresses. When a user enters an email address, a checking mechanism is invoked to validate it. If the email account entered is an active email account, the user will successfully proceed to the next page, otherwise an error message shows up reminding the user to check the data entry and correct it before proceeding.
This data validation mechanism enhances data quality and helps prevent data entry errors. This approach also reflects the interface design principle “error prevention” described in 3.6.4.
4.1.5 Concept Definition
The concept definition mechanism is another important feature of the system. The questionnaire system contains many concepts that users may need to have explained. For example, in the Continuing Education Questionnaire, Question 1.A. col. 4 asks about the number of programs that offered CEUs. A CEU refers to Continuing Education Unit, which is defined as “Ten contact hours of participation in an organized continuing education experience under responsible sponsorship, capable direction and qualified instruction” in the questionnaire 6. Users need to understand this concept before they can
A popup window mechanism was designed to display the definitions. All the concepts for which the paper questionnaire provides definitions were highlighted as active hyperlinks. When a user has questions regarding a concept, he/she clicks on the hyperlink of the concept. A popup window with the related definition shows up. Users can close the window after they finish have read the definition.
4.2 The Students Questionnaire
There are several characteristics of data in the Students Questionnaire whose corresponding mechanisms deserve discussion.
First, data integrity checks are required for record values. Based on the data entered into the master table on the first data entry page of the Students Questionnaire, the following totals are calculated by ASP on the fly: total number of fulltime students, total number of part-time students, total number of fulltime female students, total number of
fulltime male students, total number of time female students, total number of
This illustrates the advantages of the online system over the paper questionnaire. In the paper questionnaire, users have to calculate all the totals themselves, which is a tedious and time-consuming process. Although in the paper questionnaire there are clear instructions that the total values of different categories should be equal, there is no mechanism to enforce that requirement, so discrepancies may still occur. When the chapter authors compile the data and find a discrepancy, they have to contact the school for the correct data. But with the online system, all these problems are avoided. Total values are automatically calculated by the system. Users are still responsible for providing accurate data, but the online system saves time and effort as well as improving data quality.
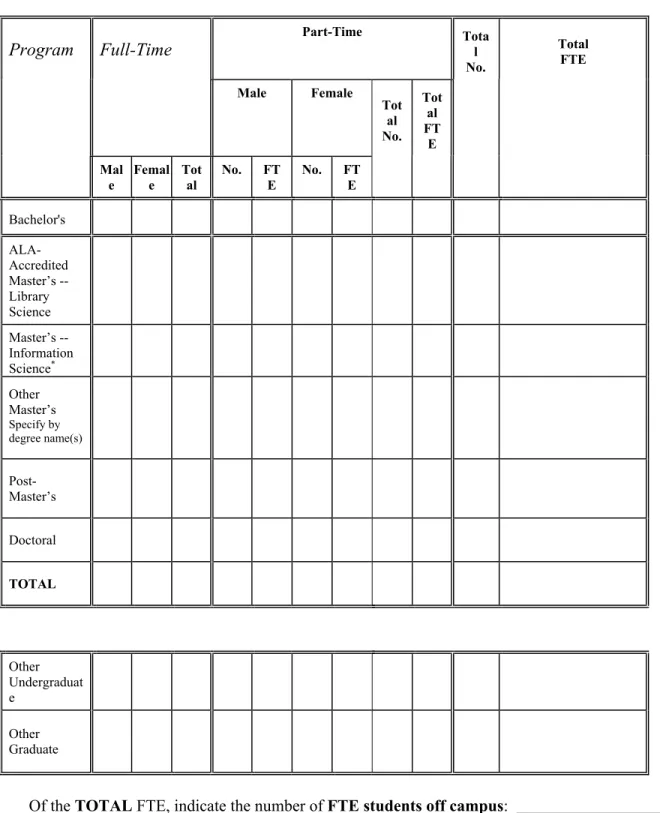
Table 1
Student Enrollment by Program and Gender
Part-Time Full-Time
Male Female Program
Mal
e Female Total No. FTE No. FTE Total
No. Total FTE
Total
No. Total FTE
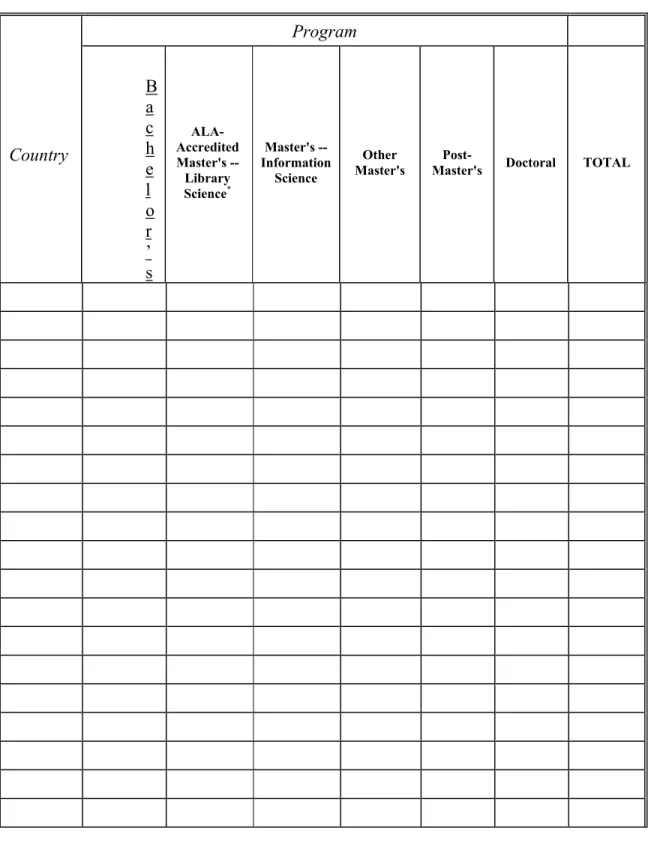
One dimension is degrees/programs, and the other is the topic of the questions, in this example, gender and enrollment. Degree/programs include eight categories: 1. Bachelor’s; 2. ALA-Accredited Master’s – Library Science; 3. Master’s Information Science; 4. Other Master’s; 5. Post-Master’s; 6. Doctoral; 7. Other Undergraduate; 8. Other Graduate. Topics include: 1) Student Enrollment by Program and Gender; 2) Degrees and Certificates Awarded by Gender and Ethnic Origin; 3) Enrollment by Gender and Ethnic Origin; 4) Number of In-State/In-Province and Number of Out-of-State/Out-of-Province Students Enrolled; 5) International Students Enrolled by Program Level and Gender; 6) International Students Enrolled by Country of Origin and Program Level; 7) Students Enrolled by Age and Gender; 8) Scholarship and Fellowship Aid; 9) Assistantships; 10) Tuition and Fees.
In designing the online questionnaire, one of the challenges is to decide how to divide the two-dimension question tables into logical sections to fit the online format. We need to divide the table, because we cannot put such a large table on a single Web page for data entry. After careful and thorough examination of the content of the questionnaire and consultation with Dr. Daniel and Dr. Saye, we decided that the data would be divided and organized by the dimension of degrees/programs. This decision reflects the following two design principles.
the person entering data must answer questions on all of the 10 topics listed above. Using degrees/programs as division unit, we can dynamically display the questions just for the degrees/programs that a school provides.
In the opening page of the Students Questionnaire, users are shown the list of degrees/programs, and are asked to check all the degrees/programs their schools provide. This answer controls the number of times the user must iterate through the 10 topics. Users will only see the questions that they need to complete, while unrelated questions (questions regarding other degrees/programs) will be filtered out by the program.
Flowchart 1: Example for Data Integrity Checking
Pass Value 1
If Value 1<>Value 2
If Value 1=Value 2
If we used topic as division unit instead of degree/program, we could not calculate the total values until we got to the last page of the questionnaire after all the data had been entered. When an inconsistency was found, we could not necessarily tell on what specific page the error(s) occurred, because one portion of each total would have been gathered on each page. It would be very hard to identify the errors for users.
4.3 The Faculty Questionnaire
The Faculty questionnaire contains 2 sections: one requests confidential information
Page 1: Topic 1(Master table) Set of questions
(Calculate total value1)
Page 2: Topic 2
Set of questions (Calculatetotal value2)
Page 3: Topic 3
Set of questions (CalculateTotal value3)
consulted with ALISE editor Dr. Jerry Saye, who recommended building a standalone, secure system for the confidential section to protect this sensitive data, which was considered as a separate project. Therefore this system only includes the non-confidential section, and the confidential section falls out of the scope of this system. It will be implemented in a later phase of the project.
In the non-confidential part, the first question on the paper questionnaire asks about the division of the academic year in semester, quarter or trimester, which is also the first question of the Curriculum Questionnaire. The duplication of the question in the paper format stems from the fact that the different questionnaires are designed and edited by different authors, and data collected are stored in different databases and analyzed independently. Since the division of the academic year interests both the authors of the Faculty Questionnaire and the Curriculum Questionnaire, it is addressed in both the questionnaires. In the design of the online questionnaire, since we have a single comprehensive back-end database, it is not necessary to duplicate the question.
The issue is then where the question should be placed. I consulted with the ALISE editors Dr. Daniel and Dr. Saye. After careful consideration and examination, we agreed to include the question in the Curriculum Questionnaire while dropping it from the Faculty Questionnaire. This decision was primarily based on the fact that the question is conceptually closer to the other questions of the Curriculum Questionnaire than to those in the Faculty Questionnaire.
How many faculty at your school received sabbatical leave, or its equivalent, during Academic Year 2001-2002? __________________________
Check here if no such leaves are granted at your institution. ___
Please indicate the time and percentage of salary received by each faculty member on sabbatical leave during Academic Year 2001-2002. (e.g., one semester at 100%; a year at 50%).
Length of time: _______________ % of Salary:__________
Length of time: _______________ % of Salary:__________
Length of time: _______________ % of Salary:__________
Flowchart 2: Three-level Architecture of the Repeated Question
If “no” If “yes”
If “0” If not “0”
Based on the above analysis, I designed a three-level architecture to reorder the question display. Three pages were designed, each accommodating one sub-question. Users are asked the second question first. When they submit the data, the next page checks the answer to decide the flow of the program. If the answer is “yes”, users are given the first sub-question; otherwise, users are presented with Question 14 without going through the other parts of Question 13. The next level is handled similarly: if users enter a value other than “0”, users will be presented with the third sub-question; otherwise, they will be immediately directed to Question 14.
Second Question
Check answer
First Question
Check answer
Third Question
Again, this design reflects the minimum design principle for online material. It enables dynamic display based on each school’s data, saves users’ time and effort and helps decrease data entry errors.
4.4 The Curriculum Questionnaire
The Curriculum questionnaire is the most complex questionnaire of the whole questionnaire system in terms of the volume of data and the diversity of data types.
The most striking feature of the questionnaire is that the answers to the first 16 questions change little from year to year for most schools For example, one question asks what the division of the academic year is used at the school’s institution. To save users’ efforts, the system displays data collected in the previous year, so that users just need to update if necessary. This is another advantage of the online version over the paper version, which requires the data to be entered every year. The remaining 9 questions were designed with the normal data submission structure.
decided on this design, because the primary assumption we make is that this part of data normally does not change. Generally speaking, this approach should benefit more users by saving their time and effort than it inconveniences the small number of users whose schools have started a new program.
To support those schools with a new program, an alternative way of entering data was provided. For the question regarding the programs, besides the number of blank fields that equal to number of programs school provided last year, an extra set of blank fields was designed to hold new information, which was not provided in the previous year. If a school starts up a new program, they can put the information for the new program in the blank field.
If the school starts up more than one program in a single year, users have to put this information as a comment in the comment field for this question. Chapter authors will check all the comments before they begin the data analysis; therefore this information will be picked up by the authors and included in the data analysis and the final report and then used to collect information for the new program next year.
4.5 The Income and Expenditure Questionnaire
The Income and Expenditure (I&E) Questionnaire has only one distinct feature: a repeated field question.
A repeated field question is a question for which there are possibly multiple parallel answers. Question C of the Income & Expenditure Questionnaire is a good example of a repeated field question.
ITEMS NOT INCLUDED IN THE LIS SCHOOL BUDGET
If the parent institution (and/or its library or computer service organization) furnishes services and materials or provides benefits without budget charges, these items should be listed here. DO NOT list general institutional services such as heating, ventilation or other maintenance costs unless they are specifically credited to the school’s budget. Please specify item and amount:
We cannot predict how many items a school will list. There are two major issues for this question. The first is how many repeated fields is a proper number to display on the interface, and the second is how to implement the update function for a page with repeated fields.
First, consider the “magic” number of the fields that needs to be displayed. Since we cannot predict how many fields each school needs, we followed the maximum design principle and showed as many fields listed as necessary to satisfy the maximum demand of the users. We chose 9, based on archives of data that schools submitted in the previous years.
The second issue was how to implement an update page that would handle the multiple possible update scenarios. With a repeated field question, the update scenarios include the following cases:
1. Edit existing records 2. Delete existing records 3. Add new records
total number of records that have been generated, even if some of them have since been deleted. The ID of the records in the database table is therefore possibly not sequential. When using the loop function to pull out the records, we would encounter failure.
To solve the problem, I created a flag field in the table as the record ID. Unlike the automatically generated number, it is a field generated by the interface program. It is assigned every time when a new record was created and cleared when a record is deleted, thus ensuring that there is a sequential ID for the records in the table. With the help of the flag, we can easily pull out all the records from the database using the loop function and display them on the screen for further editing and deleting.
We also need to decide the number of blank spaces to provide for adding new records. On one hand, we want to make sure that users will have enough spaces for all the new records they want to add, on the other hand, we do not want to fill the page with unnecessary blank fields. After several rounds of testing, a simple but efficient mechanism was designed to solve the problem.
On the update scenario page there will always be only one blank field holding the extra input. The “one-line-extra design” was based on of the recommendation of the ALISE editor, Dr. Daniel. For most schools, one new item will be the normal case, if they have anything new to add. Thus, this design avoids unnecessary blank fields while satisfying most users’ needs.
find the list of records with the new added record and an extra blank line, which is ready for another new record. Users can keep adding records until all the records they want to add are added.
The advantage of the design is that it is relatively simple and efficient, and it can satisfy all the scenarios. It is a flexible design as well. The disadvantage of this design is that if users have more than one record to add, they cannot add them all at once. They must add them one by one. Design always involves balance and compromise between advantages and disadvantages. After careful examination of the data feature and overall evaluation of the mechanism we adopted this mechanism because the advantages outweigh the disadvantages.
The Income and Expenditure Questionnaire also contains derivative questions, which are handled in the same way as in the other questionnaires.
4.6 The Professional Continuing Education Questionnaire
The Professional Continuing Education Questionnaire is the smallest questionnaire in terms of data volume. It contains the same data types collected as in the other chapters. Question structures such as derivative questions and repeated fields questions are handled in the same way as in the other questionnaires.
4.7 Modifications to the database
Additions. Since new features were needed in the implementation of the online system, there were corresponding additions made to the original database design. This primarily resulted in the addition of new tables. For example, in the original design of the database, there was no allowance for a comment mechanism, therefore there were no tables created to hold the comments. In implementing the comment mechanism, 5 new tables with the same structure were added, one for each for chapter:
COMMENT_STUDENT, COMMENT_FAC, COMMENT_CURR, COMMENT_INCEXP, and COMMENT_CONTED.
On the paper questionnaire, there is a page at the beginning of each chapter asking for contact information, such as name, title, phone number, fax number and email, of the person who is responsible for completing the chapter. This helps the ALISE Report authors identify the source of the data when needed. In the original design of the database there was no table designed to hold these data. In consultation with the ALISE team, we agreed that this information was important and should be kept in the database. Therefore, a new table was created for this information.
“tutorial”, which were omitted from the questionnaire of year 2002. Therefore I deleted these two attributes in the table CONT_ED. There are also new attributes. For example, in the same questionnaire, there was a new category “International (outside country)” added to question 2 this year: Therefore it was also reflected in the database by the addition of a new attribute field “international”.
Changes to facilitate implementation. The database has also been modified to facilitate the implementation of the online system. The database was designed before the implementation of the online system, so some of the decisions hindered the implementation in certain ways. To facilitate the online implementations, three major aspects of the database have been modified.
First, all the questions in the paper questionnaire that start with is, are, was, were, do, does, or did were all originally designed as attributes with “text” as data type. This is a reasonable design for the database itself, but it is not the best way to support the ASP implementation of a radio box and a check box. Therefore I modified these attributes into “yes/no” (binary) data type, which will facilitate the online implementation.
record is entered for the first time. The other is update, used when the record is already in the database, but the values in some attribute fields of this record are changed. When we try to put data from the Students Questionnaire into the CURRICULUM table, the problem we face now is which query command we should use: If there is already a record in CURRICULUM table for this school, we would use update; if there is no record in CURRICULUM table for this school, we have to use insert to create a new record for the school. Since each questionnaire is an independent unit and is possibly completed by a different person, there is no definite sequence in which the questionnaires are completed. Therefore, we cannot tell whether users at a school will fill out the Students Questionnaire or the Curriculum Questionnaire first.
To solve this problem, I consulted with the ALISE team to determine the reason for entering these Students data into the CURRICULUM table. Since these data were also curriculum-related data, they may be needed by the author of the Curriculum Questionnaire when he/she is editing the Curriculum Report. However, since the data is now stored in a single comprehensive back-end database, Curriculum Report authors will be able to use these data, regardless of the table in which they are stored. Therefore, we agreed to move the data back to the Students Questionnaire table.
from integer to long integer, which stores numbers from –2,147,483,648 to 2,147,483,647.
5. Usability Study
A usability test was designed and conducted to gather feedback from users. The goal of the study was to identify specific problems that users of the system might have; in addition, this test evaluated the overall design and usability of the ALISE Statistical Report Online Questionnaire System.
5.1 Background
The usability test was conducted with the potential users of the system: schools and individuals (faculty and staff members) from these ALA-accredited schools. Two schools were chosen from the ALA-accredited Information and Library Schools. The selection of the schools was decided by the ALISE editors, Dr. Evelyn Daniel and Dr. Jerry Saye, and me. Representative features of the data sets were taken into consideration when schools were being selected; we also attempted to choose one school with relatively large and complex data set and one school with a comparatively simple data set.
After we contacted the selected schools and received consent from each school as well as each individual who would fill out the questionnaire, we sent an information package to each individual via email. The information package included:
• A cover letter
• A list of tasks
Please see Appendix F for the consent letter, Appendix G for the cover letter, Appendix H for the list of tasks, Appendix I for the feedback form, and Appendix J for the survey used in the usability test.
Each individual was requested to complete the following tasks within 5 workdays. They could work anytime at their convenience.
• They were requested to fill out the questionnaire with the data they collected for the year 2002 report.
• They were requested to write down any problems they encountered while filling out the questionnaire in feedback form.
• They were requested to complete the survey after they completed the questionnaire.
All participants successfully completed all tasks and all of them agreed that the design of the online system basically covers the functions needed in the data collection of the ALISE Statistical Report Questionnaire.
5.2 Data Analysis
comparatively large data set. After communicating with the people who entered the data, I found where the problems were. As described earlier, I designed the repeated field question interface with one extra line to hold the addition of new items. If schools have more than one record to add, they need to add them one by one. In both of the cases where the errors occurred, the participating school had more than one record to add. The users failed to fully complete the tasks because they did not understand how the mechanism worked. After I showed them how it worked, they had no problem completing the tasks. This indicates we needed to provide better instructions for this mechanism, which will be added in the next development phase.
Another error I found from comparing the two data sets concerned the FTE data. FTE means “full-time equivalence”, and is used on both the Students Questionnaire and the Faculty Questionnaire. FTE students off campus therefore refers to the full-time equivalence of students who attend classes off campus. FTE of part-time faculty refers to the full-time equivalence of part-time faculty. It was captured as an integer number data type in the database. The above-mentioned correction to long integer overlooked the fact that FTE could be fraction. Therefore, I changed the FTE related field data types to real number to solve the problem.
decimal. Therefore, I changed all these data to real numbers in the database and in the implementation of the online questionnaire.
One of the complaints we received from the participants concerned the division of the two dimensional tables in the Students Questionnaire. As described in the Students Questionnaire section, we divided the tables by the dimension of degrees/programs. We made the decision because it reflects the minimum and dynamic display principle, it helps achieve the data integrity checking more easily, and it also reflects the database design. One of the participants from the schools with a large data set suggested that it would be better to divide the sections according to topics, because “this would be a more logical way of collecting data”. This is valuable feedback, for we realized this design had some drawbacks. However, any design decision requires balance and compromise between advantages and disadvantages. Dividing the sections according to topics would facilitate data entry for schools with large data sets; however, we would lose some advantages, for example, in calculating totals. At this point, we think that in the current design the advantages overweigh the disadvantages, however, this decision will be reviewed after more schools start to use the system.
6. Other Concerns
6.1 Network stability
load periods. To provide users a stable system, we may want to suggest to users an optimal time period, when users can avoid traffic and smoothly complete their data entry.
6.2 Multiple online accesses
The Access database management system is not ideal for supporting multi-user server-side databases. Currently there are 56 schools participating in the project. Each school may have 1-5 LIS administrators entering the data, so the total number of users of the system is between 56 and 280. These users are required to complete the questionnaires within a two-month period. The maximum average usage of the system is therefore five persons per day. But considering that people tend to complete tasks right before the deadline, there exists the possibility that more than a dozen people will simultaneously access the system during the last few days. Therefore, I recommend the system be migrated to a larger scale database that can better support multi-user access such as SQL server or Oracle database. There are many conversion applications designed to convert MS ACCESS databases into larger databases, such as SQL Server or Oracle.
An alternative to migrating to a larger database management system, or a short-term solution, would be to adopt a rolling deadline for data submission to alleviate possible traffic jams.
7. Future Implementation Plans
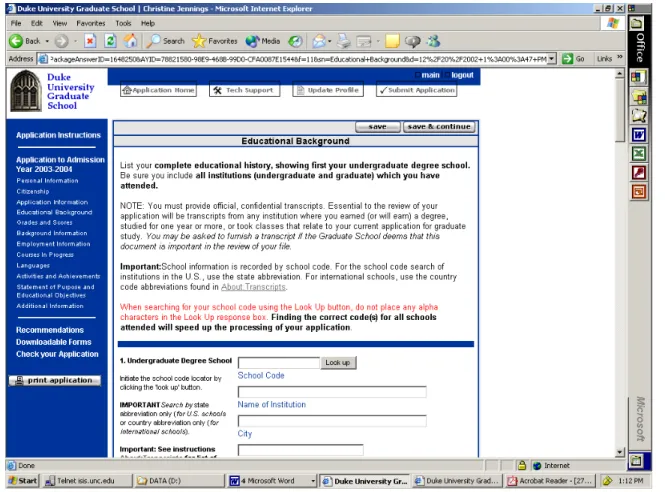
the participants in the usability study. In a future release, a new mechanism, which would enable users to interrupt filling out a questionnaire and resume the task later, would be desirable. To implement this mechanism, I recommend incorporating more JavaScript technology into the system. A good example of this mechanism is the online application system of Duke University (http://www.gradschool.duke.edu/admissions/; login is required for accessing the system). Figure 2 shows a screenshot of the interface.
Figure 2: Screenshot for Interface of Duke Online Application System
left. After they fill out the information, they can save the information entered. They can access each content Web page multiple times for update. When users finish the whole package and are ready to submit, they click the submit button at the top of the page and the entire information package is sent to the back-end database. This approach would satisfy our needs for the save function. However, we cannot simply copy this system, for in our case we also need to consider more complex needs: when to calculate the total values, how to control the data integrity, and so on. This will be a major challenge for the next release of the system.
Another important future feature requested by the schools’ Deans is a summary form with all information from each chapter, so that users can make a copy of it before they submit the data. Currently, schools use the full copy of the document in both electronic and paper form on a regular basis throughout the year. Even with the online system, and information from the database available to them on the Web, they still hope to keep a copy of all the data they submitted for later use. The summary feature will also fulfill another of the Deans’ requirements. Currently, schools’ Deans will check over the information in hard copy and give approval before it is sent to the ALISE editors. If the system provides a summary feature, Deans can check it over as they do in the current procedure. The Duke University application system also provides a good example of this mechanism, whose print function, prints in two formats: HTML and Adobe Acrobat PDF.
8. Conclusion
were designed. The goal of this phase was to design and implement a comprehensive web-based database-driven questionnaire system to automate the process of data collection of the entire set of questionnaires. This paper has documented the design and completion of the above projects components.
8.1 The Next Phase
The goal of the next phase is to add features that are essential for the system, but have not yet been implemented, test the system and finally deploy the system. To assist in the next phase of development, a development plan has been provided below. It lists the major tasks yet to be completed in the order it is recommended they be carried out.
1. Add instructions for the users, such as how to use the repeated field update scenario to add more than one item which was discussed in 5.2.
2. Design the print and save functions.
3. Internal testing. Test the above new functions and their integration with the existing functions and mechanisms. This can be conducted by the system developer(s).
4. Usability test. Conduct a second usability test with more schools (10-15 schools) to get more feedback from the users and use this feedback to further improve the interface.
the system. After the transition period, the system will be mature and users should be accustomed to the online system. The paper format will be eliminated and the users will be required to use the online system.
6. Data migration. If multi-user access becomes a problem due to the limitation of the Microsoft Access, as described in section 6.2, data migration to a large scale database is recommended. Normally when more than 20 users access the system at the same time, the Access database will not be able to support the load. Users’ access will be denied. Although this task is listed at the end of the task list, it should be implemented as soon as it seems that access is becoming a problem.
7. Regular maintenance. Conduct regular maintenance of the system such as updating the interface when questions are added or changed.
8.2 Lessons learned
The most important thing I learned from this project was to study and understand the data that the system was intended to collect. Throughout the course of this project, some difficult design issues were encountered, mostly relating to how best to design an interface that would collect the data correctly and efficiently. Understanding the types of data and patterns of data was vital to the design decision process. For example, the number data in the Income and Expenditure Questionnaire should be defined as real number instead of long integer. Otherwise users will experience system failure when submitting data.
Endnotes
1. Introduction, Association of Library and Information Science Education Statistical Report 2001. http://ils.unc.edu/ALISE/2001/Introduction.htm
2. Wolf (2001). The ALISE Project: Design of a Database and Online Prototype for Integration and Processing of Statistical Information.
3. Wolf (2001). p.7-8. 4. Wolf (2001). p.7-8.
5. Nielsen, Jakob. Ten Usability Heuristics.
http://www.useit.com/papers/heuristic/heuristic_list.html
References
1. Association of Library and Information Science Education Statistical Report 2001. http://ils.unc.edu/ALISE/2001/Introduction.htm
2. ALISE Statistical Report Questionnaire for Fall 2002.
http://ils.unc.edu/ALISE/2003/questionnaire.html
3. Childs, Matt, Lomax, Paul and Petrusha, Ron. VBScript in a nutshell. Sebastopol, CA: O’Reilly & Associates, 2000.
4. Nielsen, Jakob. Ten Usability Heuristics.
http://www.useit.com/papers/heuristic/heuristic_list.html
5. Ullman, Chris. Beginning ASP 3.0.Birmingham, UK : Wrox Press, 1999.
6. Vander Veer, Emily A. JavaScript for dummies, 3 rd edition. Foster City, CA: IDG
Books Worldwide, 2000.
ASSOCIATION FOR LIBRARY AND INFORMATION SCIENCE EDUCATION
STATISTICAL REPORT QUESTIONNAIRE 2002
PART II
STUDENTS
Please complete the following contact information identifying the person completing this part of the Statistical Report. This will help if questions arise in interpreting the data. Please be sure to return this cover sheet with the questionnaire.
Name:
Title:
Phone Number:
Fax Number:
Email Address:
University:
If questions arise in completing this part of the questionnaire, or if you have comments on its content, please contact the author of this section:
Jerry D. Saye, Ph.D, Professor
School of Information and Library Science University of North Carolina at Chapel Hill
Chapel Hill, NC 27599-3360 Telephone: 919-962-8073
Fax: 919-962-8071
Email: [email protected]
Jerry Saye will be in Ljubljana, Slovenia from October 5 to October 21. If questions arise during that period please contact the Students chapter co-author:
PART II: STUDENTS
Notes on Completing the Tables
Specific instructions for completing each table are located with the table. If questions arise please don’t hesitate to contact Jerry D. Saye by email or telephone.
Schools that have more than one program of study (i.e.., separate master's programs) are asked to report separately for the ALA-accredited library science master’s program, any information science master’s program whether accredited or not, but aggregate the students in other master’s program(s) of study under Other Master's.
If your school offers a particular program of study but no students are enrolled in that program (or none graduated -- Table II-3), please report “0” in the tables rather than leaving the cells blank. If you offer a program but the data requested are not available, please report “---“ in the relevant cells of the table.
Because of the differences in programs among the various schools of library and information science, you are encouraged to include explanatory comments for any of the tables. Comments, subject to editing, will be included in the final report with the table to which they refer where possible.
Table II-1
Student Enrollment by Program and Gender
Program Full-Time Part-Time Total
No.
Total FTE
Male Female
Tot al No. Tot al FT E Mal e Femal e Tot al No. FT E No. FT E Bachelor's ALA-Accredited Master’s -- Library Science Master’s -- Information Science* Other Master’s Specify by degree name(s) Post-Master’s Doctoral TOTAL Other Undergraduat e Other Graduate
Of the TOTAL FTE, indicate the number of FTE students off campus:
Table II-1 collects data on full-time and part-time enrollment, both head count and FTE, total head count and FTE data, as well as the distribution by gender of these students, for each program level.
Please report data for students officially enrolled in Fall 2002.
To report the number of students enrolled in each program, use your parent institution's method for computing student full-time equivalence (FTE). If such a formula is not available, use the following: Consider a student full-time if the course load will enable requirements for the degree to be completed within the normal length of time. For example, if the normal time to complete the degree is 12 courses in 4 quarters, a student carrying 3 courses during the quarter should be counted as 1.00 FTE; a student carrying 2 courses during the quarter should be counted as 0.67 FTE (2/3 = .067). Students carrying an overload should be counted as only 1.00 FTE. In the space below, continue on the back if necessary, please supply the formula you used to compute the FTE. If the FTE formula is differs by program level please give each formula used and the program level with which it is associated.
Program Definitions1
Bachelor's: Include here only those students who are working toward a bachelor's degree in library and information science, regardless of whether offered on or off campus. Do not include students taking courses as cognate or service courses. Report them as “Other Undergraduate.”
ALA-Accredited Master's -- Library Science: Include here only those students working towards a separate master's degree in library science or a combined library and information science degree accredited by ALA, regardless of whether offered on or off campus. Do not include students taking courses as cognate or service courses. Report them as “Other Graduate.”
Master's -- Information Science: Include here only those students working towards a separate master's degree in information science, whether accredited by ALA or not. Include students taking course on or off campus. Do not include students taking courses as cognate or service courses. Report them as “Other Graduate.”
Other Master’s: Include here those students working towards a separate master's degree other than the ALA-Accredited Master’s -- Library Science or Master’s -- Information Science (either ALA-accredited or not) offered by your school, regardless of whether offered on or off campus. . Do not include students taking courses as cognate or service courses. Report them as “Other Graduate.”
Post-Master's: Include here only those students who are working toward a post-master's degree or certificate in library and information science, regardless of whether offered on or off campus. . Do not include students taking courses as cognate or service courses. Report them as “Other Graduate.”
Doctoral: Include here only those students who are working toward a doctoral degree in library and information science, regardless of whether offered on or off campus. Do not include students taking courses as cognate or service courses. Report them as “Other Graduate.”
Other Graduate: Include here students taking library and information science courses as cognate or service courses or for professional development, regardless of whether offered on or off campus.
Other Undergraduate: Include here students taking library and information science courses as cognate or service courses for undergraduate credit, regardless of whether offered on or off campus. Do not include students who are in an established undergraduate program in library and information science.
Table II-2
Number of Courses by Number of Students Enrolled
Course enrollment 1-5 10 6- 11- 15 16- 20 21- 25 26- 30 31- 35 36- 40 41- 45 46- 50 >50
Number of Courses or Sections of Courses
Total number of students enrolled in independent study or reading courses:
If there is an entry in the >50 column, please comment at the bottom of this page.
Table II-2 collects data on course enrollments.
Please report data for students officially enrolled in Fall 2002.
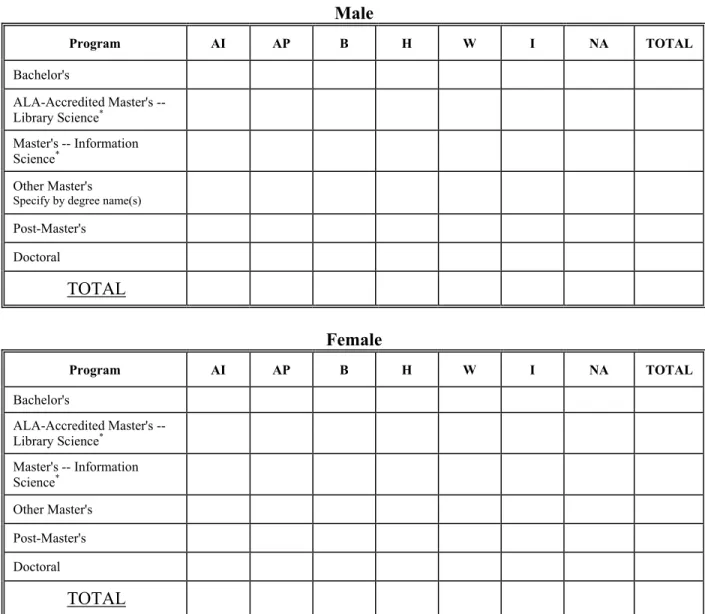
Table II-3
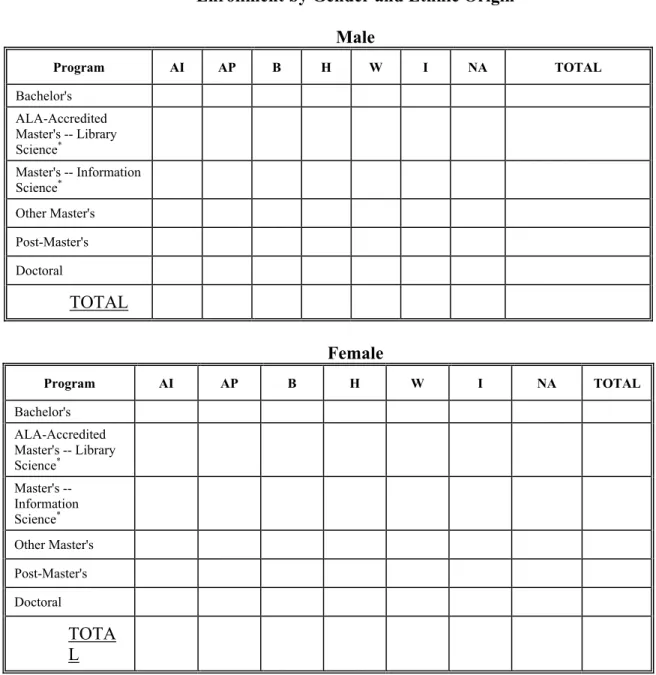
Degrees and Certificates Awarded by Gender and Ethnic Origin
Male
Program AI AP B H W I NA TOTAL
Bachelor's
ALA-Accredited Master's -- Library Science*
Master's -- Information Science*
Other Master's
Specify by degree name(s)
Post-Master's
Doctoral
TOTAL
Female
Program AI AP B H W I NA TOTAL
Bachelor's
ALA-Accredited Master's -- Library Science*
Master's -- Information Science*
Other Master's
Post-Master's
Doctoral
TOTAL
Table II-3 collects data on the number of graduates, as well as the gender and ethnic origin or international student status of these graduates, for each program of study.
Please report data for degrees and certificates awarded in the 2001-2002 academic year (Fall 2001
through Spring 2002 and the 2002 summer sessions). US schools should supply breakdowns by ethnic group; Canadian schools may supply breakdowns if these data are available. All schools should supply totals.
Please note that international students should be reported only in the “I” column and not in any of the
ethnic categories. The ethnic category columns are limited to reporting of students who are US. (or Canadian, for Canadian schools) citizens, permanent residents, or landed immigrants.